BTC 1H Analysis - Key Triggers Ahead | Day 53☃️ Welcome to the cryptos winter , I hope you’ve started your day well.
❤️ I sincerely apologize to everyone in the channel — I’ve been down with a cold for several days. Now, let’s dive into the 1-hour Bitcoin analysis.
⏰ We’re analyzing BTC on the 1-Hour timeframe .
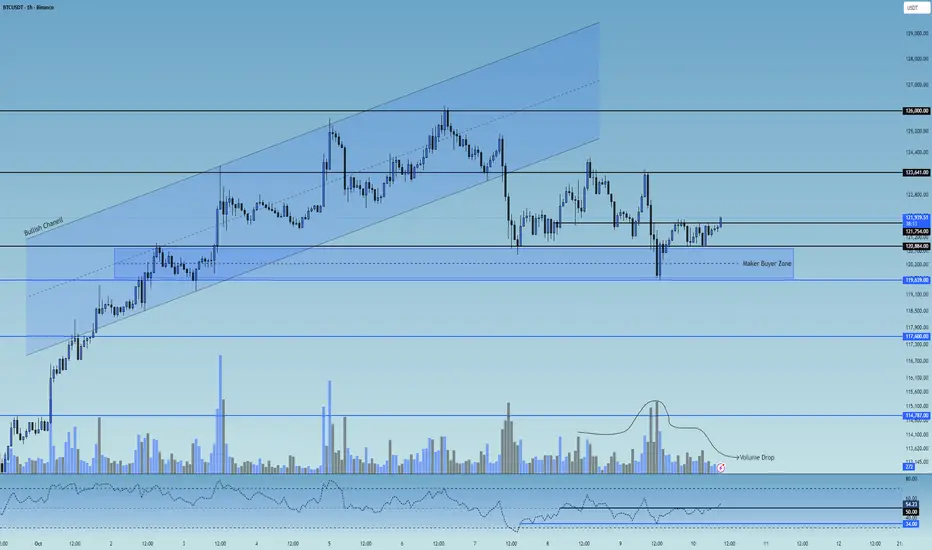
👀 In the 1-hour timeframe, after a strong bullish rally, Bitcoin broke below its ascending channel and moved toward the $121,000 support zone. From there, increased buying volume pushed the price upward, but it got rejected from the $123,600 resistance** and pulled back, creating a long trigger at that zone.
As it moved toward lower support levels, it formed a micro buyer zone between $119,640 and $120,884, where each time price enters this zone, Bitcoin experiences noticeable buying pressure.
🧮 Looking at the RSI oscillator, after ranging below the 50 level, it’s now trying to break above it. The 50 level has become a **strong static resistance, while there’s swing support near 34.
If the RSI breaks out of these marked zones, it could trigger stronger volatility and expand both **short and long trading opportunities.
🕯 The size and volume of recent candles on the 1-hour chart show range-bound movement, weak momentum, and market indecision, forming a **multi-timeframe trading range** where the top and bottom boundaries act as trigger zones.
The **micro buyer zone is where buyers aggressively defend price through market orders, preventing further downside — a reversal candle forming inside this zone is a strong example of that.
▶️ **Today’s economic news related to U.S. monetary policy can impact the market significantly. Since Bitcoin is currently in a small trading range, upcoming volatility spikes from the news could provide short-term setups.
↗️ Risky Long Scenario:
Look for a breakout above the marked $121,754 zone, accompanied by an engulfing candle, **indecision signal, SMA-7 confirmation, and increasing volume in the direction of the breakout — especially if the news comes out risk-on (positive for markets).
📉 Very Risky Short Scenario:
If price breaks below the micro buyer zone and loses the swing RSI support near 33, Bitcoin could enter a deeper correction.
However, note that a drop in Bitcoin’s price often increases its attractiveness compared to other assets, so avoid rushing into shorts.
❤️ Disclaimer : This analysis is purely based on my personal opinion and I only trade if the stated triggers are activated .
Oscillators
KR price is showing signs of strength; now it just needs volumeKroger (KR) has moved into an uptrend on the daily chart, forming a higher trough followed by a higher peak. Upside momentum is improving, confirmed by a break of the downsloping trendline, while the RSI has risen above 50 — a positive sign for near-term strength.
The longer RSI holds above 50, the greater the likelihood of continued price appreciation. One area that appears lacking, however, is volume, with the OBV not yet showing a corresponding pickup in accumulation.
Nevertheless, the EMAs are aligned in a bullish formation, and if they begin to develop angle and separation alongside a firm RSI, KR’s price is likely to show further underlying strength.

OCT 9: HTF POI + CONFLUENCE ALIGNMENTOCT 9: HTF POI + CONFLUENCE ALIGNMENT
- price lost momentum at the 4H FVG
- RSI + CVD DIVERGENCE at the 15m TF and below
- Price respecting divergence
- targeting long towards premium LVN + FVG
only thing to do is to wait.

Bearish Divergence Builds in U.S. Small CapsThe U.S. small-cap contract has struggled above 2492 recently, delivering multiple failed bullish breakouts from the high established on September 23. With bearish divergence between price and RSI (14) evident, the longer this iffy price action persists, the more it may encourage bears to seek out a larger downside flush.
Should we see another failed breakout attempt above 2492, shorts could be established beneath the level with a stop above the recent highs to protect against reversal. 2450 is the first downside level of note, albeit a minor one. For shorter-term types, it’s a potential target, although uptrend support running from September 2 screens as a more important level should we see a pullback. If the price were to crack that level convincingly, it may spark a faster unwind towards the 50-day moving average, which the contract bounced strongly from the last two times it was tested. Both levels provide targets for longer-term traders.
As a reminder, the underlying Russell 2000 index remains very much a play on the U.S. interest rate outlook and, consequently, broader domestic economic conditions. With nearly four rate cuts priced by the Fed’s September meeting next year, it’s provided meaningful tailwinds for non-profitable, capital-reliant firms without sparking any real concern about a looming U.S. recession.
However, with few signs the government shutdown will end anytime soon, coupled with prominent headlines surrounding private debt markets and iffy price action in other riskier asset classes, it’s not difficult to see potential macro landmines. Tailwinds from any increase in rate cuts would likely be overridden quickly if driven by concerns about increased volatility stemming from another economic downturn.
For small-cap bulls, there is such a thing as too much of a good thing when it comes to the magnitude and speed of rate cuts. Be careful what you wish for.

Silver MonthlyTarget for the next several months is ~20 usd
The sooner we hit it, the sooner we can start another bullish leg.
Short Term Targets are bullish ~23 usd
Anything can happen in this market, as JPM, Deutsche, USB, HSBC have all been fined for spoofing or manipulating the silver market in the past 3-4 years.

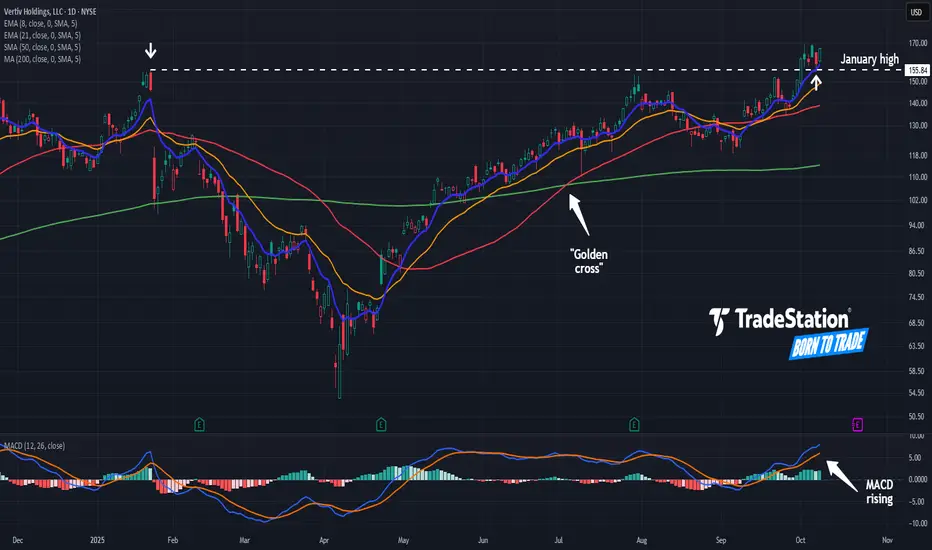
Vertiv May Have Broken OutVertiv was an early leader in the AI rally, and now it may be breaking out again.
The first pattern on today’s chart is the January high of $155.84. The provider of data-center power and cooling products began October by breaking above that level. This week, it pulled back to test it. Has old resistance become new support?
Second, prices wavered on either side of their 50-day simple moving average (SMA) for a few months and could now be accelerating from that line.
Third, the 50-day SMA had a “golden cross” above the 200-day SMA in July. That may suggest its longer-term uptrend is resuming.
Next, the 8-day exponential moving average (EMA) is above the 21-day EMA. MACD is also rising. Those signals may indicate the short-term trend has grown bullish again.
TradeStation has, for decades, advanced the trading industry, providing access to stocks, options and futures. If you're born to trade, we could be for you. See our Overview for more.
Past performance, whether actual or indicated by historical tests of strategies, is no guarantee of future performance or success. There is a possibility that you may sustain a loss equal to or greater than your entire investment regardless of which asset class you trade (equities, options or futures); therefore, you should not invest or risk money that you cannot afford to lose. Online trading is not suitable for all investors. View the document titled Characteristics and Risks of Standardized Options at www.TradeStation.com . Before trading any asset class, customers must read the relevant risk disclosure statements on www.TradeStation.com . System access and trade placement and execution may be delayed or fail due to market volatility and volume, quote delays, system and software errors, Internet traffic, outages and other factors.
Securities and futures trading is offered to self-directed customers by TradeStation Securities, Inc., a broker-dealer registered with the Securities and Exchange Commission and a futures commission merchant licensed with the Commodity Futures Trading Commission). TradeStation Securities is a member of the Financial Industry Regulatory Authority, the National Futures Association, and a number of exchanges.
TradeStation Securities, Inc. and TradeStation Technologies, Inc. are each wholly owned subsidiaries of TradeStation Group, Inc., both operating, and providing products and services, under the TradeStation brand and trademark. When applying for, or purchasing, accounts, subscriptions, products and services, it is important that you know which company you will be dealing with. Visit www.TradeStation.com for further important information explaining what this means.
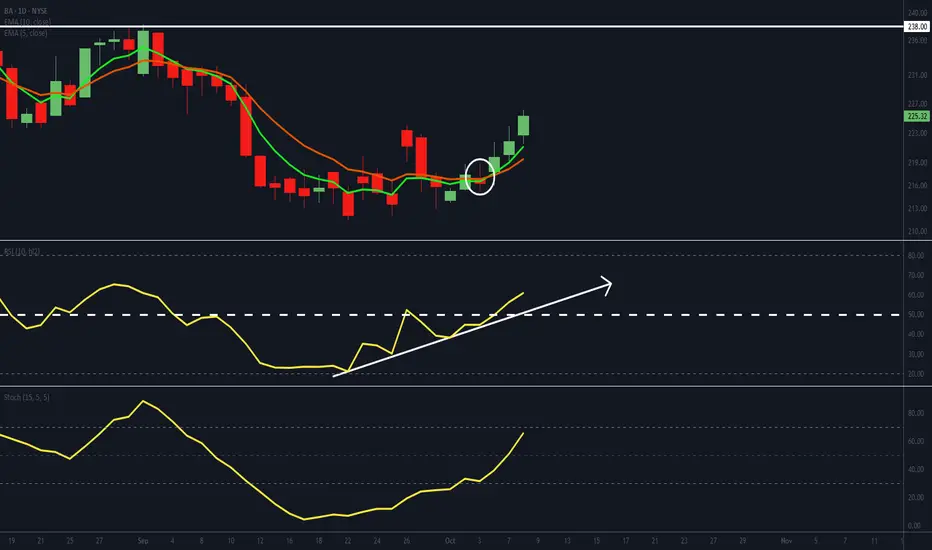
BA setting up for potentially strong move
- BA's EMAs have crossed bullishly and are developing angle and separation.
- Its RSI has popped above 50, suggesting a shift to positive momentum.
- Its stochastic is on the borderline to cross through 70. A move above, will add to the positive momentum argument. The longer it maintains above 70, the greater the likelihood of further price appreciations.
- Overhead resistance is at 238. A break above will be regarded as a bullish development.
Netflix Buy Alert!! The Rising 3 Soldiers Candlestick Patterns I did my first stream about two days ago.I was so sacred and nervous.
"This is a public stream, I better make sure I know what am talking about. I better make sure I show the pips my very best setups for trading."
I tell you I was super depressed because I want to be a good trading leader.
So I have been grinding trying to make sure I perfect my trading strategy and system and skills.
Because I want to show you the best of the best trades I can find.
No more just forex...or stocks I just want to be a great
technical analyst.
So today I did another stream and I had one person watching me trade live.
If you watch me trade analysis live you will really enjoy it 👍😊
It was an awesome stream.This is my business goal to become a streamer.
But am hoping for more viewers tomorrow.
Look at Netflix NASDAQ:NFLX
It's
Above the 50 MA
Above the 20 EMA
Above the 200 EMA
Notice the rising 3 soldiers 🟩🟩🟩Bullish candlestick patterns?
Notice how the last green candle
Gaps up? In green 🟢
The candlestick patterns are your confirmation of entry.
Netflix also has an earnings report coming soon.
This makes it's a perfect candidate for what Tim Sykes calls an earnings winner.. according to his book penny stock guide.
They are rumours that Netflix will partner with Warner Music to make movies based on it's artists such as Bruno Mars.
This report hasn't been confirmed yet.
Do you see how pop culture is linked to the financial markets? Like I told you yesterday?
This is a great stock to trade and ride the 🚀.
Rocket Boost This Content To Learn More.
Disclaimer ⚠️ Trading is risky please learn about risk management and profit taking strategies.Also feel free to use a simulation trading account.

Bearish Setup Builds in GBP/AUDSitting in a descending triangle pattern, a downside break of 2.0300 in GBP/AUD may elicit further selling, putting lower levels in play.
Should we see a decisive break of 2.0300, shorts could be established with a tight stop above for protection, targeting 2.0065, which the price tagged on multiple occasions earlier this year before staging a decisive break higher.
While bearish momentum is not strengthening, signals from RSI (14) and MACD both favour playing the pair from the short side, sitting below 50 and 0, respectively.
Good luck!
DS

OCT 8: MMT + VOLUME PROFILE LOL LET'S SEE HOW IT GOESOCT 8: MMT + VOLUME PROFILE LOL LET'S SEE HOW IT GOES
Kinda getting lazy putting these descriptions here, or maybe I just don't want to at this point in time. just check the latest long position I made here and check it for yourself why I came to that conclusion lol.
but if not then here's the idea:
- TARGET/BIAS = WEEK TARGET + LVN + FVG (that price didn't fully mitigate/take over/ breakthrough etc)]
- NARRATIVE = FVA coming off of previous high breakout and continuation supported by RSI & CVD, + AVWAP FLIP
- ENTRY = FVA RE-TEST
That's it.


Stock Influencers + 3-Step Rocket Booster Strategy Some days back there was a superstar actress that did an advertisement
For this company.
It was full of nice imagery,but then this ad caused that big Gap up you see
To the left of this chart?
This famous actress, Sydney Sweeney, 👖caused that gap 🤔
Influence is a big part of the financial markets.Maybe you are thinking
Becoming a trader means
You old school and you won't roll with the "latest" pop trends.
But that won't be the case.
Infact trading and pop culture are very much related.You will be shocked.
Just check the breakingnews tab below the price on tradingview.
Financial markets will always be a part of pop culture. Why?
Because entrepreneurs and investors always work together.
Remember that I actually noticed that one of my followers comes from the Andrew tate community.
Yes man, 😊 am a mini - influencer in the financial markets.
So this skill is not a small thing rich people will value your knowledge the moment you master trading.
This pattern follows the 3 Step
Rocket 🚀 Booster Strategy:
👉The price has to be above 50 EMA
👉The price has to be above 200 EMA👉The price should gap up
That last step you can clearly see on the chart.
And what I love about this chart is that the support is clear. From the appearance of the gap.
This gives you confidence that the price wont go lower.
Liquidity is above 500K volume
The price is "sitting" on the 50 EMA.
I need to document this strategy because I want a 🔥 fire trading system that works.
Join me on this trading journey to discover a powerful trading system.
Disclaimer ⚠️ Trading is risky please learn about risk management and profit taking strategies.Feel free to use a simulation trading account before you use real money.

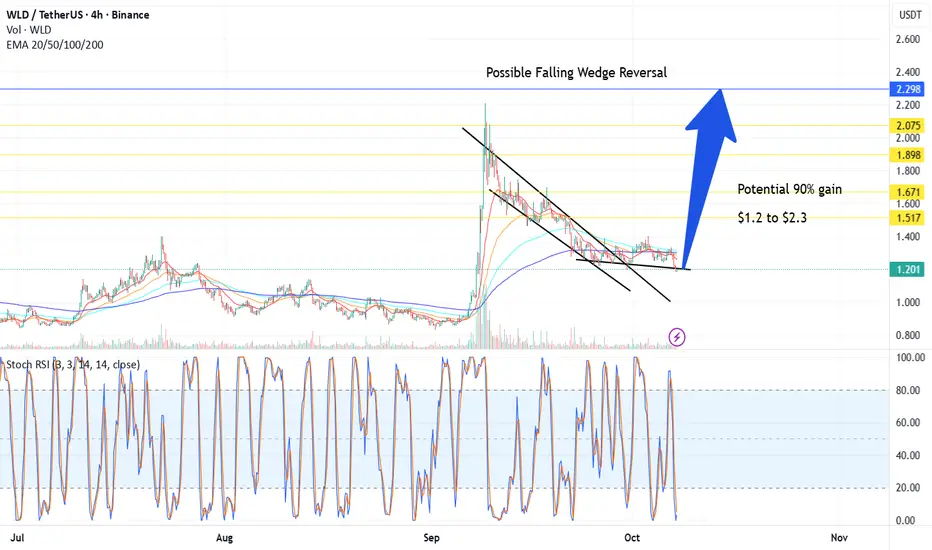
Possible Falling Wedge Reversal +90% run – 4H Setup - Worldcoin BINANCE:WLDUSDT could gain 90%
⚙️ Setup
Price has been trending down within a well-defined falling wedge since the local high.
Currently, it’s testing the lower trendline with Stochastics oversold and curving up, suggesting waning bearish momentum.
Volume has compressed, which is typical before a breakout.
We’re now at a decision point: either a bounce and breakout or a confirmed wedge failure.
Stochastics: Oversold (<20) with a possible bullish cross forming.
Volume: Decreasing — consistent with the final stages of compression.
EMAs: Price hovering around/under short EMAs (20–50); a close above them could trigger momentum shift.
📈 Plan / Hypothesis
Watching for bullish breakout confirmation above the upper trendline with increased volume.
Target: Height of the wedge projected upward (~ from breakout point).
Invalidation: 4H candle close below the lower trendline with volume expansion.
💭 Fundamenteal Thought:
We may or may not like Altman or Worldcoin's course of action to learn how to validate humanness, but the thing is, it's the only exposure we have to OpenAI and ChatGPT, and with AI everywhere, we are gonna need more than ever to validate people being real.
Considering Open AI, the disease, being worth $500 Billion, I think that the potential cure that Altman himself fabricated, Worldcoin, having a market cap of less than $3 Billion is pretty cheap. There's still many token to airdrop.
Anyhow, it all depends on what utility the token ends up delivering, I see that if this token is used to validate humanness, this will be really valuable. And ofc of what competitors do.
The #1 Stock Buying Secret:Buying Undervalued Stocks A long time ago their was this
Young girl that I pursued.
She said no to my proposal.
She even told me,
"Lubosi I can't be your girlfriend,
My boyfriend works for the mines,
He won't be happy"
This happen during our date when I took her for ice cream.
I felt stupid and like an amateur.
When you enter the Ascending Triangle
+ The Long lower shadow candlestick patterns
You will find this stock.
What I love about this idea
Is the fact that it's following
The 3 month moving average + it's undervalued.
You can see the reversal by using
👉The Stochastic indicator.👈
It's in a oversold channel.
Buying undervalued stocks
Is the Hallmark of trading.
Remember don't use margin.
You want to taste your
Strategies for about 1 year
On a simulation trading account before you use real money.
Rocket Boost This Content To Learn More.
Disclaimer ⚠️ Trading is risky please learn about risk management and profit taking strategies. Also feel free to use a simulation trading account before you use real money.

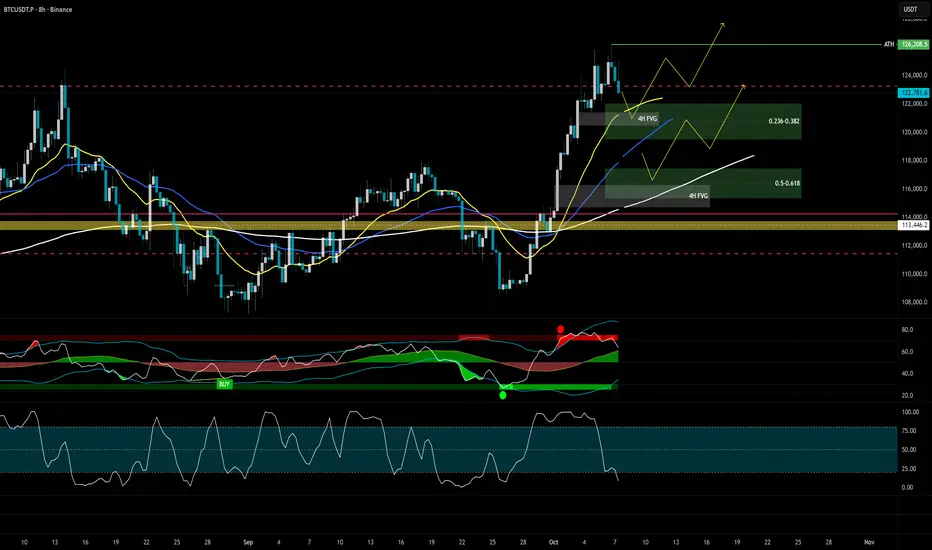
BTC 8H chart - bullish fibonacci pullback zones for resersalCRYPTOCAP:BTC 8H. Not worried about the pullback. Expecting it to hold bullish fibonacci pullback zones.
I have high probability two scenarios in mind approx. 4-8% pullback.
Notice lower oscillator indicator, Stoch RSI on 8H already starting to build momentum at the bottom zone.
Might take couple of days to consolidate in those levels.
Trying to find a base (USD/CHF)Setup: Possible bottom. Two failed breaks below 0.79 + RSI bullish divergence.
Signal : Waiting for daily close above down trendline
Plan B A weekly close below 0.79 shows long term downtrend stil in tact
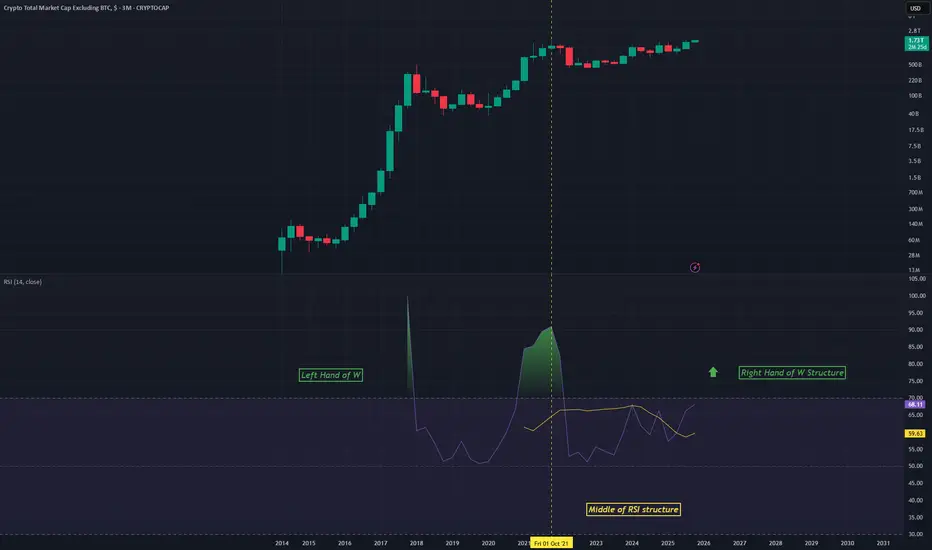
TOTAL2 - RSI StructureAn idea using the RSI on the Monthly chart for TOTAL2
A sort of W pattern is forming on the RSI
We are about to experience the right hand of this W structure which is a bullish phase
Long big altcoins
USDT.D 4H Analysis - Key Triggers Ahead☃️ Welcome to the cryptos winter , I hope you’ve started your day well.
⏰ We’re analyzing USDT Dominance on the 4-Hour timeframe .
👀 On the 4-hour timeframe, USDT Dominance has started to recover after its recent drop, bouncing from the support zone at 4.17% and now moving upward, forming a reaction to the previous bearish leg. The structure shows a steep descending trendline, and once broken and confirmed above, dominance could move toward its next resistance zones and enter a correction phase relative to its previous leg. The key resistance levels to watch are 4.33% and 4.38%.
🧮 The RSI oscillator currently faces a static resistance around 45. If volatility pushes above this level and holds, it would confirm bullish momentum and act as a signal for correction continuation.
🕯 The recent candles on Tether Dominance have shown range-bound behavior with weakening bearish pressure, while the 4.17% support has attracted buyers — causing an increase in bullish candles and momentum toward upper resistance zones. A breakout above the descending trendline could confirm a corrective move upward, which seems quite plausible given the current 4H candle structure.
🧠 For profit-taking strategies, you may consider securing partial profits from your open long positions, or moving your stop-losses into profit to protect gains. Meanwhile, start refreshing your watchlist and identifying new price triggers so that you can re-enter positions after reaction or breakout confirmations from upcoming setups.
❤️ Disclaimer : This analysis is purely based on my personal opinion and I only trade if the stated triggers are activated .

Bullish Trend - Bullish Divergence - ABCD ContinuationFX:AUDUSD has continued its bullish trend, surpassing major resistance levels.
Currently, price has completed a 0.618 fib retracement, made bullish divergence and broke the lower highs, signalling imminent bullish momentum.
I am expecting price to complete the ABCD projections!

Bitcoin dominance surge to 70%On the above 10-day chart Bitcoin dominance is plotted over the last 4 years. Could talk about this chart for hours. Sparing you from that, here’s the highlights:
1) The Elliot impulse wave and following corrective wave from 2018 to present day. BTC.D is now starting a new impulse wave.
2) The falling wedge + breakout. The flagpole extension measures a target to 70% dominance.
3) BTC.D reclaims the 10-day/21-week bull market support band. (Yellow line / Purple circle). Look left. Every time this happens price action goes to the preverbal moon.
4) Bitcoin prints a new all time high every two years. We’re currently in the accumulation year. Therefore we CAN expect a re-test of the all time high again during 2022. Moreover, in 2023 a new all time high is very probable.
5) What will the new all time high be? I don’t know. However there’s a clue in the weekly log growth curve chart (below). Price action is printing within a falling wedge pattern. A measured move from the flagpole extension puts price action into the $250k area by the end of next year with ease.
6) But price action might go to $20k! or $14k! Did you even read points 1 to 5?!
Ww
Weekly log growth curve

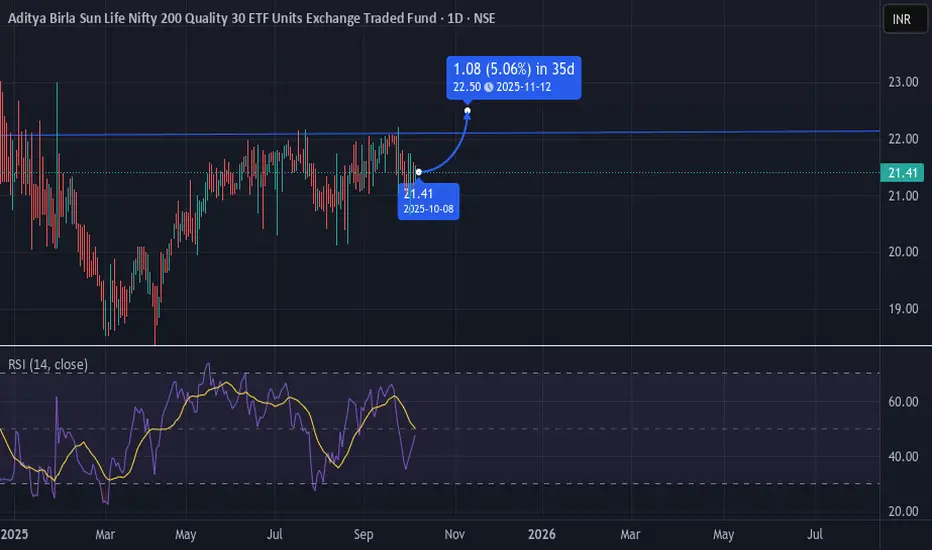
NIFTYQLITY LongNIFTYQLITY near resistance level, if this level breaks good chances of rally up
RSI level looks positive in long term 🟢
MOM30IETF Long positionMOM30IETF near resistance level, if this level breaks good chances of rally up
RSI level looks positive in long term 🟢

ETF ALPHA BullishExpect a short term long position based on RSI levels going strong.
Also tested support level two times.
