BTC Analysis 1H - Key Triggers Ahead | Day 32💀 Hey , how's it going ? Come over here — Satoshi got something for you !
⏰ We’re analyzing BTC on the 1-hour timeframe timeframe .
👀 On the 1H timeframe of Bitcoin, we can see that after yesterday’s news BTC moved upward but got rejected at the $112,300 zone. It then found support at the bottom of its ascending channel. Bitcoin is now waiting for tomorrow’s NFP release. The key level that price reacted to is $112,300 — a breakout above this zone could trigger another move to the upside. The current support is around $110,340, and if this level breaks, the next major support lies near $107,500.
⚙️ RSI key zones are at 36 and 70. If momentum breaks through these areas, Bitcoin could start a stronger move.
🕯 The size and volume of the recent red candles indicate selling pressure. However, when price bounced from the channel bottom, the bearish momentum weakened. If selling pressure increases and the support is lost, red candles may grow even larger.
📊 Looking at the 1H Tether dominance (USDT.D), after the recent drop it shows signs of a rebound and is completing its pullback on this timeframe. The key zones to watch are 4.39% and 4.47%. A breakout above these levels could bring significant trading volume into Bitcoin.
🔔 Alert zones for Bitcoin are set at $110,340 and $112,334. A breakout of either zone could provide us with trade opportunities. Keep in mind that the current structure is ranging and compressed, so it’s better to trade with lower risk.
❤️ Disclaimer : This analysis is purely based on my personal opinion and I only trade if the stated triggers are activated .
Oscillators

Will Cameco Continue Higher?Cameco has consolidated after breaking out to new highs, and now some traders may think it will continue upward.
The first pattern on today’s chart is the series of lower highs between late July and late August. The uranium stock has been attempting a potential breakout through this line, which could potentially open the door to new buyers.
Second, the 50-day simple moving average (SMA) had a “golden cross” above the 200-day SMA in June and has remained above it since. It’s also now holding the 50-day SMA. That kind of price action may be consistent with bullish long- and intermediate-term trends.
Third, MACD is showing signs of turning higher, and the 8-day exponential moving average (EMA) has crossed above the 21-day EMA. Could that be viewed as bullish in the short term?
Finally, CCJ made a low in early August and a lower low in late August. It then began September by making a higher low. That may further suggest the period of consolidation is nearing an end.
TradeStation has, for decades, advanced the trading industry, providing access to stocks, options and futures. If you're born to trade, we could be for you. See our Overview for more.
Past performance, whether actual or indicated by historical tests of strategies, is no guarantee of future performance or success. There is a possibility that you may sustain a loss equal to or greater than your entire investment regardless of which asset class you trade (equities, options or futures); therefore, you should not invest or risk money that you cannot afford to lose. Online trading is not suitable for all investors. View the document titled Characteristics and Risks of Standardized Options at www.TradeStation.com . Before trading any asset class, customers must read the relevant risk disclosure statements on www.TradeStation.com . System access and trade placement and execution may be delayed or fail due to market volatility and volume, quote delays, system and software errors, Internet traffic, outages and other factors.
Securities and futures trading is offered to self-directed customers by TradeStation Securities, Inc., a broker-dealer registered with the Securities and Exchange Commission and a futures commission merchant licensed with the Commodity Futures Trading Commission). TradeStation Securities is a member of the Financial Industry Regulatory Authority, the National Futures Association, and a number of exchanges.
TradeStation Securities, Inc. and TradeStation Technologies, Inc. are each wholly owned subsidiaries of TradeStation Group, Inc., both operating, and providing products and services, under the TradeStation brand and trademark. When applying for, or purchasing, accounts, subscriptions, products and services, it is important that you know which company you will be dealing with. Visit www.TradeStation.com for further important information explaining what this means.

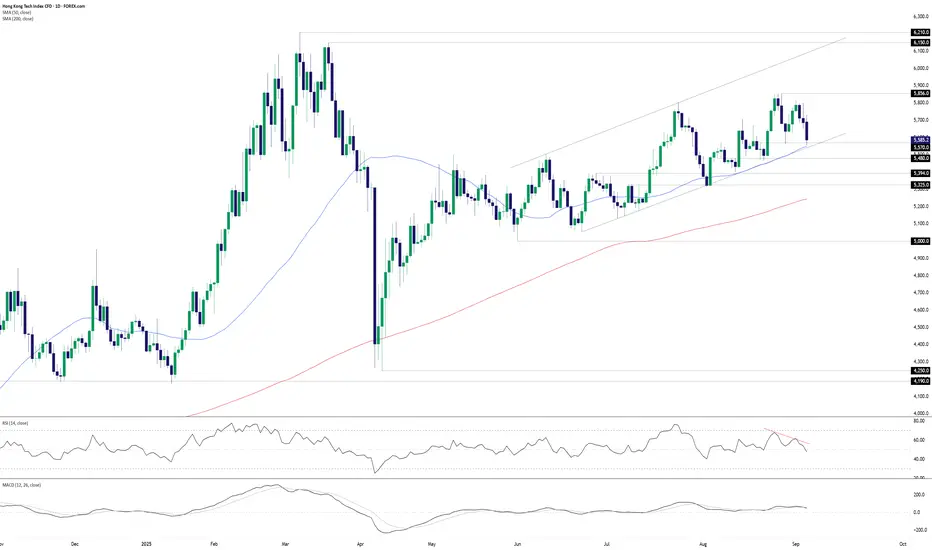
Hang Seng Tech: Bulls and bears face off at key supportThe downside we were looking for in Hang Seng Tech has played out quickly, with the trade hitting its initial target in less than three days. Price is now sitting at a known support level, creating the opportunity to assess both bullish and bearish setups depending on how it closes the session.
If it can finish above the 50DMA and channel support, longs could be established with a tight stop beneath the uptrend for protection. 5700 is the first obvious target given it’s a big figure, with a push through that improving the odds of a retest of resistance above 5800.
If it closes beneath the 50DMA and channel support, the setup flips. Shorts could be established on the break with a stop above the 50DMA for protection. Downside targets include 5480, 5394, or 5325 — pick the one that best matches your preferred risk-reward profile.
Momentum signals are leaning bearish. RSI (14) has slipped below 50 and continues to trend lower, while MACD has staged a bearish crossover, though it remains in positive territory — more a cautious warning than a definitive bearish tilt.
That said, the broader bias remains bullish with both the 50 and 200DMAs still trending higher despite the recent pullback.
Good luck.
DS
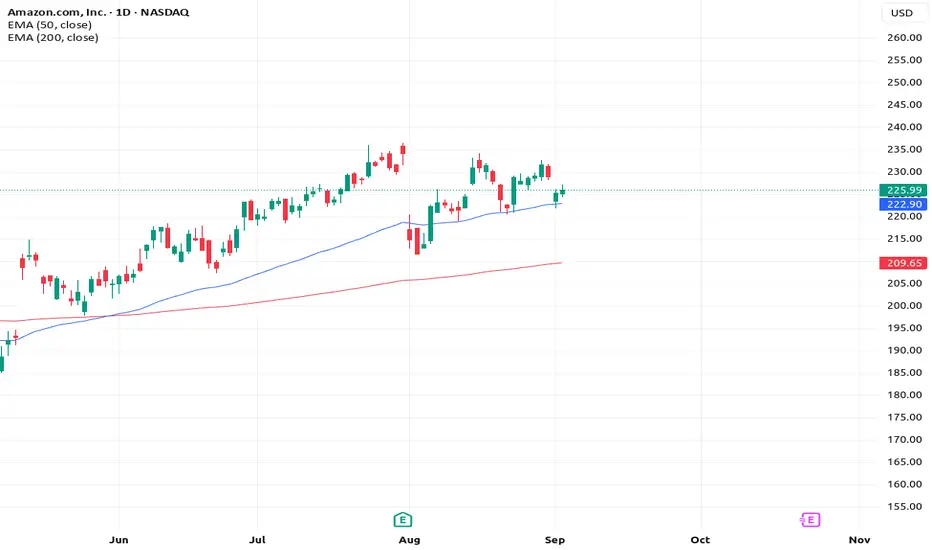
Rocket Booster Strategy – 3 Steps + Amazon (AMZN) 🚀 Amazon (AMZN) – Multi-Timeframe Technical Setup
Daily Chart:
On the daily chart, the technical summary shows a neutral rating. Both the oscillators and moving averages are neutral. Digging deeper, the MACD is signaling a sell, hinting at short-term hesitation.
Weekly Chart:
Shifting to the weekly chart, the oscillator rating also appears neutral initially. However, examining momentum reveals a pullback forming—the exact setup we want to spot for a potential continuation. Bingo!
Monthly Chart:
On the monthly chart, the long-term picture is bullish. Moving averages show a strong buy, with price comfortably above the 50 EMA and 200 EMA. Add in a gap up, and Amazon looks ready for a potential upward surge.
🚀 Rocket Booster Strategy – 3 Steps
Daily Chart – Spot Neutral or Short-Term Weakness:
Look for neutral technical summary or short-term sell signals like MACD to identify hesitation in the short-term trend.
Weekly Chart – Identify Momentum Pullback:
Examine weekly momentum indicators to find pullbacks—this is where you prepare for a continuation in the trend.
Monthly Chart – Confirm Long-Term Strength:
Check moving averages (50 EMA & 200 EMA). Price above these with gap-ups signals strong long-term bullish alignment—the “rocket booster” for your trade.
This combination of short-term caution, medium-term pullback, and long-term strength is the essence of the Rocket Booster Strategy.
Rocket Boost This Content To Learn More.
⚠️ Disclaimer
This article is for educational purposes only. Always use a simulation (paper) trading account to test strategies before trading live. Apply proper risk management and profit-taking strategies to protect capital.
Charts In 3 Steps-Bitcoin (BTC/USD) Buy Signal – Trend Resumes Bitcoin (BTC/USD) Buy Signal – Trend Resumes After Pullback ₿🚀
Bitcoin is also flashing a buy signal when viewed with the same 3-step system, showing strong confluence across timeframes.
Step 1 – Daily Candlestick: Bullish Reversal
On the daily chart, Bitcoin has printed a bullish engulfing/rejection candle, suggesting buyers have stepped in aggressively after a recent pullback. This is a strong reversal signal.
Step 2 – Weekly Oscillators: Sell / Strong Sell
The weekly oscillator rating is showing Sell / Strong Sell. This may appear bearish at first glance, but in the context of Bitcoin’s structural uptrend, it
signals a short-term dip that may provide an attractive entry zone before momentum turns bullish again.
Step 3 – Monthly Moving Averages: Strong Buy / Buy
On the monthly chart, Bitcoin remains firmly in a Strong Buy / Buy rating above its key moving averages. This confirms that the long-term uptrend remains strong, and pullbacks should be treated as buying opportunities.
✅ Daily Candlestick → Bullish reversal
✅ Weekly Oscillator → Temporary weakness offering entry
✅ Monthly MAs → Long-term bullish structure
Trade Idea: Traders may look for long entries on confirmation candles, with
stops below the daily reversal low. Profit targets could be staged toward recent highs and key psychological levels like $75,000 and beyond.
Disney (DIS) Buy Signal – Pullback Creates Opportunity 🎬📈
Disney (DIS) is flashing a fresh buy opportunity backed by multi-timeframe alignment in the 3-step trading system.
Step 1 – Daily Candlestick: Bullish Pattern
On the daily chart, Disney has printed bullish candlestick signals, including rejection wicks showing buyers defending support levels. This confirms demand is stepping in at lower prices.
Step 2 – Weekly Oscillators: Sell / Strong Sell
The weekly oscillator rating is in Sell / Strong Sell territory. This reflects short-term momentum weakness, but in the context of a bullish backdrop, this
pullback is often the perfect setup for positioning early before momentum swings back upward.
Step 3 – Monthly Moving Averages: Strong Buy / Buy
On the monthly timeframe, moving averages are firmly in Strong Buy / Buy mode. This confirms that the long-term trend is bullish and the bigger picture supports higher prices ahead.
✅ Daily Candlestick → Bullish trigger
✅ Weekly Oscillator → Short-term weakness = buy-the-dip setup
✅ Monthly MAs → Long-term trend intact and rising
Trade Idea: Traders may consider entering on dips with stops below recent daily lows. Potential upside targets include previous resistance zones and long-term highs.
⚠️ Disclaimer: These analyses are for educational purposes only and not financial advice. Trading stocks, forex, or crypto carries risks. Always test strategies on a demo account first , and make sure to use proper risk management and profit-taking strategies to protect your capital.

$SOL Rotation IncomingNow that the CRYPTOCAP:ETH hype has calmed,
it’s almost time for CRYPTOCAP:SOL
to rip the haters face off...
once again🎃

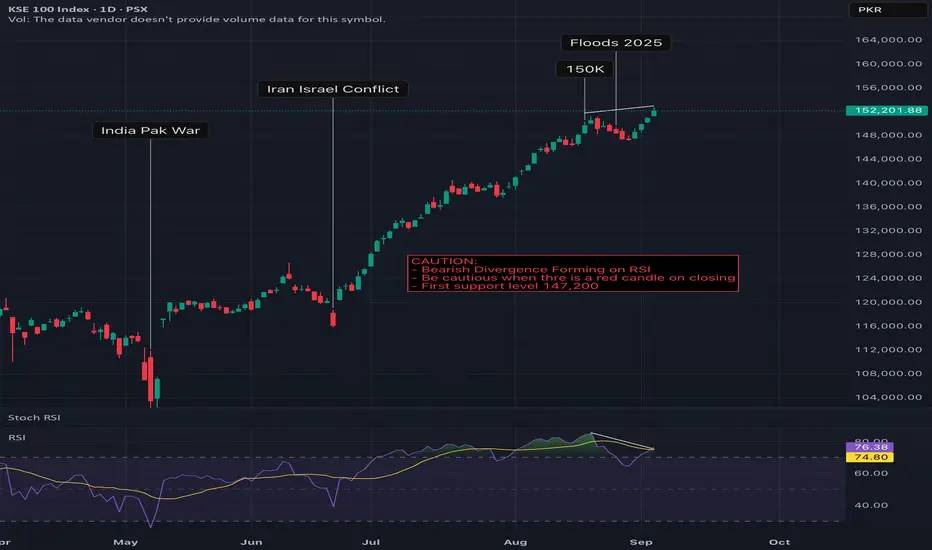
KSE 100 Index Bearish Divergence Forming
- Bearish Divergence Forming on RSI
- Be cautious when there is a red candle on closing
- First support level 147,200
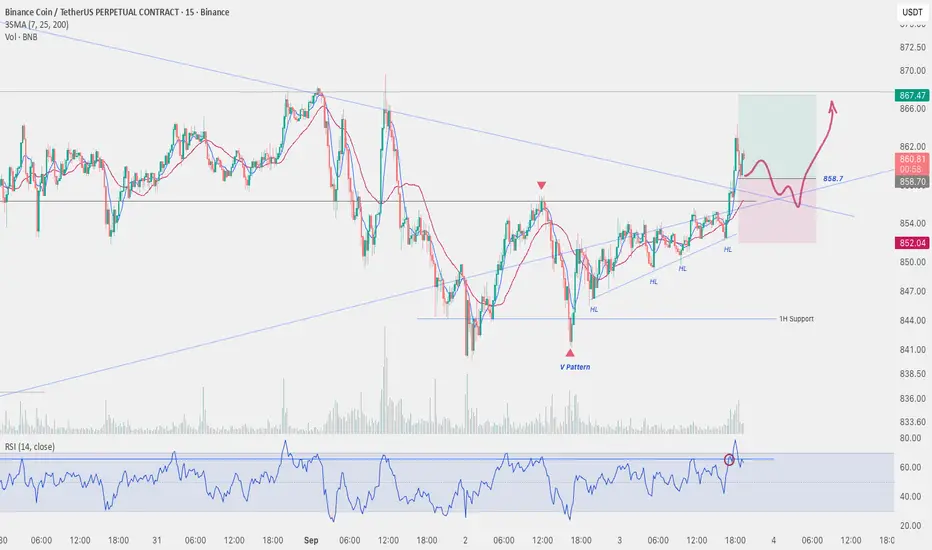
Sep 3, 2025 - BNBUSDT Long Position ReviewFor my last position today, I opened a long trade on BNB . After the price touched and reacted to the daily ascending trendline, I set my entry trigger above the first 1H resistance at 856 . Similar to other coins, the V-pattern that formed before the breakout gave me additional confidence in the bullish move.
Once the strong 1H candle closed above resistance, I placed a buy stop order above its wick at 858.7 for extra confirmation, which eventually triggered my entry.
I must admit, this trade was a bit emotional — it would have been better to wait for a confirmed medium wave cycle bullish structure before entering. On top of that, the BNB/BTC chart doesn’t look very bullish, which suggests I might have found a better setup on other coins. The main reason I rushed was the opportunity to use relatively high leverage on this setup.
📌 Stop-Loss Strategy
The main strength of this trade is the well-positioned stop-loss. Even if price decides to retest the broken descending trendline with a pullback, my stop would not be triggered prematurely.
⚠️ Overall, this is a risky position that is currently open. If I notice weakening bullish signals, I’ll likely exit early.
BNBUSDT Highwave-Cycle on 4H Timeframe:
BNB/BTC Chart:
ETH 1H Analysis - Key Triggers Ahead | Day 11💀 Hey , how's it going ? Come over here — Satoshi got something for you !
⏰ We’re analyzing ETH on the 1-hour timeframe timeframe .
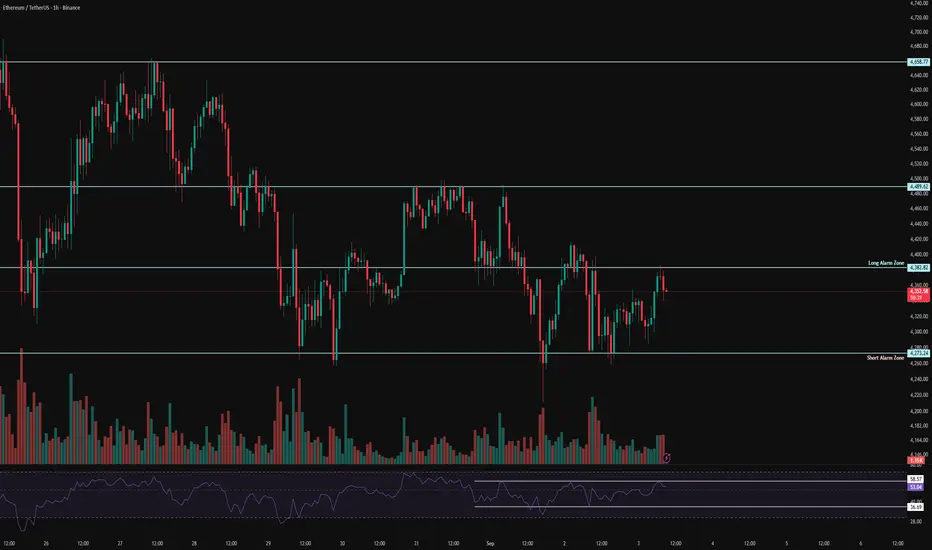
🔭 On the 1-hour timeframe of Ethereum, we can see that ETH has a similar situation to yesterday. It has an important resistance at $4382, and with a breakout and confirmation above this level, Ethereum could experience a good bullish leg. Keep in mind, according to the data we posted in the channel, yesterday people in the U.S. sold their ETH and bought Bitcoin.
⛏ Two key RSI zones for Ethereum are considered: 58 and 37. Once the oscillation limit crosses these numbers, ETH can start its move.
💰 The volume and the size of green candles in Ethereum have slightly increased, and with more volume and the filling of sell orders at the $4382 resistance, Ethereum could move upward.
🪙💸 On the 1-hour timeframe of the ETHBTC trading pair, we can see that this pair had a resistance at 0.03909, which was successfully broken with higher volume. With a completed pullback and breakout above 0.03939, Ethereum could move upward. Note that this level is directly related to the maker buyers of this pair, and in this timeframe, it’s almost at its bottom.
🔔 Two alarm zones are considered for Ethereum: the $4382 level as our long trade alarm zone, where with a breakout and confirmation above it ETH could move higher; and the $4273 level as the short trade alarm zone, where a breakdown could give us a short position.
❤️ Disclaimer : This analysis is purely based on my personal opinion and I only trade if the stated triggers are activated .
Sep 3, 2025 - HYPEUSDT Long Position ReviewConsidering the daily uptrend, the touch of the ascending trendline provided a good opportunity for a long setup.
On the 1H timeframe, after the formation of a range box with a fake breakdown to the downside, the first bullish signs appeared. As the range continued, the creation of higher lows confirmed stronger buying pressure. With the breakout of the box resistance, rising volume during the upward move, and the RSI entering the overbuy zone , conditions for a long entry became clear.
However, I decided to act earlier — with the increase in volume and the RSI moving higher, I placed a buy stop order at 45.60 to catch any sharp breakout.
This position is now active, and I’m waiting for the next targets to be assigned.

Sep 2, 2025 - SOLUSDT Long Position ReviewFollowing up on yesterday’s analysis, with each reaction to the 204.34 level, I became more confident about the presence of sellers above this zone. At the same time, since every rejection off this level was also creating a higher low , I decided to treat it as a risky long trigger.
After the breakout of this line and the 15m and 1H candle closing above it, I was still cautious, suspecting that the main sellers might be sitting around 206.24 .
At that point, as the RSI also reached its resistance line, I placed a buy stop order at 207 , just above the highest previous wick. I intentionally set the buy stop at the highest possible point to ensure that both price and RSI had convincingly broken their resistances.
This position is still open, and I’m now waiting for higher targets to be reached.

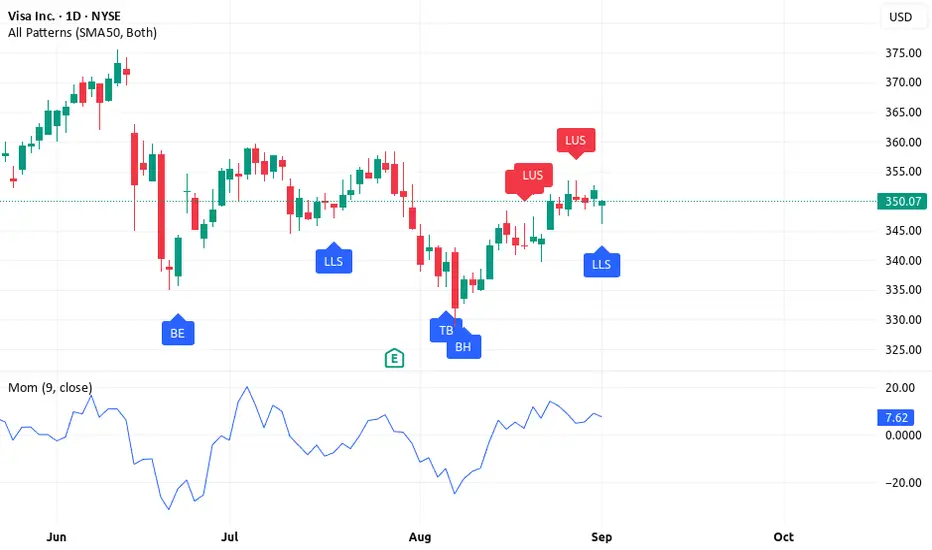
Visa (V) 3 Buy Signals – Trend, Momentum & Price Action Aligned Visa (V) Buy Signal – Multi-Timeframe Confirmation 🚀📈
Visa Inc. (V) NYSE:V is showing a fresh buy opportunity when viewed through the lens of the 3-step trading system: candlesticks, oscillators, and moving averages across different timeframes.
Step 1 – Daily Candlestick: Bullish Rejection
On the daily chart, Visa has printed bullish candlestick signals — including long lower shadows that show buyers stepping in to defend support. This suggests
demand is strong at lower levels and the path of least resistance remains upward.
Step 2 – Weekly Oscillators: Strong Sell / Sell
Interestingly, the weekly oscillator rating is currently on Sell / Strong Sell, showing momentum weakness in the short term. This isn’t necessarily bearish
for long-term buyers — in fact, it often signals a pullback inside a broader uptrend, giving traders the chance to accumulate at discounted levels.
Step 3 – Monthly Moving Averages: Strong Buy / Buy
The monthly moving average rating is firmly Strong Buy / Buy, confirming that Visa is in a long-term bullish trend. As long as price stays above these key levels,
the primary trend remains intact and pullbacks should be viewed as opportunities, not threats.
The Buy Case for Visa
Daily Candlestick → Bullish rejection signals buyers defending support.
Weekly Oscillators → Short-term weakness creating entry opportunities.
Monthly Moving Averages → Long-term bullish trend remains intact.
This alignment creates a classic buy setup: a strong trend supported by long-term moving averages, a temporary dip in weekly momentum, and a bullish candlestick trigger on the daily chart.
Trade Idea: Traders may consider long entries near current levels or on dips, with protective stops below recent daily lows. Profit targets could be staged at previous swing highs and beyond, in line with the monthly uptrend.
⚠️ Disclaimer: This analysis is for educational purposes only and not financial advice. Trading and investing carry risks. Before risking real money, it’s
recommended to practice on a demo account and develop solid risk management and profit-taking strategies.
Bitcoin upside brewing?Having completed something resembling a three-candle morning star reversal pattern, clearing downtrend resistance running from the record highs struck last month in the process, some upside may be on the way for bitcoin.
With RSI (14) breaking its downtrend and MACD starting to curl higher towards the signal line, there’s early evidence bearish momentum may be turning. That said, long setups still screen as going somewhat against the prevailing grain, so patience may pay when assessing bullish trades.
If BTC/USD breaks and closes above $112,000, longs could be established with a tight stop beneath for protection. The last attempted break ended in misery for longs, so risk management should be front and centre, including what to do with the stop if the price initially moves in your favour.
The August 28 high around $113,500 and the 50-day moving average both screen as potential targets, depending on desired risk-reward. If the latter were to be breached successfully, the probability of a run towards $117,000 resistance—where price struggled in the second half of August—would improve.
If the price cannot push and close above $112,000, the bullish setup is invalidated.
Good luck!
DS

$BTC.D Head and Shoulders Topple to 42%If I were a betting man, this is what the future holds for ₿itcoin Dominance.
A head and shoulders pattern could very well be the eventual topple for CRYPTOCAP:BTC.D as we see it make it's way down to 42% which follows previous cycle's trend.
the RSI shows room for correction back up for one more push.
the 20WMA bearish crossing below the 50WMA will be the nail in the coffin.

I am still bullish on EIGEN I am still bullish on EIGEN market just need some break I will go for this
I think it is B or C quality setup as well the RR is not seeming good so I will manage my margin in the account of this
I shared this post not because it is a well staged setup but motivation for myself.
So always manage your own risks, My charts are not investment advise

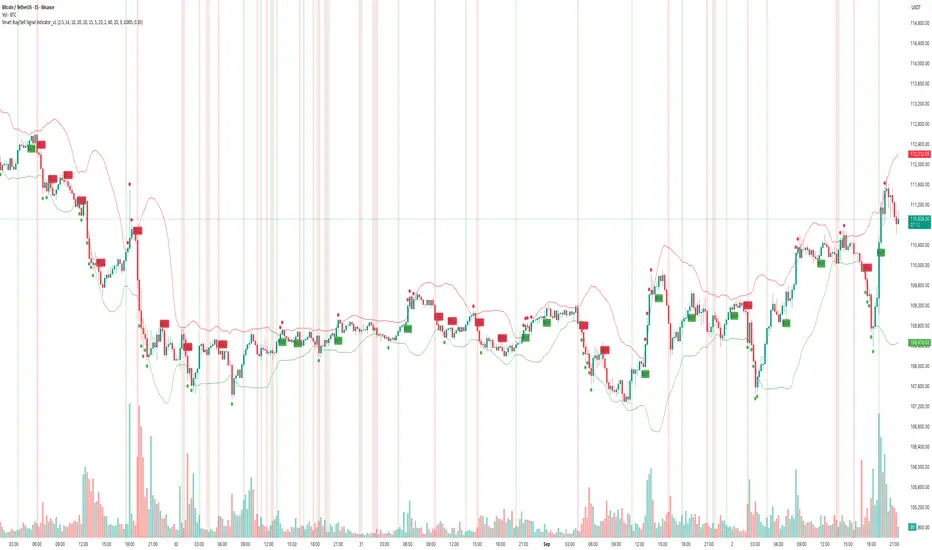
How to Use - Smart Buy/Sell Indicator — Real-Time & ReversalDescription
The chart above demonstrates how the Smart Buy/Sell Signal Indicator combines multiple conditions — Supertrend, RSI, ADX, Confirmation MA, and Bollinger Bands — to highlight potential trade opportunities in real time.
🔹 Core Signals
• Buy / Sell Triggers: Generated when trend, momentum, and volatility filters align.
• Reversal Clouds: Appear when RSI, ADX, and Bollinger extremes suggest potential exhaustion or traps.
🔹 Unique Aspect — Real-Time & Leading
Unlike many lagging tools, this indicator evaluates conditions during the live candle formation.
• If all rules align → signal appears immediately.
• If conditions fail before the candle closes → the signal disappears.
This design allows it to act as a leading signal generator, giving traders early heads-up rather than waiting for full candle confirmation. It emphasizes signal accuracy over repainting, by ensuring only valid conditions remain visible at close.
🔹 What Makes It Different
• Multi-factor confirmation (trend + momentum + volatility)
• Cooldown logic to avoid clustered signals
• Both continuation & reversal insights in one tool
• Adaptive to trending and sideways phases
📊 In the example above (BTCUSDT, 15m), you can see how signals align with both momentum-driven moves and intraday reversals.
⚠️ Note: This is an analytical tool, not financial advice. Performance varies across assets and timeframes. Always backtest and combine with risk management.
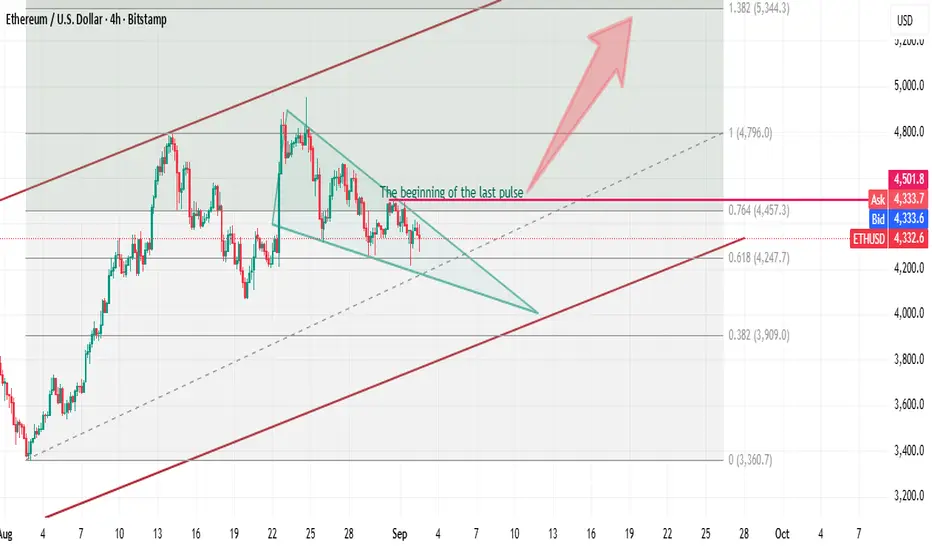
Descending wedge on Ethereum ETHUSDHello, dear traders.
Ethereum is moving in an uptrend. Locally, we see a correction forming in the form of a descending wedge.
The price is already close to the trend support level. According to FRL rules, an exit from a descending wedge is considered valid when the price consolidates above the start of the last impulse of this wedge, because its lows constantly update the lows.
Thus, at the moment, this level is at a price of 4500. But this wedge may continue, and this level may drop lower. In any case, this is already a great level that will break this descending wedge. In addition, a bullish divergence is forming on the MACD in H4.
The target of the potential downward movement is the 1.382 level according to Fibonacci levels.
These are my thoughts. What are your thoughts on the current situation?
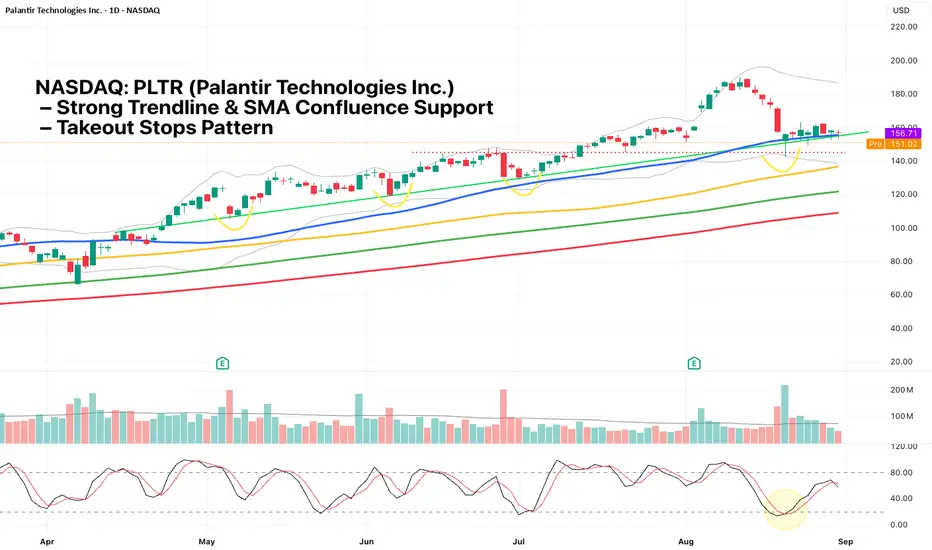
NASDAQ: PLTR – Strong Trendline & SMA Confluence SupportNASDAQ: PLTR Palantir remains in a clear uptrend with the moving averages aligned (SMA 50 > SMA 100 > SMA 150 > SMA 200). Since April, price has consistently traded above the 50-day SMA, finding support on each pullback to the trendline (green line). This trendline has been tested four times over the past six months, the latest on August 20.
On August 20, PLTR formed a hammer candlestick while testing multiple key supports simultaneously:
1) Horizontal support (red dotted line)
2) Cut Lower Bollinger Band
3) Tested 50-day SMA
4) Trendline support (green line)
5) Stochastic in oversold zone
6) Takeout stops pattern: wick flushed below prior lows, likely taking out stops before reversing
This strong confluence of signals suggests buyers are defending the level, offering a favorable risk-reward setup.
BTC 1H Analysis - Key Triggers Ahead | Day 30💀 Hey , how's it going ? Come over here — Satoshi got something for you !
⏰ We’re analyzing BTC on the 1-hour timeframe timeframe .
👀 On the 1-hour timeframe of Bitcoin, we can see that after activating our alarm zone, Bitcoin moved toward the top of the channel and then got rejected from this area. There is a resistance in the 1-hour timeframe at the price of $110,450, and by breaking this level Bitcoin can move upward.
⚙️ We have 2 key RSI zones at 38 and 64, and if the fluctuation limit passes these numbers, Bitcoin can experience either a corrective move or the continuation of the bullish leg.
🕯 The size of the green candles has grown and their volume has increased. This happened with the end of August and the beginning of September. With increased buying volume and positive news results in favor of crypto, Bitcoin can make another move upward. News has a very direct impact on our inflows and outflows.
📊 On the 1-hour timeframe of USDT.D , we can see that it is moving inside a box with a top at 4.56% and a bottom at 4.47%. By breaking out from either side of the box, it can bring strong trading volume. Notice that Tether dominance is currently pulling back to the midline of the box. By breaking the midline and stabilizing above this area, Bitcoin may face more selling pressure. By getting rejected from this area and losing the bottom, our long position trigger for Bitcoin can be activated.
🔔 The alarm zones specified for Bitcoin are at $110,450 and $107,800. By observing behavior in these areas we can trade. Personally, with the breakout of $110,450 along with a 15-minute indecision candle, I will try to take a position. Note that Bitcoin can make a pullback to its midline box and then bounce upward. If the midline is lost, this scenario will be invalid.
❤️ Disclaimer : This analysis is purely based on my personal opinion and I only trade if the stated triggers are activated .

AAVE 4H Analysis | Key Triggers Ahead💀 Hey , how's it going ? Come over here — Satoshi got something for you !
⏰ We’re analyzing AAVE on the 4-Hour timeframe timeframe .
👀 On the 4-hour timeframe of AAVE, we can see that after breaking the trendline, its volume increased and it moved toward the $361 resistance, then entered a corrective trend. Currently, this coin is ranging inside a triangle consolidation, and the volume has dropped significantly.
⚙️ The RSI fluctuation of this coin is still below the 50 zone, and two key levels have been considered for its movement: 55.15 and 37.89. If the RSI passes beyond these levels, this coin can experience another movement leg.
🕯 The size and volume of the candles have decreased, with the red candles being bigger and more numerous than the green ones. This could be a sign of the end of selling pressure or the beginning of a new wave of selling pressure. The coin is in a very important area, and with today’s news it may move upward and end this corrective trend.
💰 On the 4-hour timeframe of the trading pair AAVEBTC, after a strong rally against Bitcoin, this coin is now in a triangle consolidation and the volume has dropped. A significant amount of this coin has been sold and converted to Bitcoin (buyer makers of Bitcoin). A ceiling and floor have also been formed as our alarm zones, where price action in these areas can help us make the best decision for this trading pair.
🔔 The alarm zone for this coin is considered at $323 for a long trade and $301 for a short trade. Today, this coin recorded a historic milestone in DeFi, and with the breakout and confirmation of the marked trendline and the activation of triggers, it can experience good growth. 🚀
❤️ Disclaimer : This analysis is purely based on my personal opinion and I only trade if the stated triggers are activated .

PSX: FCCL - Long position - Monthly TFPSX: FCCL All time high projections
Long position in FCCL.
Concerns:
RSI bearish divergence on monthly

ETH 1H Analysis – Key Triggers Ahead | Day 9💀 Hey , how's it going ? Come over here — Satoshi got something for you !
⏰ We’re analyzing ETH on the 1-hour timeframe timeframe .
🔭 On the 1-hour timeframe of Ethereum, we can see that after being rejected from the \$4500 alert zone, Ethereum moved downward and formed short-term support at the \$4371 area. If this level is broken, Ethereum could experience a deeper correction in the multi-timeframe view.
⛏ The key RSI levels are at 58 and 39. Once the oscillator crosses these levels, Ethereum can start its move.
💰 The size and number of Ethereum’s red candles are significantly greater than the green ones, and if this support is lost, Ethereum could move further downward into selling pressure.
🪙 On the 1-hour ETHBTC timeframe, we can see that after activating the short alert zone and receiving confirmation for a sell trade, Ethereum is moving downward. It has support at the 0.03996 level, which coincides with the 30 RSI zone or the OverSell boundary.
🔔 The alert zones considered for Ethereum are the \$4371 area and the \$4500 area. Based on price action in these zones, we can find the best trade opportunities. With further decline of ETH against Bitcoin, reduced volatility, and price leaning toward selling, we may see a deeper correction.
❤️ Disclaimer : This analysis is purely based on my personal opinion and I only trade if the stated triggers are activated .

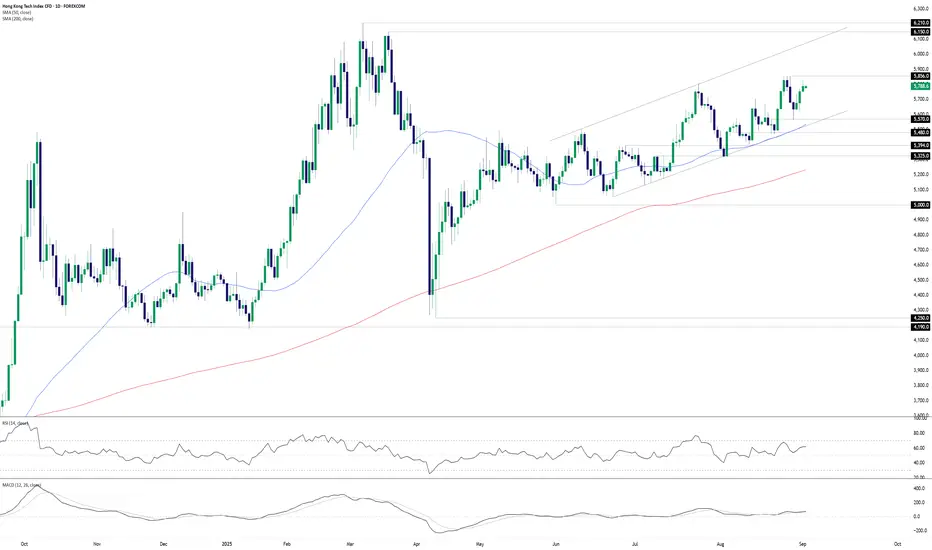
Hang Seng Tech: 5800 proves trickyHang Seng Tech continues to struggle above 5800, reversing lower after another failed probe above the level on Monday, mirroring price action seen earlier this year. While the broader trend is undeniably bullish, without a definitive break and close above 5856, near-term directional risks may be lower.
If we were to see another failed push above 5800 on Tuesday, shorts could be established beneath the level with a stop above 5856 for protection. 5700, 5570 and 50-day moving average screen as potential targets, depending on desired risk-reward from the trade.
As mentioned above, the broader trend for the contract is entirely bullish. The price is in an ascending channel with the 50 and 200-day moving averages pushing higher. RSI (14) and MACD are also generating bullish signals, favouring a similar directional bias.
As such, if the contract were to close above 5856, it would generate a bullish setup where longs could be established on the break with a stop beneath the level, targeting 6000, 6150 or 6210—the latter coinciding with 2025 year-to-date high.
Alternatively, if we were to see a pullback to channel support/50DMA and bounce, longs could be established with a stop beneath the support zone for protection against reversal. 5700, 5800 and 5856 screen as potential targets.
Good luck!
DS