GOLD → Consolidation above 4220. Bullish structureFX:XAUUSD is trading in a narrow range around $4,200, maintaining sideways momentum ahead of US inflation data. The market confirms a bullish structure...
The probability of a Fed rate cut in December remains at ≈90%.
Mixed US employment data:
– Jobless claims fell to their lowest level since September 2022.
– Layoffs in November reached a two-year high.
The key benchmark today is the PCE index for September (data delayed due to the government shutdown).
Gold is awaiting new signals on inflation. Range trading is likely until the release of PCE data, which may set the direction of movement ahead of the Fed's decision.
Resistance levels: 4238, 4262
Support levels: 4220, 4183
If the bulls hold their ground above local support at 4220, we will have a chance to break through 4238 and retest 4262. However, a breakout of the trading range resistance could trigger a continuation of the rally towards the ATH.
Best regards, R. Linda!
Parallel Channel

SILVER (XAGUSD): Consolidation & Trading Plan
Silver keep coiling within a narrow range on a daily.
Depending on the side of its breakout, I expect 2
potential scenarios.
If the market breaks and closes above 59.0 - the resistance
of the range, expect a bullish continuation to 60.0 level.
If the market breaks and closes below 56.2 - the support
of the range, expect a down movement to 54.5
Alternatively, keep trading the market within the range,
buying from the support and selling from the resistance.
❤️Please, support my work with like, thank you!❤️
I am part of Trade Nation's Influencer program and receive a monthly fee for using their TradingView charts in my analysis.

Calm Before the Storm: Bitcoin’s Next Big MoveOverall Structure
Bitcoin is trading inside a large ascending channel, and price is currently sitting near the lower boundary of this channel — a highly critical decision zone for the next major move.
Bullish Scenario (Green Path)
If Bitcoin holds the lower channel support around 88,000–92,000 and buyers step in:
• A rebound toward the midline of the channel around 110,000–115,000 becomes likely.
• A further continuation could target the top of the channel, located in the 130,000–140,000 region.
This scenario remains valid as long as BTC stays above channel support.
Bearish Scenario (Red Path)
If the price breaks below the channel support, especially with a daily close under 88,000:
• Momentum may turn strongly negative.
• First support zone sits near 80,000–82,000
• A deeper extension could bring BTC toward 70,000 or lower, depending on market sentiment.
A breakdown from the channel would officially end this medium-term uptrend.
Suggested Stop-Loss
• Aggressive: below 88,000
• Conservative: below 85,000

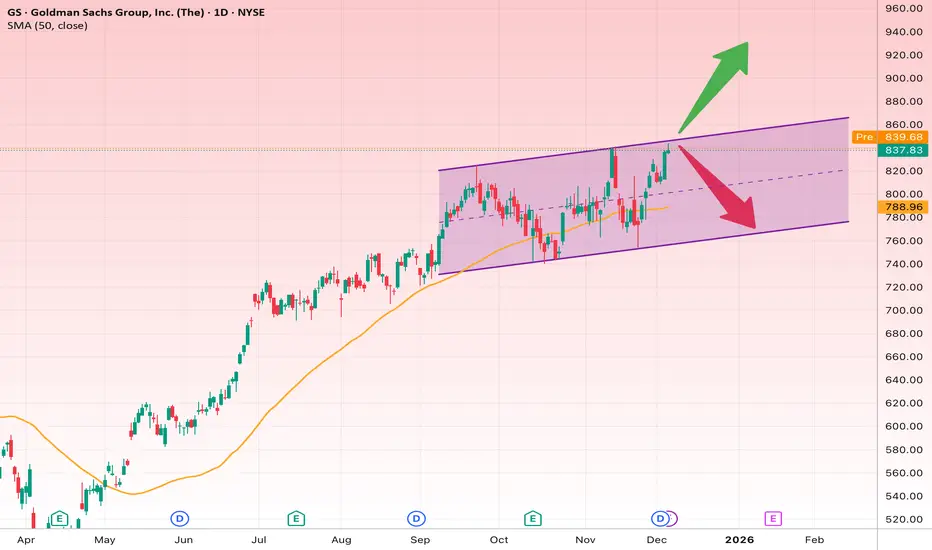
GS at the Edge: Breakout or Pullback?GS is currently moving inside a well-defined ascending channel and has once again reached the upper half of the channel, a key decision zone that will determine the next major move.
• Overall trend: Bullish
• Structure: Ascending channel + dynamic support from the 50-day SMA
• Current status: Testing the upper boundary — potential breakout or pullback zone
Bullish Scenario (more likely if it holds above resistance)
If GS can break and hold above 840, it signals a clean breakout from the channel top and opens the door for a fresh upward rally.
Bullish Targets
• Target 1: 865
• Target 2: 895
• Target 3 (strong breakout): 920
Confirmation
• Daily close above 840
• Rising volume on the breakout
Bearish Scenario (rejection from channel resistance)
If GS fails to break above the channel and gets rejected, a pullback toward the mid-range or bottom of the channel is natural.
Bearish / Correction Targets
• Target 1: 815
• Target 2: 800
• Target 3 (channel bottom): 785
Stop-Loss Levels
Depending on trading style:
• Safer stop-loss for long positions: Below 815
• Aggressive stop-loss: Below 828
(A breakdown below these levels indicates short-term structure failure.)
Quick Fundamental Note
• Recent earnings have shown strong growth, especially in investment banking and asset management.
• Operating expenses are controlled and profit margins improving.
• Market conditions and increased capital markets activity favor GS.
These fundamentals support the bullish technical bias.
BTCUSD: Bullish Pressure Targets the $94,000 Resistance AreaHello everyone, here is my breakdown of the current BTCUSD setup.
Market Analysis
Bitcoin remains in a broader recovery phase after breaking out of the descending wedge structure that previously guided price lower. The initial breakout from the wedge led to a strong bearish continuation, but once BTC reached the major $90,200 Support Zone, selling pressure weakened and buyers stepped in aggressively. This support area has now been defended multiple times, confirming it as a key demand zone. From this base, price formed a clear Upward Channel, signaling a short-term bullish structure with higher lows respected along the channel support.
Currently, BTC attempted to break above the $93,700 Resistance Zone, but this move resulted in a fake breakout, showing that sellers are still active at this level. After the rejection, price pulled back toward the channel support and the $92,000–$90,200 support cluster, where buyers once again defended the market. Currently, BTC is trading back inside the ascending channel and attempting to resume the upward swing toward the upper boundary. The overall structure suggests a recovery trend as long as the price holds above the main support zone.
My Scenario & Strategy
My scenario is bullish, as long as BTC holds above the $90,200 Support Zone and continues to respect the ascending channel structure. I expect price to continue climbing toward the $93,700 Resistance Zone, which remains the key short-term target for buyers. A clean and confirmed breakout above this resistance would open the way for a continuation toward higher levels near the top of the channel.
Therefore, if price reaches the resistance again and produces another strong rejection, we may see a temporary pullback back toward the mid-channel area or even a retest of support. The bullish structure remains valid as long as BTC stays above $90,200. For now, the market supports a long bias with focus on a renewed attempt toward the $93,700 resistance zone.
That's the setup I'm tracking. Thank you for your attention, and always manage your risk.

Gold Bulls Hold Control — Targeting $4,320 ResistanceHello traders! Here’s my technical outlook on XAU/USD (Gold) based on the current market structure shown on the chart. After a strong bullish impulse earlier in the period, Gold formed a distribution Range below the main Resistance Level, where multiple upside attempts were rejected and the price eventually turned around from the upper range boundary. This rejection initiated a corrective decline that respected the descending Resistance Line, while buyers gradually began to defend the Support Line, leading to a compression structure that later transitioned into a reversal phase. Following this consolidation, Gold successfully broke above both the internal range and the descending resistance, confirming a shift in market structure. Price then entered a well-defined ascending channel, forming higher highs and higher lows along the rising Support Line. Several clean breakouts inside the channel confirm sustained bullish momentum, with buyers clearly in control as long as the channel structure remains intact. Currently, price is consolidating just above the $4,160–$4,140 support zone, holding above former breakout levels and respecting the lower boundary of the ascending channel. This behavior suggests a healthy bullish pullback rather than trend exhaustion. As long as Gold remains above this support area and holds inside the channel, the bullish scenario remains valid. My expectation is for a continuation move toward the upper boundary of the channel, with the main upside target at TP1 around $4,320, where the previous resistance and projected channel resistance converge. A clean breakout above this level would open the door for further bullish expansion. However, a sustained break below the $4,140 support or a drop out of the channel would weaken the bullish structure and could trigger a deeper corrective move. Please share this idea with your friends and click Boost 🚀

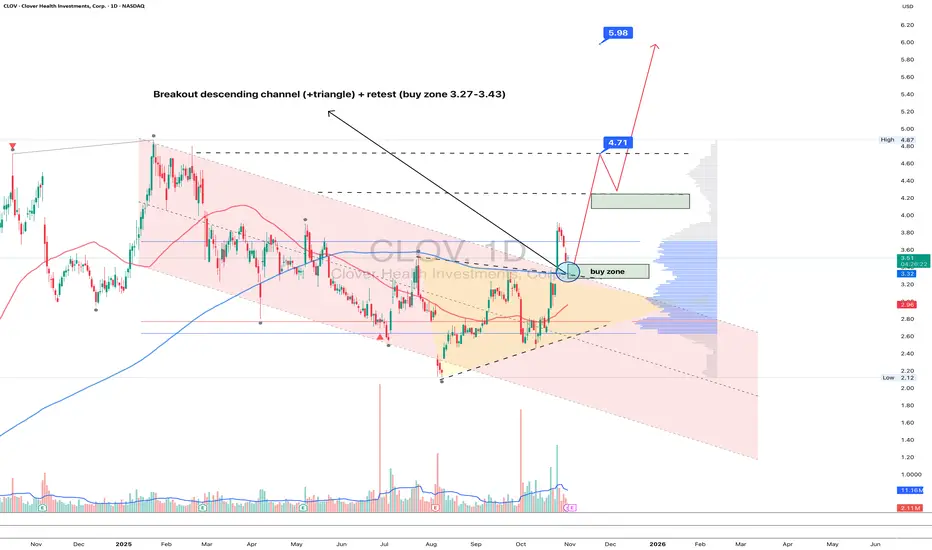
CLOV 1D - Health Is Back in TrendOn the daily chart, Clover Health (CLOV) has broken out of its descending channel and triangle, now pulling back for a retest near 3.27–3.43 - a key buy zone aligned with the MA50. Buyers are clearly regaining control, and the setup looks ready for continuation.
Technically:
– first clean breakout of the downtrend since January 2025;
– volume expansion on bullish candles, suggesting institutional accumulation;
– holding above the former resistance turned support.
Upside targets: $4.71 (local volume peak) and $5.98, offering +70% potential upside if momentum sustains.
From a fundamental perspective, Clover Health is stabilizing its business:
– a leading player in Medicare Advantage, with an expanding senior member base;
– Q3 results show 40% reduction in net loss and +18% YoY revenue growth;
– leveraging AI-driven healthcare analytics to improve efficiency and patient outcomes;
– with high short interest, a confirmed breakout above $4.70 could ignite a short squeeze.
Tactical plan: accumulation near 3.27–3.43, add above 4.70, targets 4.71 → 5.98. Sometimes the healthiest trend is the bullish one.
GOLD → Retest of consolidation support on uptrend FX:XAUUSD is trading in a sideways range around $4,200, awaiting new labor market data to determine the Fed's policy trajectory after December's rate cut.
Weak US data (a 32K decline in ADP employment and a slight increase in ISM services to 52.6) did not change market expectations. The probability of a 25 bp Fed rate cut on December 11 is around 90%. Attention has shifted to the trajectory of policy easing in early 2026. Key factors will be data on unemployment claims and sentiment on Wall Street.
The fundamental background is relatively positive, and the dollar has entered a correction phase due to expectations of lower rates, which may support the gold price...
Resistance levels: 4238, 4262
Support levels: 4185, 4175
Gold is testing the support levels of the key trading range. If the bulls keep the price above 4185 and form a bullish reversal pattern, then in the short and medium term, we can expect growth to intermediate highs.
Best regards, R. Linda!

ETHEREUM → The emergence of a positive driver?BINANCE:ETHUSDT is soaring amid a news rally and testing resistance at 3230. The daily increase was almost 20%. If growth is expected, then after a slight correction...
Fundamental background: the market reacted to rumors of the replacement of the Fed chairman with Kevin Hassett, who is more “dovish” and loyal to cryptocurrencies. The market broke the local structure and updated the interim maximum from 3070 to 3230. A false breakout of resistance is forming relative to the key resistance level, and the market is entering a correction/stagnation phase.
Bitcoin, the main driver of the cryptocurrency market, faced strong resistance at 95K. The global market trend is downward, and a change in trend will require time and more confirmation...
There is a struggle for resistance in the market, and several scenarios are possible: consolidation and a breakout of resistance, or growth after correction...
Resistance levels: 3230, 3370
Support levels: 3172 (local), 3057
High probability: a false breakout of 3230 will trigger a correction to 3050 (before the news). If the bulls keep the price above 3050, growth may continue as part of the change in the fundamental background.
BUT! If buyers keep the price without correction, then the focus will be on 3230. Consolidation above this level could trigger growth to 3370 - 3620.
Best regards, R. Linda!

USDCHF - Bearish ChannelFX:USDCHF has been trading in a bearish channel since starting its bearish trend.
Currently, price is retesting the bearish channel resistance, and I am looking for a short here! Expecting price to continue its bearish trend and respect the bearish channel!


Bitcoin 4H Update: Party's over... for now!Looks like BTC tried to break the top of its current channel (around $93.5k) but got firmly rejected by the :bear:
So, here’s the deal: Bitcoin needs to find its dancing shoes and make a big bounce from the immediate support line, which is hanging out around $92k. Let’s hope volume join the party.
If it can’t hold it, the next safety net is way down at the mid-range support around $89k

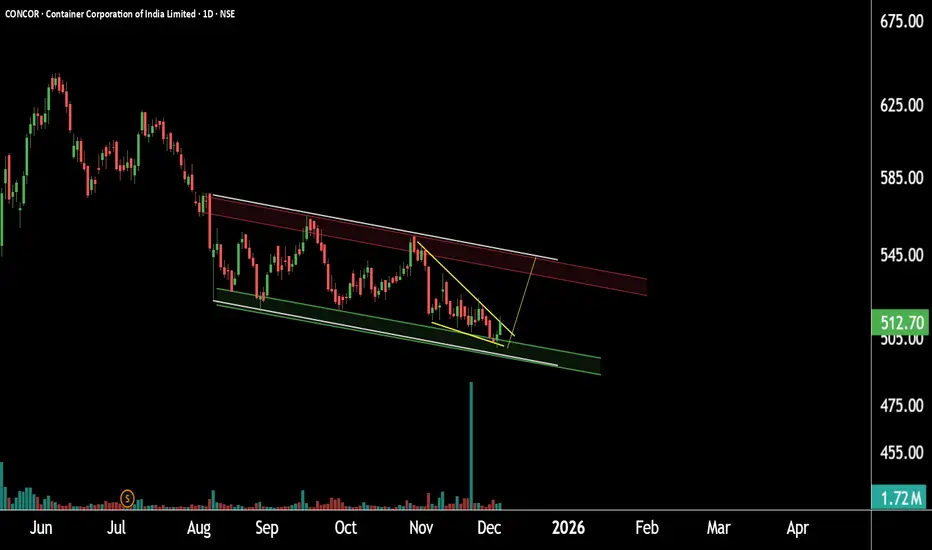
Concor Ready for Support Reversal ?This is the daily timeframe chart of Concor.
The stock is trading within a falling channel pattern, with a strong support zone around 490–510.
On the shorter timeframe, the structure is forming a falling wedge near the 500–510 area. If this support zone holds,
the stock may witness a potential upside toward 540.
Thank you.
GBPUSD - Bears Loading at a Major Confluence???⚔️GBPUSD is approaching a powerful intersection where the upper blue trendline meets the green supply zone. This area has acted as a strong barrier before, and price is now retesting it from below.
📉If this confluence holds, the bearish pressure is likely to kick back in. As long as the rejection is confirmed, we will be looking for trend-following shorts, with the next objective being the lower bound of the rising channel, where buyers may attempt to step in again.
A very clean and technical setup, now we wait for confirmation. 📉🔥
What do you think, will the supply zone hold, or will GBPUSD break higher this time? 👀
⚠️ Disclaimer: This is not financial advice. Always do your own research and manage risk properly.
📚 Stick to your trading plan regarding entries, risk, and management.
Good luck! 🍀
All Strategies Are Good; If Managed Properly!
~Richard Nasr

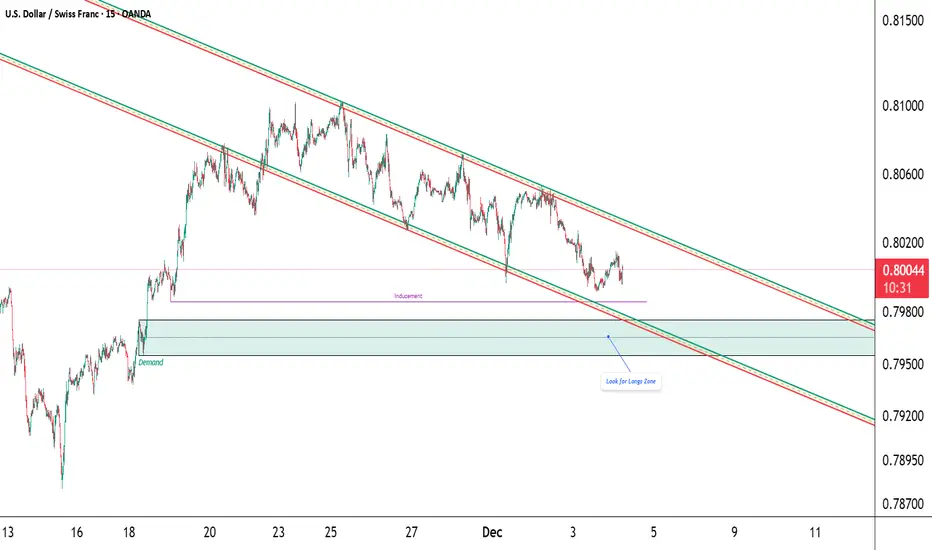
USD/CHF – Watching for liquidity sweep into origin demandPrice is trading inside a clean descending channel.
Below current price sits untouched inducement — a liquidity pool that lines up perfectly with the origin demand zone where the previous impulsive rally started.
If price sweeps that inducement and taps the demand zone, I’ll look for confirmation (MSS + FVG/OB) for a potential move back toward the channel midline or upper boundary.
Bias: Bullish upon sweep + tap
Invalidation: Clean break below demand
Confluence: Channel low + origin demand + resting liquidity
Not financial advice.
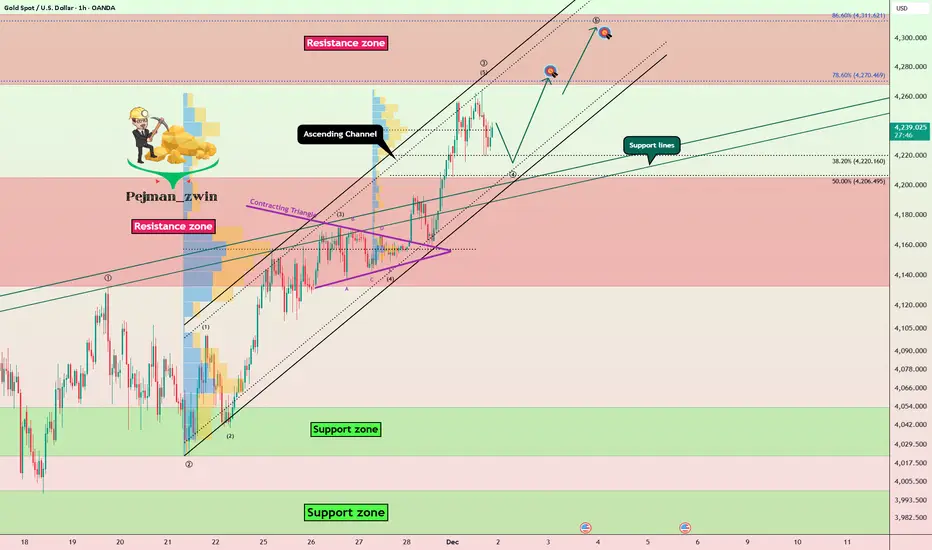
Gold Breakout + Wave Structure = New Targets LoadingGold( OANDA:XAUUSD ) has successfully broken through the Resistance zone($4,205 – $4,133) at the start of this new week, and over the past ten trading days, it seems to have formed an ascending channel.
From an Elliott Wave perspective, it looks like gold has completed wave 3 and is currently in the process of completing wave 4.
I expect that after a pullback toward the Resistance zone($4,205 – $4,133)—aligning with the lower line of the ascending channel and the support lines—gold will resume its upward movement and once again target the Resistance zone($4,316 – $4,261).
First Target: $4,266
Second Target: $4,294
Stop Loss(SL): $4,151
Note: Geopolitical tensions—especially the possibility of a direct confrontation between Venezuela and the U.S.—tend to push investors toward safe-haven assets, and gold historically reacts with strong upward momentum during such uncertainty. If this conflict escalates, increased risk aversion and volatility across global markets could support a bullish continuation in gold as capital shifts away from risk assets
💡 Please respect each other's opinions and express agreement or disagreement politely.
📌 Gold Analyze (XAUUSD), 1-hour time frame.
🛑 Always set a Stop Loss(SL) for every position you open.
✅ This is just my idea; I’d love to see your thoughts too!
🔥 If you find it helpful, please BOOST this post and share it with your friends.
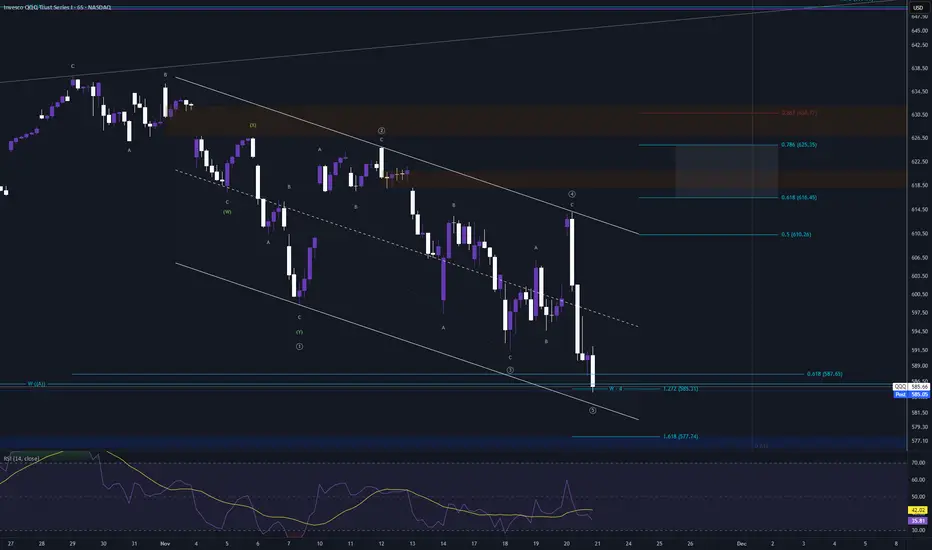
QQQ ATH in for awhileIn a related posted, looked at ATH on Oct 29th. That has held so far. Now looking at the next phase. It looks like we have a 3-3-3-3-3 leading diagonal.
I'm looking for a pop anywhere from 610 to 625, maybe get the first bear gap, maybe both? It depends on how the first pullback My assumption is 616 at least, gives bulls a breakout, potential retest, then drop from there. Possibly test the bear gap at 626.
Marking this as a short for beginning of Dec after.
How the next couple weeks go!
USDCAD higher bearish from here expected
USDCAD trend based analysis, we are have break of RECTANGLE, in last days we can see domination of CAD and price is come here again in RECTANGLE and price also is in DESCENDING CHANNEL,
from here expecting higher bearish trend.
SUP zone: 1.40500
RES zone: 1.39500, 1.39000

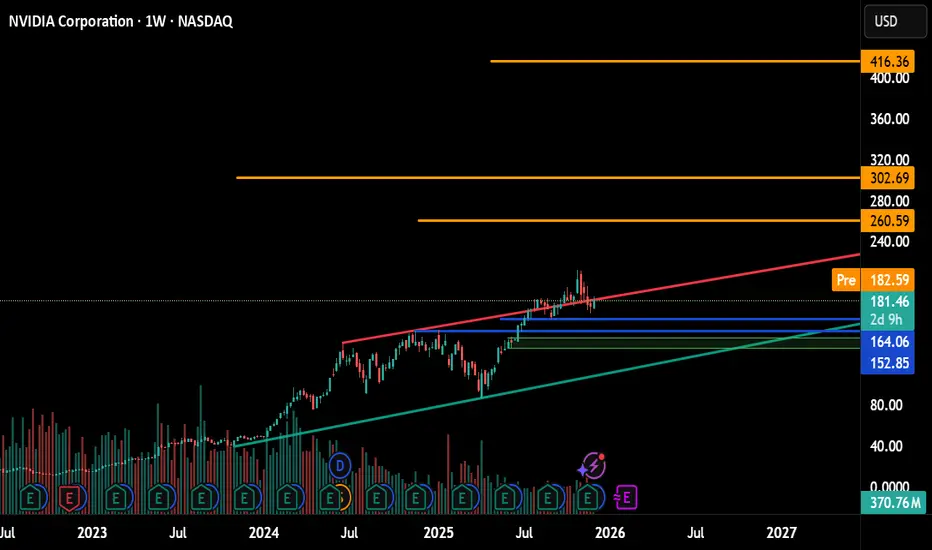
NVDA : Blue-chip and Strong potential for alpha returnsCMP : 181.46
Investment pick.. Long term.
Adding : if decline : 164-152 levels...
and 130 Stop Loss of course because we can not hold if it will give us negative long term price structure..
Manage your Risk..
Target : 260, 302, 416 + then review.
Logic : Rising channel and correction .. we are eyeing in it.
EURUSD: Rejection Signals Move Toward 1.15500 SupportHello everyone, here is my breakdown of the current EURUSD setup.
Market Analysis
EURUSD continues to trade inside a broader downward channel, where bearish structure remains dominant. After reaching the Resistance Zone around 1.16500, the pair formed another rejection near the descending trendline, confirming strong seller pressure and completing yet another fake breakout inside this key supply area. From there, price reversed sharply and moved back below the structure, respecting the market’s overall bearish sentiment.
Currently, EURUSD is pulling back from resistance and heading toward the Support Zone near 1.15500, which has previously acted as a significant reaction area. This zone also aligns with multiple breakout points seen earlier, making it an important liquidity region where buyers have stepped in before. Despite temporary bullish corrections, the pair remains capped under the channel resistance, keeping the downtrend intact.
My Scenario & Strategy
My scenario as long as the market stays below the descending channel’s resistance and under the 1.16500 zone, my bias remains bearish. The price is likely to continue moving toward the 1.15500 Support Zone, where the next significant reaction may occur. A clean retest of this level could initiate either a short-term corrective bounce or a continuation of the bearish trend, depending on the strength of incoming momentum.
Therefore, if the pair breaks below 1.15500, this would open the door for deeper downside movement within the channel, extending toward lower supports. However, if buyers defend this zone strongly, we may see a temporary upward correction — but any upside remains limited unless EURUSD breaks above the Resistance Zone with confirmation. For now, I expect a move toward support as sellers remain in control of market structure.
That's the setup I'm tracking. Thank you for your attention, and always manage your risk.

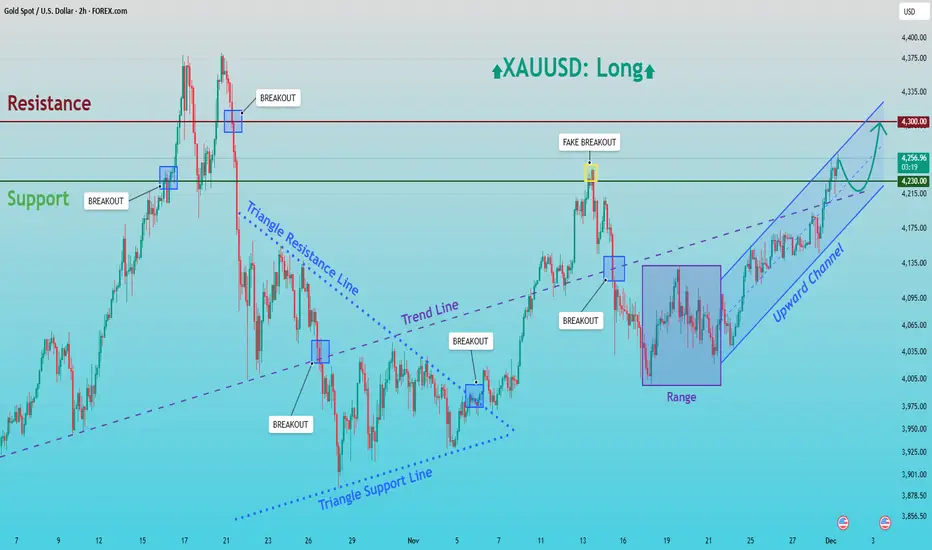
XAUUSD: Buyers Eye Retest of the $4,300 Resistance ZoneHello everyone, here is my breakdown of the current XAUUSD setup.
Market Analysis
Gold continues to trade within a well-structured bullish environment following a strong recovery from the lower Triangle Support Line earlier in the month. After a prolonged corrective phase inside a symmetrical triangle, price eventually broke above the Triangle Resistance Line, shifting the market structure from consolidation into bullish continuation. This breakout created a clear trend shift, supported by a steady sequence of higher highs and higher lows. After the breakout, XAUUSD entered a temporary Range phase, suggesting accumulation from buyers before the next impulsive move. Once price broke out of that range to the upside, the market formed a clean Upward Channel, showing sustained bullish pressure. A notable fake breakout above the Resistance Zone around 4,260 occurred recently, indicating strong seller activity at the top of the zone, but buyers quickly regained control and continued to push price upward within the channel.
Currently, gold is trading near the mid-upper area of the Upward Channel, approaching the 4,300 key Resistance Zone. The broader technical picture shows clear bullish market structure, with trendline support and channel dynamics favoring further upside as long as the channel remains intact.
My Scenario & Strategy
My scenario is bullish, supported by the strong rebound within the Upward Channel and the consistent higher-low structure. As long as price remains above the 4,215–4,230 Support Zone and respects the channel’s lower boundary, buyers hold a clear advantage. My expectation is that XAUUSD may make a minor pullback toward the mid-channel zone near 4,230 to gather liquidity before continuing the upward movement.
Therefore, the primary bullish target remains the 4,300 Resistance Zone, where a retest is highly probable. A clean breakout above 4,300 would open the door for a stronger rally and signal continuation of the broader bullish cycle. However, if gold fails to break the resistance and forms a deeper correction, the Upward Channel support and the prior breakout zone at 4,215 will be key levels to watch. The bullish bias remains valid as long as these supports hold. For now, the structure favors a long scenario with attention on the move toward 4,300 and potential bullish continuation beyond that level.
That's the setup I'm tracking. Thank you for your attention, and always manage your risk.
GOLD → The battle for zone 4200. Bullish trend FX:XAUUSD is forming a local trading range of 4180-4230, trying to stay above 4200 after yesterday's correction ahead of important US employment and services data.
The dollar is weakening amid expectations of a Fed rate cut on December 11. News concerning Powell, namely Fed chair candidate Kevin Hassett (a well-known “dove”), is supporting gold. Geopolitical risks (stagnation in Russia-Ukraine negotiations) are increasing demand for safe-haven assets.
• In focus today: ADP employment data and ISM Services PMI.
• Weak indicators will strengthen bets on Fed policy easing and support gold.
Gold retains its upside potential. The release of US data could either accelerate growth to $4300 or trigger a correction in the event of strong indicators.
Resistance levels: 4230, 4260
Support levels: 4185, 4175
Gold is testing 4200 for strong support. Local trading range 4180 - 4230. A false breakout of support amid a bullish trend and a weak dollar could support gold's growth.
Best regards, R. Linda!

BTCUSD Short-Term Setup: Buyers Defend Support, TP1 at $89,200Hello traders! Here’s my technical outlook on BTC/USD based on the current market structure. After reaching the Seller Zone near $92,000, the price once again faced strong rejection, forming a clear reversal right under the descending Trend Line. This confirms that sellers continue to defend this area and keep Bitcoin within a broader corrective structure. From there, BTC pulled back toward the Buyer Zone around $86,000–$85,500, which has acted as a reliable support multiple times in the recent sessions. The market is now forming a potential short-term recovery after a fake breakout below this zone, highlighting attempts from buyers to regain control. However, as long as the price trades below the Seller Zone and the descending Trend Line, bearish pressure still dominates the chart. The structure suggests that Bitcoin may attempt a move toward TP1 at $89,200, where the market previously consolidated and faced resistance. A clean rejection from the Trend Line could send the price back toward support for another test, while a confirmed breakout above $92,000 would shift short-term sentiment and open the way for stronger bullish continuation. On the other hand, a breakdown below $85,500 could expose BTC to deeper declines toward lower support lines. Please share this idea with your friends and click Boost 🚀
