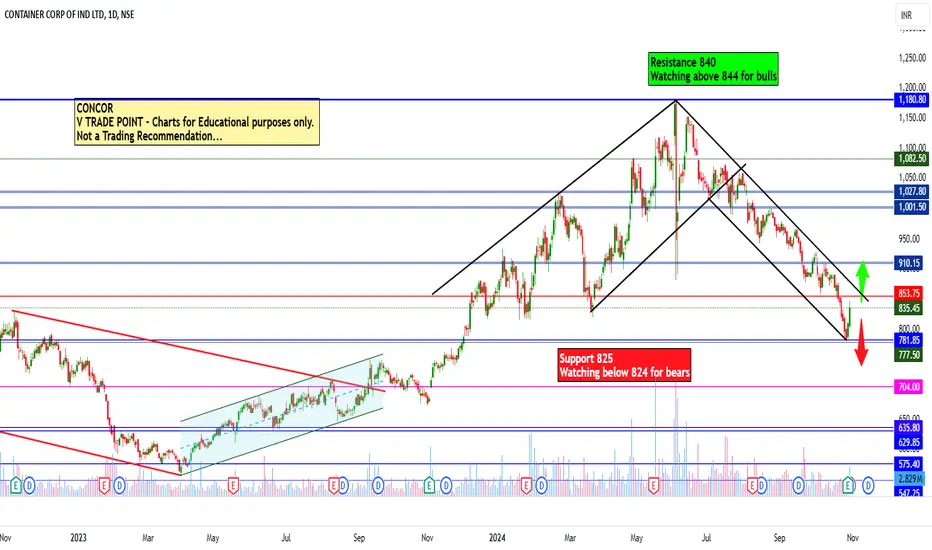
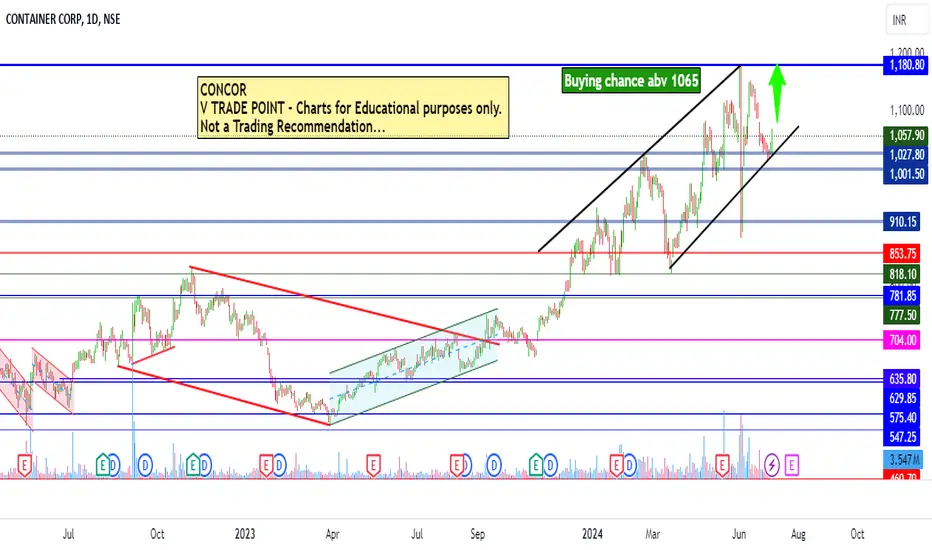
CONCOR (D) CHARTTechnical Note: Let the market come to your zones and show its hand. Trade safely and manage your risk! Always wait for your own confirmations before entering the market.
Risk Disclaimer: This analysis is for educational purposes only and does not constitute financial advice. Always practice proper
Container Corporation of India Limited
No trades
No trades
Compare with Container Corporation of India Limited
16.35 INR
12.42 B INR
90.79 B INR
344.26 M
Next report date
—
Report period
—
EPS estimate
—
Revenue estimate
—
Company info
Sector
Industry
CEO
Ajit Kumar Panda
Website
Headquarters
New Delhi
Founded
1988
IPO date
Nov 20, 1998
ISIN
INE111A01025
FIGI
BBG000DC6JX4
Identifiers
ISIN INE111A01025
Container Corp. of India Ltd. is a logistics company, which engages in handling, transportation, and warehousing activities. Its facilities and services include air cargo movements, bonded warehousing, reefer and cold chain services, domestic policy, and terminal handling charges. The firm operates through EXIM and Domestic segments. The company was founded on March 10, 1988 and is headquartered in New Delhi, India.
Concor swing trade for 10% target7/27:
1. Divergence seen between Price and
Mansfield RS on weekly chart, post which the
Price seemed to have reversed.
2. Price crossed above 30 WMA
3. 30 WMA was flattening on weekly chart
4. RS on weekly chart had moved above 0
5. SL is set below the previous Green candle on weekly
6. NK chart g
CONCOR Approaching Demand Zone | Risk-Reward Turning FavorableCONCOR | Daily Timeframe Analysis
The stock is currently following a similar percentage-based correction pattern and is approaching a strong support zone around ₹430–₹425.
Price action indicates that this area could act as a key demand zone, providing a favorable risk-reward setup for traders and
CONCOR – Strong Support Zone IdentifiedCONCOR – Daily Timeframe Analysis
This is the daily timeframe chart of CONCOR. The stock is currently trading near a strong support zone around 400–420, based on the Fibonacci retracement levels.
The price is also moving within a falling channel, with additional support seen near the 400–410 area.
CONCOR showing Bullish Harmonic Gartley Pattern Type: Bearish Gartley
Date: 10 Feb 2026
Volume: 1.54M
📐 Pattern Geometry & Ratios
AB retracement = 0.382 of XA → Valid Gartley setup
BC retracement = 0.571–0.641 → Within acceptable range
CD extension = 0.777–1.374 → Matches bearish Gartley rules
PRZ (Potential Reversal Zone) projected nea
CONCOR- Probable price projection-A swing Opportunity
Chart is analysed in two time frames
1. Weekly
2. Daily
Tools and Indicators Used
1. Pivot
2. Trend lines and channel patterns
In weekly time frame it is clear that the price has broken the channel . since the price is below the pivot and breakout is not so strong . however it l
See all ideas
Summarizing what the indicators are suggesting.
Neutral
SellBuy
Strong sellStrong buy
Strong sellSellNeutralBuyStrong buy
Neutral
SellBuy
Strong sellStrong buy
Strong sellSellNeutralBuyStrong buy
Neutral
SellBuy
Strong sellStrong buy
Strong sellSellNeutralBuyStrong buy
An aggregate view of professional's ratings.
Neutral
SellBuy
Strong sellStrong buy
Strong sellSellNeutralBuyStrong buy
Neutral
SellBuy
Strong sellStrong buy
Strong sellSellNeutralBuyStrong buy
Neutral
SellBuy
Strong sellStrong buy
Strong sellSellNeutralBuyStrong buy
Displays a symbol's price movements over previous years to identify recurring trends.
Frequently asked questions
The current price of CONCOR is 518.25 INR — it has decreased by −0.69% in the past 24 hours. Watch Container Corporation of India Limited stock price performance more closely on the chart.
Depending on the exchange, the stock ticker may vary. For instance, on NSE exchange Container Corporation of India Limited stocks are traded under the ticker CONCOR.
CONCOR stock has risen by 3.79% compared to the previous week, the month change is a 5.87% rise, over the last year Container Corporation of India Limited has showed a −3.16% decrease.
We've gathered analysts' opinions on Container Corporation of India Limited future price: according to them, CONCOR price has a max estimate of 705.00 INR and a min estimate of 470.00 INR. Watch CONCOR chart and read a more detailed Container Corporation of India Limited stock forecast: see what analysts think of Container Corporation of India Limited and suggest that you do with its stocks.
CONCOR reached its all-time high on Jun 4, 2024 with the price of 944.00 INR, and its all-time low was 10.25 INR and was reached on Sep 17, 2001. View more price dynamics on CONCOR chart.
See other stocks reaching their highest and lowest prices.
CONCOR stock is 1.41% volatile and has beta coefficient of 1.49. Track Container Corporation of India Limited stock price on the chart and check out the list of the most volatile stocks — is Container Corporation of India Limited there?
Today Container Corporation of India Limited has the market capitalization of 399.01 B, it has increased by 8.52% over the last week.
Yes, you can track Container Corporation of India Limited financials in yearly and quarterly reports right on TradingView.
Container Corporation of India Limited is going to release the next earnings report on Nov 5, 2026. Keep track of upcoming events with our Earnings Calendar.
CONCOR earnings for the last quarter are 3.60 INR per share, whereas the estimation was 3.40 INR resulting in a 5.88% surprise. The estimated earnings for the next quarter are 5.10 INR per share. See more details about Container Corporation of India Limited earnings.
Container Corporation of India Limited revenue for the last quarter amounts to 21.54 B INR, despite the estimated figure of 21.97 B INR. In the next quarter, revenue is expected to reach 24.30 B INR.
CONCOR net income for the last quarter is 2.67 B INR, while the quarter before that showed 2.63 B INR of net income which accounts for 0.00% change. Track more Container Corporation of India Limited financial stats to get the full picture.
Container Corporation of India Limited dividend yield was 1.79% in 2025, and payout ratio reached 46.61%. The year before the numbers were 2.10% and 68.55% correspondingly. See high-dividend stocks and find more opportunities for your portfolio.
EBITDA measures a company's operating performance, its growth signifies an improvement in the efficiency of a company. Container Corporation of India Limited EBITDA is 19.62 B INR, and current EBITDA margin is 21.48%. See more stats in Container Corporation of India Limited financial statements.
Like other stocks, CONCOR shares are traded on stock exchanges, e.g. Nasdaq, Nyse, Euronext, and the easiest way to buy them is through an online stock broker. To do this, you need to open an account and follow a broker's procedures, then start trading. You can trade Container Corporation of India Limited stock right from TradingView charts — choose your broker and connect to your account.
Investing in stocks requires a comprehensive research: you should carefully study all the available data, e.g. company's financials, related news, and its technical analysis. So Container Corporation of India Limited technincal analysis shows the buy rating today, and its 1 week rating is buy. Since market conditions are prone to changes, it's worth looking a bit further into the future — according to the 1 month rating Container Corporation of India Limited stock shows the neutral signal. See more of Container Corporation of India Limited technicals for a more comprehensive analysis.