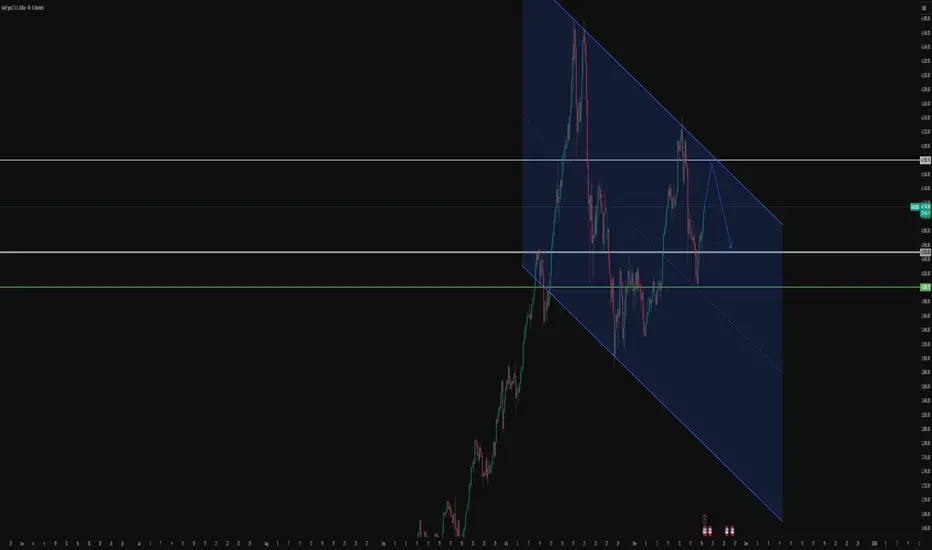
XRP at a Make-or-Break Moment: Rebound Ahead or Major Breakdown?XRP has now reached the lower boundary of its long-term ascending channel, a level that has historically triggered either strong bullish reversals or major breakdowns.
This area represents the true decision point between continuation of the uptrend or a potentially deep correction.
Technical Overview
Structure
• Price has been moving inside a broad ascending channel for more than a year.
• It is currently testing the channel support.
• The 50-day SMA is above the price → bearish pressure still present.
Bullish Scenario (if the channel support holds)
If XRP stabilizes above 1.90–1.95:
Targets:
• Target 1: $2.43
• Target 2: $2.85
• Target 3: $3.20
• Major Target: Channel top near $4.00
Conditions for confirmation:
✔ Holding the lower channel line
✔ Reclaiming the 50-day SMA
Bearish Scenario (if the channel support breaks)
A daily close below $1.85 would confirm a breakdown.
Targets:
• Target 1: $1.60
• Target 2: $1.28
• Final Target: $1.00 or lower
This scenario becomes active if the channel fails.
Suggested Stop-Loss
For long positions: $1.85
For short positions (after breakdown confirmation): $2.05
Parallel Channel

BTCUSDT DAILY ANALYSIS📌 1. Main Condition of BTCUSD Daily
From the chart, it is clear that:
➤ BTC is currently in a strong corrective phase (strong downtrend).
The daily resistance trendline (red) is very dominant.
The weekly support trendline (purple) has already broken → a clear signal of structural weakness.
Price is now sitting right inside the Demand OB + High Volume Support zone (green area).
This is a logical zone for a buy reaction or relief bounce.
📌 2. Current Price Action
➤ Yesterday’s volume was extremely high.
High volume occurring as price hits a demand zone typically indicates one of two possibilities:
Seller absorption by large buyers → potential reversal/bounce.
Capitulation → final sell-off before sideways or reversal.
Based on the candlestick:
Yesterday’s candle shows a long lower wick, indicating buyers reacted strongly to demand.
But the candle closed red → buyers are not fully in control yet.
So, there is a reaction — but not yet a valid signal for a mid-term reversal.
📌 3. Should You Wait for a Bullish Engulfing?
I recommend:
✅ Yes — wait for a Bullish Engulfing or Strong Reversal Candle.
Because:
Market structure is still bearish (lower low – lower high).
A bullish engulfing inside a demand zone confirms buyers have taken over.
Volume is present → we only need a confirmation candle.
Bullish engulfing inside demand + strong volume = high-probability entry.
📌 4. Will BTC Consolidate?
After such a sharp decline, BTC often:
➤ Consolidates inside the demand zone before deciding the next direction.
This is supported by:
Long lower wick
Extreme volume spike
Price already far from the resistance trendline
Price sitting in major demand OB
Most likely scenario:
BTC will enter a ranging / sideways phase for a few days before breaking up or down.
📌 5. Key Levels
Major Support
$82,000 – $78,000 = demand + high-volume node
If this breaks → next target $73,500, or even $68,000 (long green trendline below).
Closest Resistance
$90,000 – $92,000 = supply retest + broken structure
If price breaks above → potential move toward $96,000.

BTCUSD Short: Descending Channel Targets $89,000 Demand ZoneHello traders! BTCUSD continues to trade within a clear descending channel, maintaining a strong bearish structure characterized by consecutive lower highs and lower lows. The price action repeatedly respected the channel boundaries, confirming solid seller control throughout the recent decline. Each time Bitcoin reached the upper boundary of the channel, it formed a pivot point, initiating another downward wave. Before the latest drop, BTCUSD spent some time moving sideways inside a Range Zone, showing temporary accumulation before sellers regained dominance. The bearish continuation led to another pivot formation near the channel’s resistance, triggering a fresh leg to the downside.
Currently, price has now approached the $89,000 Demand Zone, which aligns with the lower boundary of the descending channel. This level has acted as a significant reaction point, generating short-term bounces in previous price swings. The current positioning suggests that buyers may once again attempt to defend this zone. While below the $96,000 Supply Zone and the channel resistance, the broader trend remains bearish. BTCUSD is likely to experience a short-term corrective rebound from the demand area, aiming toward the $92,000–$93,500 region — a previous reaction cluster and local resistance.
My scenario is targeting the $89,000 level. However, if Bitcoin breaks below the $89,000 Demand Zone, it may trigger a deeper bearish continuation toward the lower liquidity areas around $88,000 or even lower. A confirmed breakout above $96,000 would be required to invalidate the bearish structure and signal a potential shift in momentum. For now, BTCUSD remains bearish, with a potential short-term correction from demand before further direction becomes clearer. Manage your risk!

BTCUSD: Bearish Momentum Aiming for New LowsHello everyone, here is my breakdown of the current Bitcoin setup.
Market Analysis
BTCUSD continues to follow a strong bearish market structure, consistently moving inside a well-defined Downward Channel. The chart clearly shows that after a prolonged consolidation phase inside the large Range, Bitcoin attempted both a fake breakout to the downside and a bullish breakout above the upper boundary — but neither attempt resulted in a sustained trend shift. This indicates that buyers lacked the strength to reverse the broader trend. Once price broke down from the range, BTCUSD established a clean sequence of lower highs and lower lows, forming two consecutive downward channels. Each retest of the channel’s upper boundary resulted in a strong bearish rejection, confirming heavy selling pressure at every corrective move upward.
Currently, the recent breakout below the minor support line inside the second downward channel once again demonstrates that sellers remain fully in control. Price is currently trading just above the major Support Zone around $90,400–$91,000, which has acted as a short-term demand area. However, the repeated bearish impulses and weak buyer reactions suggest decreasing bullish interest at these levels. BTCUSD is now hovering around support but forming a continuation pattern that leans toward further decline. Failure to break above the $96,000 Resistance Zone, aligned with previous structure and the former trendline, reinforces the bearish outlook.
My Scenario & Strategy
I expect that Bitcoin will likely attempt a minor corrective push to retest the broken support or the lower boundary of the channel — but any such move is expected to be short-lived unless strong buying pressure appears. After this corrective phase, BTCUSD may continue its decline toward the lower part of the channel and deeper support areas.
A confirmed breakdown below the current Support Zone ($90,400–$91,000) would strengthen the bearish scenario and open the path toward the next downside targets. Only a strong breakout above $96,000 — with clear bullish confirmation — would weaken the bearish bias and signal that buyers are stepping back into the market. For now, short positions remain more favorable, especially after corrective pullbacks into resistance zones within the downward channel structure.
That's the setup I'm tracking. Thank you for your attention, and always manage your risk.

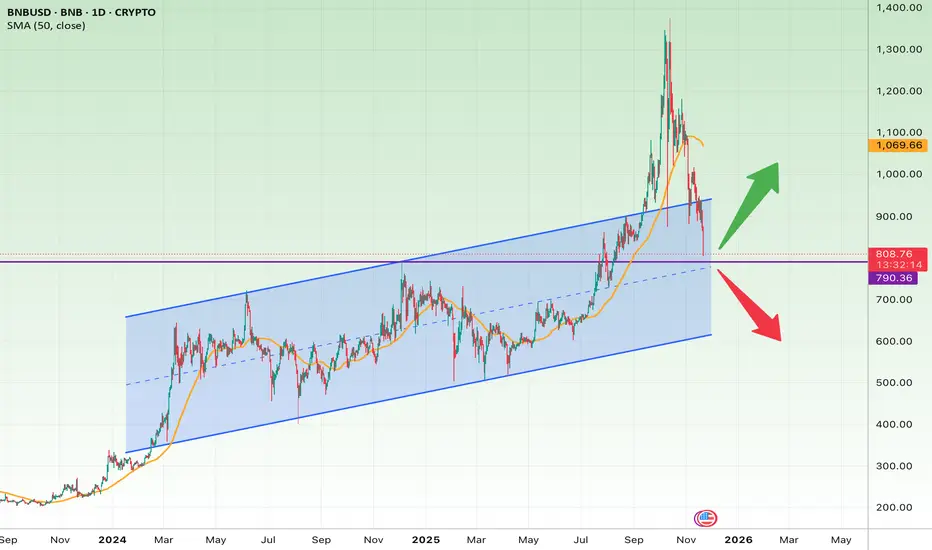
BNB at Reversal Incoming or Start of a Deep Correction?BNB has pulled back sharply from its parabolic run above $1,300, and price is now sitting exactly on the bottom boundary of the rising channel that has guided the trend since late 2023.
This area is extremely important because:
• It is the channel support
• It aligns with a previous consolidation zone
• It’s very close to the 50-day SMA retest zone (which BNB often respects)
If this support holds, BNB could stage a recovery rally. But if it breaks down, the chart opens the door to a much deeper correction.
Bullish Scenario (If channel support holds)
Entry Zone: $780–$820
(BNB is currently inside this zone)
Target 1: $987
– This is the next major resistance and midpoint of the previous structure.
Target 2: $1,070–$1,100
– Retest of the recent breakdown area and 50-day SMA region.
Target 3 (extended): $1,250+
– Only if momentum continues and BTC supports the market.
Bearish Scenario (If price loses the channel)
A breakdown from the channel plus a daily close below $790 would confirm weakness.
Downside Targets:
• $700 — First Fibonacci + structural support
• $620 — Major support zone from 2024
• $500–$520 — Full channel breakdown target
Stop-Loss Suggestion
• Stop-loss (swing trade): $760
– A daily close below this level means the channel is broken.
• Tighter stop-loss (short-term): $780
Summary
BNB is sitting on a critical support level.
Hold → strong bounce potential.
Break → deep correction likely.
ETH at the Edge! Massive Move ComingBased on your chart, Ethereum is currently sitting right on the lower boundary of the rising blue channel, which is a major decision zone for the next trend.
Bullish Scenario
If ETH holds the lower blue trendline (around $2,400–$2,500):
Bullish Targets
1. $3,200 — mid-channel resistance
2. $3,760 — major structural resistance
3. $4,800 — historical peak & cup-and-handle breakout level
4. $5,500–$6,000 — full bullish channel extension
Confirmation for upside
• Strong reversal candle on the lower channel
• Break & close above the 50-day SMA
Bearish Scenario
If ETH breaks below the lower channel (~$2,400):
Bearish Targets
1. $2,000 — psychological support
2. $1,550 — major previous swing low
3. $1,000–$1,200 — full downside breakdown target
Stop-Loss Recommendation
(To protect against a channel breakdown)
Stop-Loss:
Below $2,350
This is slightly under the lower trendline — if broken, the bullish structure fails.
Trading Plan Summary
• Entry zone: $2,450–$2,600 (channel support region)
• Stop-loss: $2,350
• Take Profit (TP):
• TP1: $3,200
• TP2: $3,760
• TP3: $4,800
• TP4: $5,500–$6,000

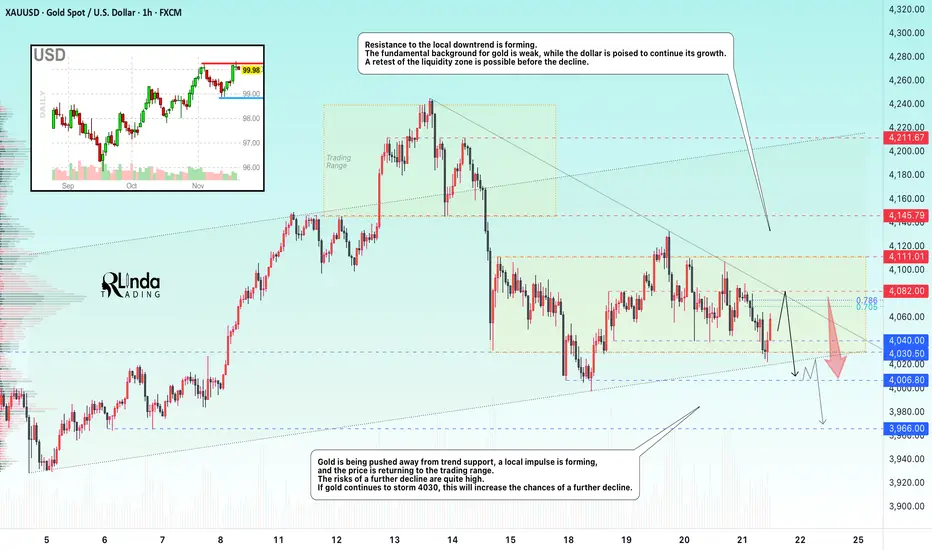
GOLD → Mixed data forms a symmetrical triangle FX:XAUUSD is bouncing off support at 4030, with bulls trying to maintain the current trend. The fundamental backdrop is currently weak for gold, which is why there are bears in the market. The PMI report is coming up...
Mixed US employment data (NFP growth to 119K, but unemployment rose to 4.4%) has created uncertainty. The probability of a Fed rate cut in December remains at 40%. Fed officials remain cautious, warning of the risks of premature easing.
Focus on the 4070-4082 area and local trend resistance...
Gold is awaiting new signals from PMI data. A breakout of the range is likely if there are significant deviations from forecasts (Manufacturing PMI: 52, Services PMI: 54.8)
Technically, a symmetrical triangle is forming on the chart, which could keep the market within its boundaries if the fundamental background remains unchanged. However, a breakout of either boundary could trigger a distribution in the direction of the break
Resistance levels: 4080, 4110
Support levels: 4040, 4030, 4006
In the medium term, gold currently looks weak. The reaction to support is weakening, a cascade of levels and a downward resistance line are forming. The market may test the 4080 area, but if the PMI is weak, gold will return to attack the trend support. However, a break above 4082 and a close above this zone could give us a chance for growth.
Best regards, R. Linda!
Gold Analysis: Buyers vs Sellers Near Critical LevelsHello traders! Let’s take a look at XAUUSD (Gold). XAUUSD is currently trading within a broad corrective structure, moving between a well-defined Resistance Level near $4,100 and a strong Support Level around $4,030. Throughout the recent sessions, Gold has repeatedly reacted to these two key zones, forming clear ranges and turnarounds visible on the chart. Earlier, price created a large Range Phase, followed by a sharp rejection from the upper boundary of the descending Resistance Line, confirming continued selling pressure from higher levels. The repeated “Turned Around” reactions along this trendline show that sellers remain active every time price approaches the upper trend boundary. After breaking below the Seller Zone around $4,100, Gold retraced into the lower structure and entered the Buyer Zone, which aligns with both horizontal support and the ascending Support Line of the current bullish correction. This confluence makes the $4,030–$4,050 region a major demand area. Recently, XAUUSD bounced strongly from the Support Line, but the recovery stalled at the Seller Zone, where price is now showing signs of rejection once again. This confirms the zone as a significant barrier for buyers. A rejection from this level may trigger another downward movement toward the Support Level around $4,030, where buyers previously stepped in aggressively. As long as Gold trades below the descending Resistance Line and the $4,100–$4,110 area, the market retains a bearish-to-neutral tone. Only a clean breakout above this zone would signal a shift toward a stronger bullish phase and open the path to higher resistance levels. As long as XAUUSD remains below the $4,100 Resistance Level, sellers retain the advantage. I expect price to potentially reject the Seller Zone and move back toward the $4,050–$4,030 Support Level. A rejection from resistance sends price down toward $4,030, where buyers may attempt another defense. Break below this level opens the door for deeper correction. Overall, the market currently favors selling pullbacks into resistance, while the Support Line remains the key area for defending bullish structure. Please share this idea with your friends and click Boost 🚀

NZDUSD → The hunt for liquidity. Bearish trend...FX:NZDUSD is forming a correction towards consolidation after updating its global minimum. Bears may play aggressively against the backdrop of a strong dollar.
The dollar is quite strong after Thursday's news. After retesting resistance, the index is not falling, but is gathering strength and may continue to grow.
The global trend is downward. After a long consolidation, the currency pair is breaking support and updating its low. The market sentiment is bearish. Against this backdrop, NZDUSD may continue to decline after retesting resistance at 0.560 and a false breakout...
Resistance levels: 0.5606, 0.5635
Support levels: 0.555, 0.55
A false breakout, lack of bullish momentum, and price consolidation below 0.56 could trigger a further decline in price within the current trend.
Best regards, R. Linda!

GOLD → Waiting for NFP... High importance level!FX:XAUUSD is stagnating ahead of the news. The market is in a phase of uncertainty, with long shadows and short candlestick bodies. The key factor will be the US employment data for September.
We have not seen unemployment data for more than seven weeks, which makes this data highly significant. Complete uncertainty. Significant deviations from forecasts could significantly change expectations for Fed rates. The probability of a Fed rate cut in December fell to 33% after the publication of the minutes, in which the regulator expressed concerns about inflation.
The market expects 50K jobs to be created in September, compared to 22K in August.
The unemployment rate is forecast at 4.3%, with wage growth at 3.7% year-on-year.
The further dynamics of gold depend on the NFP data. Weaker indicators may reinforce expectations of Fed policy easing and support price growth, while strong data will put pressure on the metal
Resistance levels: 4082 - 4111
Support levels: 4040, 4006
In the current circumstances, having only one scenario means narrowing your view of the situation as much as possible. The market can be aggressive on news. Weak data could lock the price within the current range (trading between graces). However, a breakout of resistance at 4082 - 4111 and a close above this level could trigger growth. Otherwise, a breakdown and consolidation below 4040 could break the current bullish trend and trigger a sell-off to 3930 (especially against the backdrop of the Fed's weak but hawkish stance).
Best regards, R. Linda!

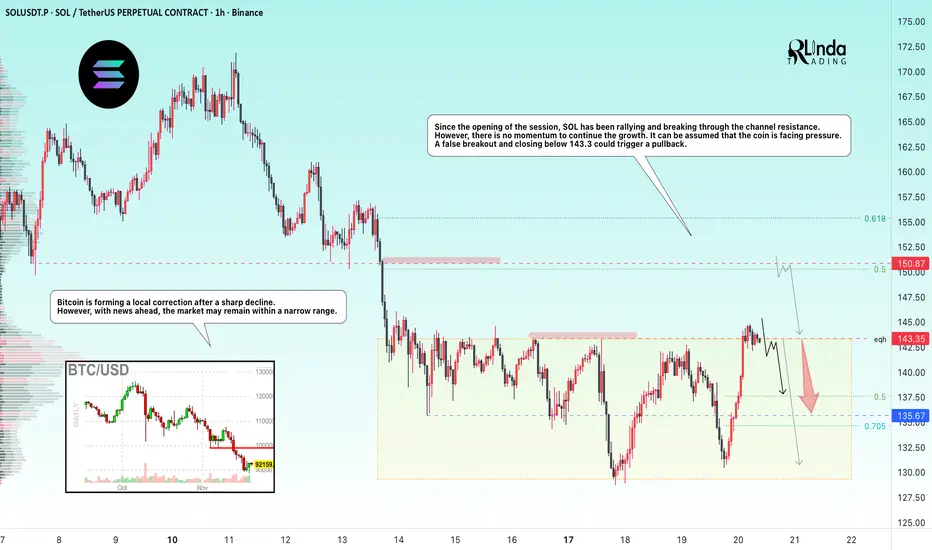
SOLANA → Manipulation - false breakout of resistance BINANCE:SOLUSDT.P flew up to resistance at 143.35 at the opening of the session and attempted to break through it, but bears may not let the price rise ahead of the news...
Bitcoin is forming a local correction after a sharp decline. However, news is ahead and the market may remain within a narrow range.
From the opening of the session, SOL rallies and breaks through the channel resistance, wasting 75% of its intraday growth potential. However, there is no momentum to continue the growth. It can be assumed that the coin is facing pressure. A false breakout and closing below 143.3 could trigger a pullback.
Resistance levels: 143.35, 150.87
Support levels: 135.67, 130.0
Two key levels for countertrend movement: 143.35 - 150.87. If the liquidity pool does not stop the price at the nearest level, then 150.87 can be considered as an additional level for trading a false breakout.
However, news on unemployment is coming soon, and the market may react quite aggressively. Therefore, if there are no trading opportunities before the news, I recommend refraining from action for an hour and waiting out the storm...
Best regards, R. Linda!
XAUUSD -SetupPrice has confirmed a bearish breakout from the structure, and I’m expecting continuation toward the three downside targets. As long as price maintains bearish momentum and stays below the key levels, the setup remains valid.
Bias: Bearish
Invalidation: ❌ Setup becomes invalid if price closes above 4107.50.
Watching for sustained downside pressure and continuation toward the marked take-profit zones.

My Prediction for BTC 2025-2026 Bouncing between the Green lines !
I hope you understand my chart! What goes up must come down and vice versa! What goes down must go up! Also see the fair value gaps hitting 🫣🤩 I hope to validate! Let’s see if and when 🤓
Greetings and happy trading 🫡

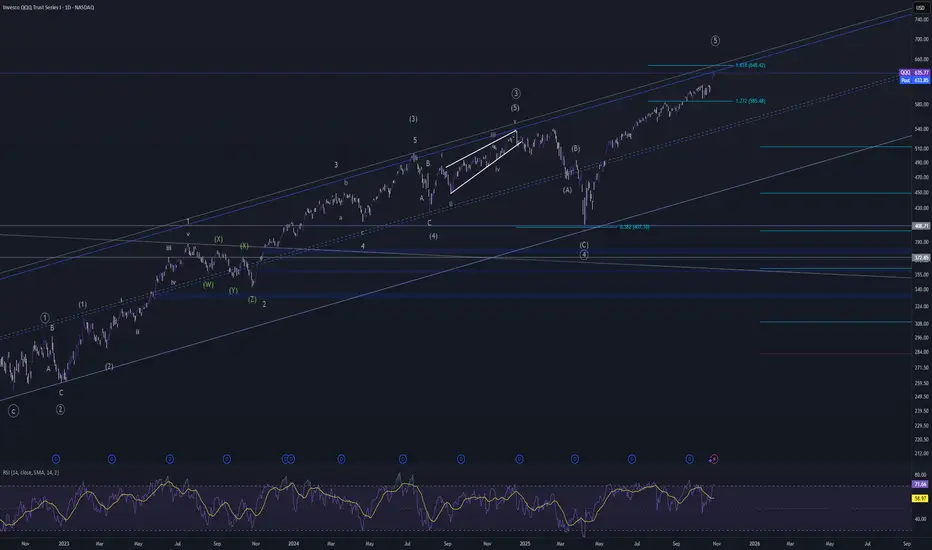
QQQ finally topping out?Getting near the top of the channel since 2022. The 161.8% extension of the drop down to April is right above today's high as well. Market is overbought with bearish divergence on the daily, weekly, and monthly. Maybe 1 more high???
USDCAD rise/fall?USDCAD at a key zone and showing signs of weakness. Some major news coming in less than 2 hours, waiting for liquidations and reactions to jump in on sniper entries.

EURUSD - The Bears Are Waiting at the Gate!EURUSD remains overall bearish, trading within a falling red channel and respecting the sequence of lower highs and lower lows.
📈Currently, the pair is approaching a massive structure zone highlighted in blue, an area that has acted as both support and resistance multiple times in the past. This zone also aligns perfectly with the upper trendline of the channel, adding even more confluence.
As long as this resistance holds, I’ll be looking for potential short setups, expecting a rejection that could drive price back toward the lower boundary of the channel.
The bears are watching this level closely, will they step in again? 👀
⚠️ Disclaimer: This is not financial advice. Always do your own research and manage risk properly.
📊All Strategies Are Good; If Managed Properly!
~Richard Nasr

COPPER / GOLD & ISM PMI = Critical For AltseasonBeen seeing a lot of commentary on COPPER / GOLD.
This is a strong indication of industrial growth in the economy, as the demand for copper rises with build-outs.
The ISM PMI has a very strong correlation with C/G, also showing strength in the economy, as consumers buy more which gives businesses the ability to expand operations.
In a nutshell, these charts portray “Retail” ie “Main Street”.
There’s a very real possibility that we do not get our typical Alt Season at all this cycle if C/G & ISM PMI do not have a violent move up in the next few months. (more on this later)
The last time we saw such a divergence between these two was in January 2016 where it took C/G ~230 days to turn-up.
This would put Alt-Season Q4 ’26 - Q1 ’27, which makes sense theoretically based on Trump’s suspected stimulus plans which would come right before mid-terms.
This would give us our typical year-long bear market which has snuck up on us all because we lacked the retail euphoria phase due to very weak retail participation.
HOPIUM:
In 2016 When the ISM climbed above 50, COPPER soon found a bottom and Alts ripped.
Notice the bullish divergence on the RSI during that time, same as we are seeing now.
It looking like C/G may have found a bottom on this multi-decade parallel channel.
*Our livelihood depends on the ISM showing immense strength in the coming months so that C/G can follow.

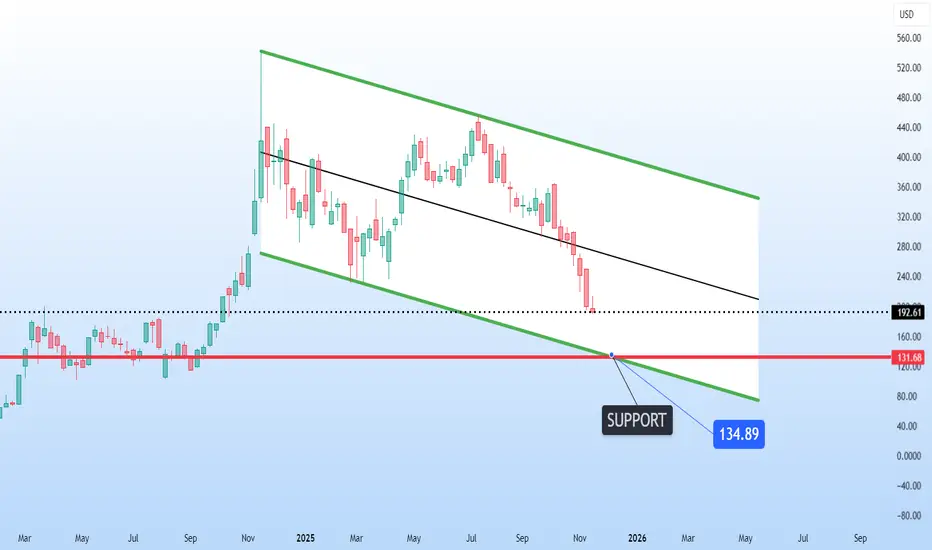
Strategy is sliding deeper inside its descending chanStrategy NASDAQ:MSTR is sliding deeper inside its descending channel, drifting toward a heavyweight support zone near 134–135. Price isn’t touching the channel bottom yet, but the structure is clearly guiding it toward that confluence level where major reactions tend to happen.
This support has history. It’s been a battleground before, and it could become the line where momentum flips once again. If buyers step in as price approaches that zone, it could set the stage for a powerful reversal.
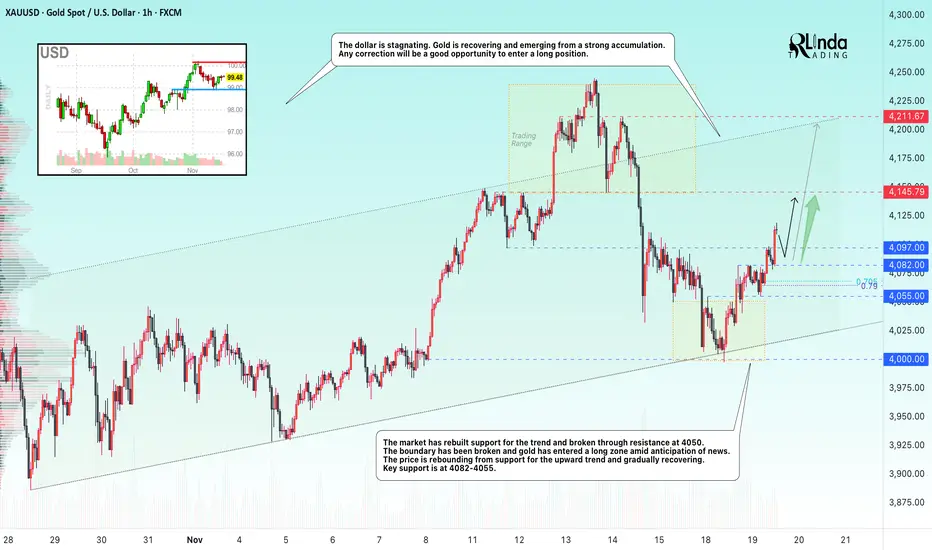
GOLD → Market support, exit from consolidationFX:XAUUSD is feeling market support ahead of the news. The price is rebounding from trend support, breaking through strong resistance and enjoying high interest from bulls...
The rise in demand for defensive assets is driven by concerns about the overvaluation of technology stocks and weak US labor market data. The number of applications for unemployment benefits rose significantly in October. Private employers cut jobs for four weeks. The Fed minutes may show disagreement over the regulator's future policy, and the probability of a rate cut in December is estimated at 50/50. The market's attention is focused on September NFP data (forecast: +50K).
Gold is awaiting signals from the Fed and employment data. The Fed's cautious stance and weak NFP data could support further price growth.
Resistance levels: 4145 - 4211
Support levels: 4097, 4082, 4055
Gold is entering a long zone. Any correction could be a good opportunity to enter the market. Pay attention to key support levels for trend trading...
Best regards, R. Linda!
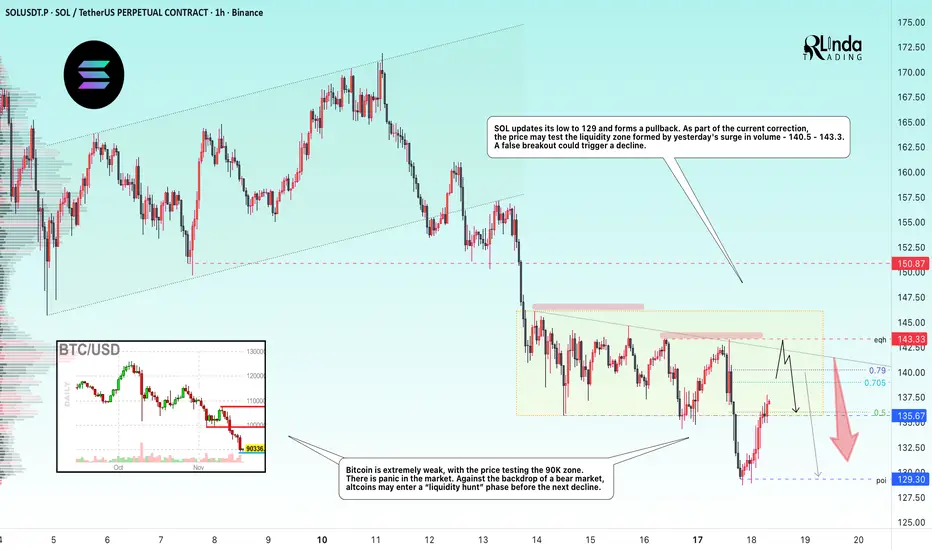
SOLANA → Hunting for liquidity in a weak market BINANCE:SOLUSDT is forming a countertrend correction. Zone of interest: 140.0–143.5. The lack of bullish potential and positive fundamentals could cause another decline...
Bitcoin is extremely weak, with the price testing the 90K zone. There is panic in the market. Against the backdrop of a bear market, altcoins may enter a phase of “liquidity hunting” before another decline.
Solana's price on D1 broke through fairly strong support at 141.3-138.5. The trend is bearish, and the breakout of support confirms the weakness of buyers (strength of sellers) at the moment.
SOL is updating its low to 129 and forming a pullback. As part of the current correction, the price may test the liquidity zone formed by yesterday's surge in volume - 140.5 - 143.3
Resistance levels: 139.0, 140.2, 143.3
Support levels: 135.67, 129.3
Consolidation is forming above the support range - 135.67. Most likely, bulls may flood the volume and provoke another rise to the liquidity zone, but there may not be enough potential for continued growth. A false breakout and lack of bullish momentum could trigger a decline to 135.5 - 129.3.
Best regards, R. Linda!
GBPJPY → Attempt to reverse the local trend to bullish FX:GBPJPY breaks the structure of the local downtrend amid the fall of the Japanese yen. The price may continue the global bullish trend...
The yen continues to fall, the pound is rising. A breakout of the trend resistance is forming. The global trend is bullish. Key support is 203.500 - 203.260. Consolidation above this zone will confirm the bullish structure and may support further growth. If the bulls keep the price above 203.500, it could trigger growth.
Resistance levels: 204.06, 205.32
Support levels: 203.52, 203.26
There is a battle between the bulls and bears for the 203.5 area. Consolidation is forming above 203.0, confirming the importance of the current zone. Now the focus is on the bulls; if they can keep the price above 203.5, the growth will continue. Otherwise, the price may test support...
Best regards, R. Linda!

GOLD is expected to rise in a parallel channelGOLD has a bullish momentum as of now, reaching new LH then expected to decline according to my analysis.
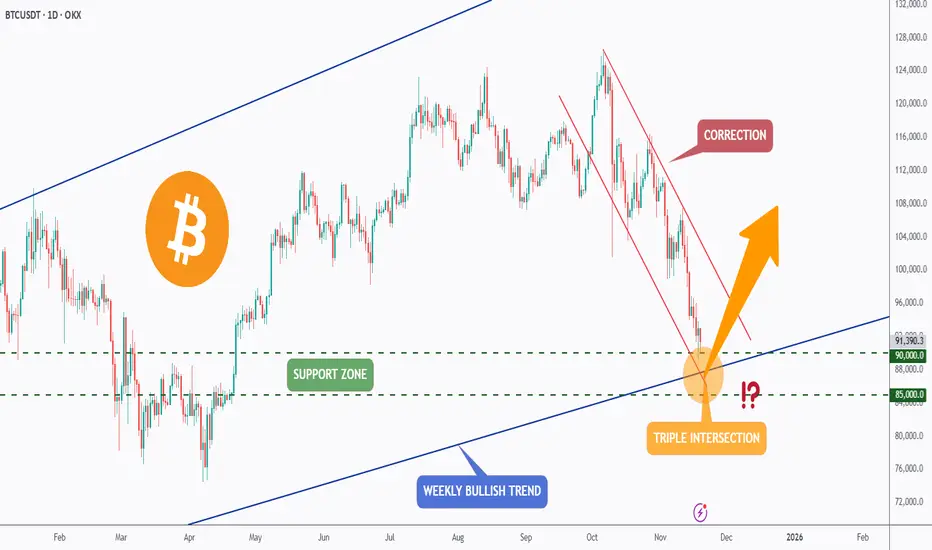
BTC - Triple Intersection… Now or Never for the Bulls?Bitcoin has been in a steep correction for weeks, sliding inside a clear falling channel. Despite the heavy sell-off, price is now approaching one of the strongest confluence zones on the entire chart, a triple intersection.
This key level combines:
1- The major weekly bullish trendline
2- The horizontal support between $85,000–$90,000
3- And the lower boundary of the falling corrective channel
This kind of alignment doesn’t happen often. It’s the area where long-term bulls typically show up.
As long as BTC holds above $85,000–$90,000, the macro bullish structure remains intact. A strong reaction here could trigger a reversal and kick off the next impulsive wave upward. However, if this triple confluence fails, the market may face a deeper correction before stabilising.
We’re standing at a decisive moment… will this zone ignite the next bullish leg or break down into another wave of fear? 🤔
⚠️ Disclaimer: This is not financial advice. Always do your own research and manage risk properly.
📚 Stick to your trading plan regarding entries, risk, and management.
Good luck! 🍀
All Strategies Are Good; If Managed Properly!
~Richard Nasr.