EURUSD Short: Continuation Within the Downward WedgeHello, traders! The prior market structure for EURUSD was a bullish ascending channel, which failed and led to a breakdown. This reversal has established the current bearish market phase, which has taken the form of a downward wedge. This pattern has been guiding the price auction lower through a series of lower highs and lower lows, confirming that seller initiative is dominant.
Currently, the price action is consolidating within this wedge. Following a minor bounce, the market is showing signs of weakness and appears ready to continue the established downtrend, respecting the wedge's boundaries.
My scenario for the development of events is a direct continuation of the decline within this wedge. I expect the price to complete another leg down from the current levels. The take-profit is therefore set directly at the 1.1615 level, targeting the demand zone which aligns with the lower support line of the pattern. Manage your risk!
Parallel Channel

BTCUSD Long: Path to 123000 After BreakoutHello, traders! The prior market structure for BTCUSD saw a significant reversal after the price broke out of a descending channel. This shifted control to buyers and led to a prolonged consolidation phase, with the price auction building a range between the demand zone 2 near 109700 and the supply zone around the 117000 level.
Currently, this long period of balance has been resolved with a decisive breakout. A strong bullish initiative from the demand zone 2 has propelled BTCUSD above the 117000 supply level and out of the consolidation range. The market is now in a clear bullish expansion phase after breaking this key structural point.
My scenario for the development of events is a classic breakout and retest. I expect the price to make a corrective pullback to test the former resistance at the 117000 - 118000 supply zone as new support. In my opinion, a successful bounce from this zone would confirm the breakout's validity and trigger the next impulsive wave higher. The take-profit is therefore set at 123000. Manage your risk.

Gold can Start a Corrective Move After a Strong RallyHello traders, I want share with you my opinion about Gold. The broader market context for Gold has been decidedly bullish since the price reversed and broke out from a prior descending channel. This structural shift established a new uptrend, which has since been neatly contained within a well-defined ascending channel, guiding the price action of XAU higher through a series of higher highs and higher lows. After breaking two key levels, the price has completed another full rotation and is now at a critical inflection point. Currently, the asset is trading very close to the resistance line of this ascending channel. My strategy is based on the expectation that the price will reach this line and then be rejected, initiating a corrective decline. I think that after such a strong run, a pull-back is a probable scenario. A confirmed reversal from this upper boundary would validate the short idea. Therefore, I have placed my TP at 3715 points. As noted, this is an intermediate target not located at a major support zone, designed to capture the initial phase of the anticipated downward correction. Please share this idea with your friends and click Boost 🚀
Disclaimer: As part of ThinkMarkets’ Influencer Program, I am sponsored to share and publish their charts in my analysis.
Euro will potentially Fall to 1.1680 After a Fake RallyHello traders, I want share with you my opinion about Euro. The market dynamic for the Euro has shifted from bullish to corrective after the price broke down from a prior upward channel. This structural change has led to the formation of a large downward pennant, a consolidation pattern that has been guiding the price of EURUSD lower. The market is currently trading near the resistance line of this pennant, with volatility compressing as it approaches the apex, signaling that a significant move is imminent. In my mind, an immediate breakout from this pennant could be a deceptive move designed to trap buyers. I expect that the price may initially break out to the upside and rally towards the major 1.1800-1.1780 seller zone. I think this rally will fail upon testing this significant area of historical resistance, creating a 'bull trap'. A confirmed and strong rejection from this seller zone would validate the overarching bearish scenario and likely trigger a sharp reversal to the downside. Therefore, I have placed my TP at the 1.1680 level, representing a logical objective for the decline that would follow such a failed breakout. Please share this idea with your friends and click Boost 🚀
Disclaimer: As part of ThinkMarkets’ Influencer Program, I am sponsored to share and publish their charts in my analysis.

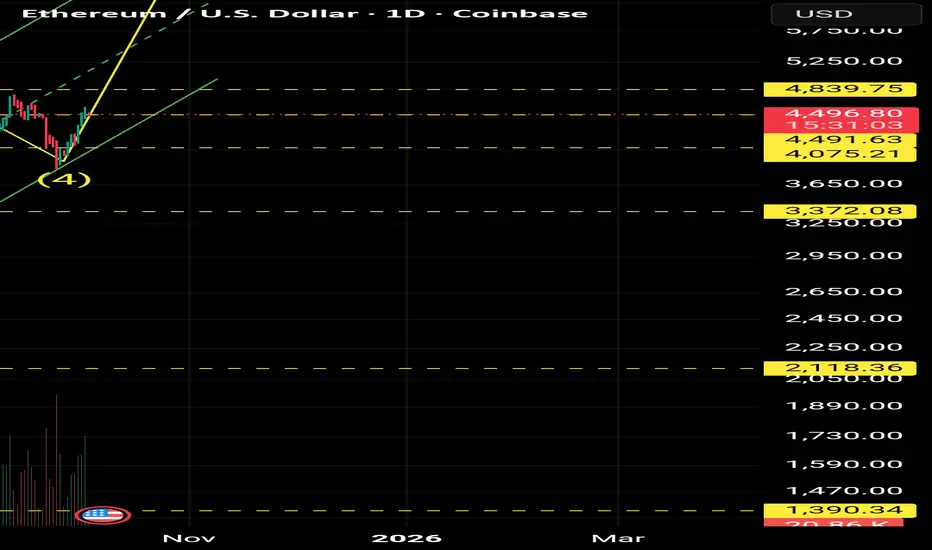
Eliots wave 5 to $7500Acording to the ascending channel and the eliots wave pattern we are heading to a possible $7500 target by the end of uptober.
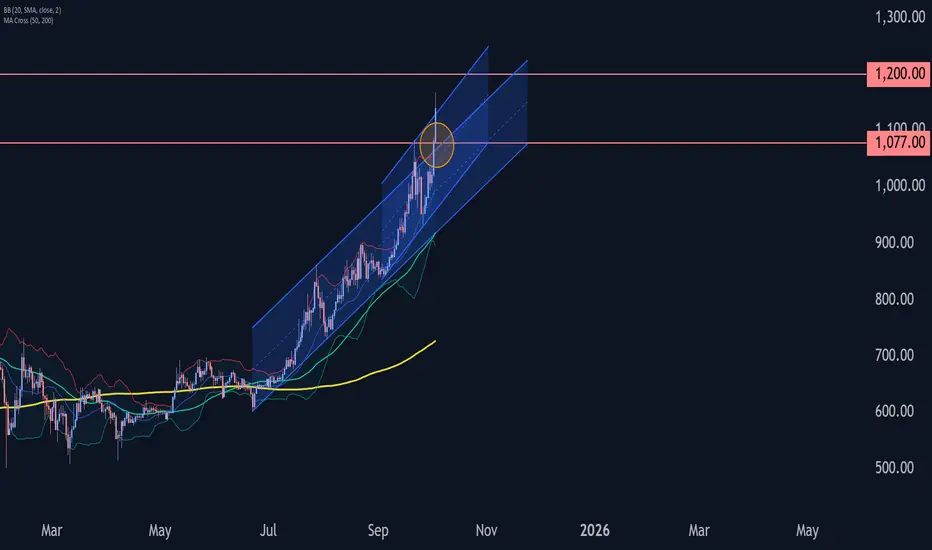
BNB Wave Analysis – 2 October 2025- BNB broke resistance area
- Likely to rise to resistance level 1200.00
BNB cryptocurrency recently broke the resistance area between the resistance level 1077.00 (top of the previous impulse iii) and the resistance trendline of the daily up channel from June.
The breakout of the resistance area accelerated the active impulse wave 3 of the intermediate impulse wave (c) – which today broke the recent up channel from the start of September.
Given the clear daily uptrend, BNB cryptocurrency can be expected to rise to the next resistance level 1200.00.
Bitcoin may be Rejected from Channel ResistanceHello traders, I want share with you my opinion about Bitcoin. The established market structure for Bitcoin remains bullish, with the price action being methodically guided higher within a well-defined upward channel. This pattern has been in effect since the resolution of a prior consolidation, creating a clear sequence of higher highs and higher lows. The price of BTC has just completed another full upward rotation within this structure and is now positioned at a critical inflection point. Currently, the asset is directly testing the upper boundary of the upward channel 2, a level which forms a powerful confluence of resistance with the horizontal 117500 - 118200 seller zone. In my mind, the resistance of this channel is likely to hold, initiating a corrective phase. I expect a rejection from this area, leading to a downward move that will break the current support level at 115600. I think this decline will continue towards the channel's main support line. Therefore, I have placed my TP at 113250, which aligns with this dynamic support line. Please share this idea with your friends and click Boost 🚀
Disclaimer: As part of ThinkMarkets’ Influencer Program, I am sponsored to share and publish their charts in my analysis.

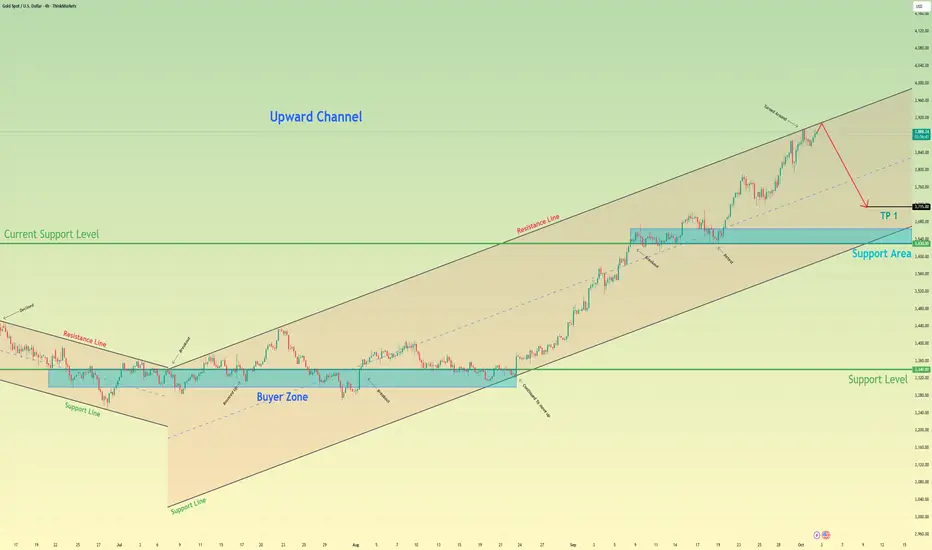
XAUUSD: Rally will Continue inside Upward ChannelHello everyone, here is my breakdown of the current Gold setup.
Market Analysis
From a broader perspective, the market for Gold has been in a complex but strong uptrend. We've seen the price break out of an initial consolidation and push through multiple support levels, like the one at 3700, establishing a clear bullish market structure defined by an Upward Channel.
Currently, after a strong rally, the price has entered a corrective phase. This pullback is guiding the price down towards the major ascending trend line, which has acted as the backbone for this entire upward move. This is a critical area to watch for a potential reaction.
My Scenario & Strategy
My scenario is built on the idea that this correction is a healthy pullback within a larger uptrend. The major ascending trend line is a significant structural level, and I expect it to act as strong dynamic support, providing a logical place for buyers to re-enter the market.
Therefore, the strategy is to watch for this bounce. A successful defense of the trend line would validate the long scenario. The primary target for the next impulsive wave higher is 3945, which aligns with the resistance line of the upward channel.
That's the setup I'm tracking. Thank you for your attention, and always manage your risk.

NZDJPY: Another Confirmed Pullback?! 🇳🇿🇯🇵
AUDJPY dropped as I predicted.
Another Yen pair that looks bearish to me is NZDJPY.
The price has just violate a support line of a consolidation range
on an hourly time frame.
It indicates a highly probable pullback.
Goal - 85.72
❤️Please, support my work with like, thank you!❤️
I am part of Trade Nation's Influencer program and receive a monthly fee for using their TradingView charts in my analysis.

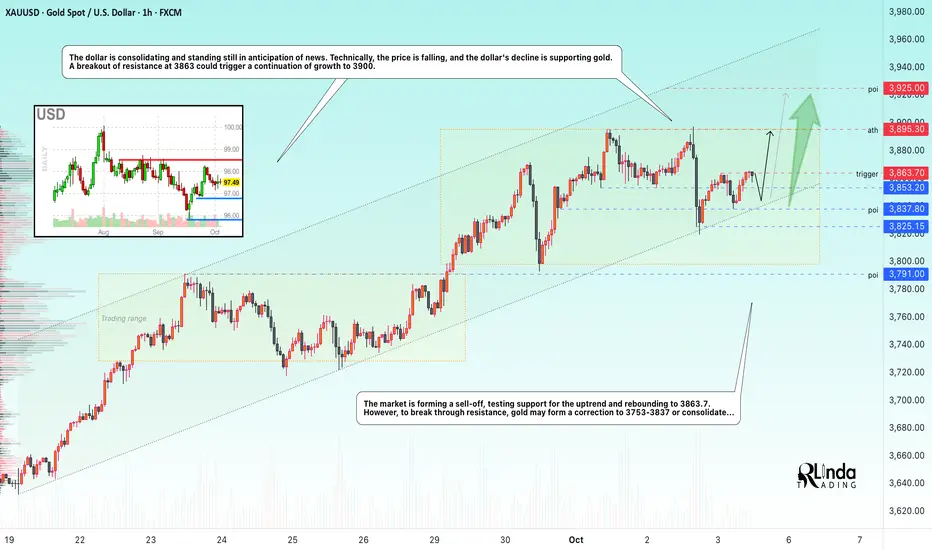
GOLD → Consolidation before continued growth. Trigger 3863FX:XAUUSD is consolidating in the range of 3837.8 - 3863.7, preparing for its seventh consecutive week in positive territory. Despite a correction from a record high of $3897, the metal remains supported by a combination of the Fed's dovish policy and geopolitical risks.
Key supporting factors: Expectations of Fed easing: Dovish sentiment continues to fuel interest in gold. Geopolitical tensions and tougher G7 sanctions against Russia. The ongoing shutdown is delaying the release of US data, increasing uncertainty.
Important: If markets ignore the shutdown, gold may face a correction.
US services data (ISM Services PMI) and Fed speeches: May adjust rate expectations.
Resistance levels: 3863.7, 3900
Support levels: 3853, 3837, 3825
Focus on the current consolidation range of 3863 - 3837. Before attempting a breakout, a retest of support may form within the consolidation. The trend remains bullish, as does the sentiment at the moment.
Best regards, R. Linda!
EURUSD, Euro another "black swan" making? 1/Oct/25Euro not US a new coming "black swan"? As EURUSD long term chart show it's now at "very" critical resistance" zone "Slaughtered" by US or France/UK seeking IMF bailout?

CRV / USDT : One strong move will start Massive rallyCRV is breaking out from trend line resistance. A confirmed breakout with strong momentum can open the way for a rally towards $1.00 – $1.15.
Keep a close watch, wait for confirmation, and manage risk wisely.

Looks goodDescending channel about to be broken out. The 13 support level is holding up very well. Lots buyers in that area. Next stop after the breakout the 16 level. SL triggers if a daily candle breaks down and closes under the support level. This stock is very volatile, wait until it the daily candles closes to trigger the SL.

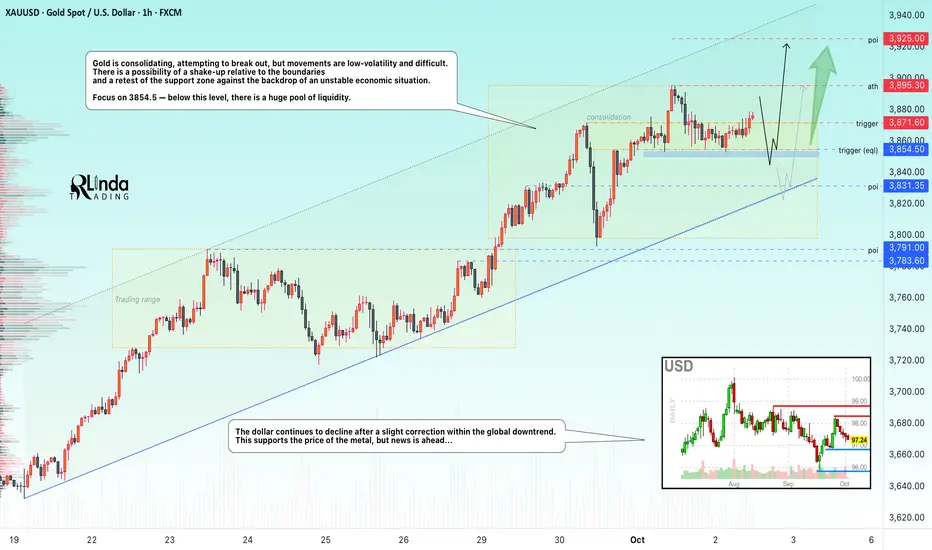
GOLD → Consolidation before growth FX:XAUUSD is correcting from 3895 and forming consolidation with a key support area at 3854, below which lies a huge pool of liquidity. A deep correction is unlikely due to ongoing risks.
The suspension of NFP publication due to the shutdown and inflation creates uncertainty for Fed policy, as does weak employment data...
However, the resumption of government work will allow the publication of data on unemployment claims and factory orders, so increased volatility in the markets is to be expected on Thursday/Friday...
The correction in gold is a temporary pause. As long as US fiscal risks, labor market weakness, and geopolitical tensions remain, the uptrend will remain intact. The $3850 level is the nearest support.
Resistance levels: 3871.6, 3895, 3900
Support levels: 3854.5, 3831.3
The most likely scenario at the moment is a long squeeze in the 3854.5 liquidity zone before continuing to rise beyond 3900...
Best regards, R. Linda!
GBPUSD | Retest of Broken Channel Reinforces Bear CaseDespite market hopes for multiple BoE rate cuts, the September meeting disappointed. The Bank held rates at 4% and slowed its QT pace — a signal of policy caution rather than hawkishness.  Two committee members pushed for cuts, but the broader tone emphasized sticky inflation — especially in services and food — keeping constraints on GBP strength.
Technical Lens
• Price has broken decisively below the ascending channel that had underpinned the recent GBPUSD rally.
• The pair is now retesting the lower trendline of that channel from below, which is acting as resistance — a classic break-then-retest setup.
• Momentum indicators (e.g. RSI) show room for further downside, with no signs yet of bullish divergence.
• Should resistance hold on the retest, it would add weight to the view that the earlier upside leg is exhausted and that the next impulse is lower.
Scenarios
• If resistance holds (retest fails): The broken channel becomes a barrier. We lean toward a resumption of downside — targeting the ~1.3100 region as the next structural zone.
• If buyers reclaim the channel (close back inside): A short-term bounce is possible, but the macro framework and internal momentum remain hostile to sustained GBP upside. Any rebound is likely capped by the same former channel boundary.
Catalysts to Watch
• UK inflation data (CPI, PPI, services inflation) — stickiness could delay dovish expectations.
• BoE communication or minutes — changes in nuance could shift market expectations.
• US / Dollar strength or weakness (as GBPUSD also reacts to broad USD moves).
• Risk sentiment or spillovers from global macro shifts.

XAUUSD Short: Targeting 3800 on a Corrective MoveHello, traders! The price auction for XAUUSD has been operating within a well-defined ascending channel, confirming a strong bullish trend. This structure has guided the price higher through a series of impulsive moves and pullbacks, with buyers maintaining the initiative throughout this phase.
Currently, the auction is at a critical inflection point at the top of this channel. The price has rallied to directly test the channel's ascending supply line after a strong run-up. This is a key area where sellers are expected to emerge and challenge the prevailing bullish momentum.
My scenario for the development of events is a short-term corrective move from these highs. I expect that sellers will defend the supply line and reject the price, initiating a downward rotation back towards the channel's support. A failure to break out higher would confirm a temporary correction is underway. The take-profit is therefore set at 3800, targeting the major demand zone. Manage your risk.
