GBPUSD bear market or range now is calledThe technical outlook for GBPUSD suggests further downside potential, with an initial measured move projection targeting the 1.3200 support zone, representing a decline of approximately 500 pips from current levels.
Two potential selling scenarios emerge:
Immediate Entry : A short position could be considered from the current zone if bearish momentum is already established.
Optimal Entry: A more favorable risk-to-reward opportunity may arise near the 1.4100 resistance zone. A clear bearish rejection pattern (e.g., a pin bar or bearish engulfing) at this level would provide a stronger technical signal to initiate a short trade.
Trade Structure (if selling at 1.4100):
Entry: Upon confirmed rejection at 1.4100 resistance.
Stop-Loss: Placed above the recent swing high (e.g., above 1.4150).
Take-Profit: Primary target at 1.3200.
Invalidation: A sustained break and close above the 1.4200 resistance zone would invalidate the bearish scenario.
DISCLAIMER: ((trade based on your own decision))
<<press like👍 if you enjoy💚
Parallel Channel

GOLD (XAUUSD): Correction After Selloff
Gold may finally start recovering after a strong bearish rally.
A bullish violation of a resistance line of a falling channel
indicates a local strong buying interest.
Goal - 4926
❤️Please, support my work with like, thank you!❤️

Gold Reclaims Support After Sharp Drop - 5,100 Resistance as TP1Hello traders! Here’s my technical outlook on XAUUSD (4H) based on the current chart structure. Gold initially traded within a clearly defined range, where price moved sideways, signaling a period of consolidation and market balance before the next impulsive move. From this range, XAUUSD broke to the upside and transitioned into a well-structured ascending channel, confirming strong buyer control with a consistent sequence of higher highs and higher lows. Price respected both the rising support line and the channel resistance, highlighting healthy bullish conditions throughout this phase. As the uptrend developed, gold eventually approached the key Resistance / Seller Zone around 5,100, where selling pressure became evident. Although price briefly broke above this level, the move lacked acceptance and resulted in a sharp rejection, forming a fake breakout and trapping late buyers. Following this rejection, XAUUSD dropped aggressively toward the Buyer Zone around 4,890–4,810, which aligns with previous resistance turned support and a key horizontal support level. The reaction from this area was strong, indicating active demand and buyer interest returning to the market. Currently, price is stabilizing above the Buyer Zone and attempting to recover after the fake breakdown. This behavior suggests a corrective rebound rather than a full trend reversal at this stage. Structurally, as long as gold holds above the Buyer Zone and maintains acceptance above support, a recovery move toward the 5,100 Resistance Level (TP1) remains possible. This area also overlaps with the Seller Zone, where selling pressure is likely to reappear. My scenario: holding above the Buyer Zone keeps the corrective bullish recovery intact, with 5,100 as the primary upside target. A strong rejection from resistance could resume downside pressure, while a decisive breakdown below the Buyer Zone would invalidate the recovery scenario and signal continuation of the broader corrective move. For now, XAUUSD is at a key decision area, with buyers attempting to defend support and build upside momentum. Please share this idea with your friends and click Boost 🚀

GOLD reverse?GOLD has been continuing to drop upon market open. Waiting for confirmation as it is near the SUPPORT zone for a possible climb back up.

Retest of 2021 ATH & RSI ResetThe green upwards channel has failed and we will now likely find new support within the historical blue channel.
The last two higher highs (HH) had lower lows (LL) on the RSI, a bearish divergence which could lead to a return of its starting point prior to the divergence. This seems to be the 2021 ATH around 69K.
I would expect a bounce once the RSI goes sub-30 levels, it could even mean the bottom already since we didn't have any parabolic moves / blow-off top this time around.
Macro economically, technically and politically the environment couldn't look at any better for Bitcoin. The market cap of sub 2 trillion is still low all things considered, it could easily grow to 100 trillion in today's dollar value in the upcoming decades.

GOLD - The market may move towards consolidation...FX:XAUUSD is testing 4686, but by the end of Friday's session, traders are buying back the drop to 4800. The market may enter a consolidation phase until the fundamental situation stabilizes.
The reasons for the decline may include a change in the Fed's rhetoric due to the nomination of a new head of the regulator, Kevin Warsh, who is likely to adopt a more hawkish monetary policy. In addition, the growth of the dollar was also driven by hot inflation data. Traders reacted quite aggressively to the situation and moved to aggressively lock in profits.
In the new trading week, we are awaiting PMI, JOLTS, and ISM PMI data, as well as perhaps the most important economic index, NFP.
Technically, it is too early to talk about a clear market direction, as the situation has not yet stabilized. Accordingly, at the moment, I expect that the market may move towards consolidation after such a sharp decline. The approximate boundaries within which the price may stop are 4650 - 4950 (5000).
Support levels: 4800, 4686, 4643
Resistance levels: 4944, 4990, 5000
The Asian market may test resistance, but if bears keep the market below 5000, gold may form a correction to 4800 - 4686 due to the floating fundamental background.
Best regards, R. Linda!

HYPEUSDT - Dump after pumpBINANCE:HYPEUSDT.P ended its rally in the 35.0 zone, smoothly changing the market phase from pump to dump. The cryptocurrency market is weak, but after a sharp decline, there may be a local correction
Bitcoin fell again to 81K during the Asian session. A strong rebound or uptrend should not be expected at this time. There is no fundamental support for the crypto market. Any attempts at growth may be perceived as a hunt for liquidity before the fall.
Within the framework of the downward trend and the weak state of cryptocurrencies, HYPEUSDT formed a pump phase and tested the local resistance zone of 35.0. The market was unable to reach the liquidity zone of 36.4. Before continuing its decline, against the backdrop of a general market correction, the coin may test 31.38 - 32.90
Resistance levels: 31.38, 32.9
Support levels: 29.98, 28.4, 25.84
If the market rebounds after the fall, the coin may test the resistance zone of 31.38 - 32.9. Another short squeeze and a close below 29.98 could trigger a continuation of the dump down to the interim bottom...
Best regards, R. Linda!

Time and Price Analysis of Bitcoin until 2029Time and Price Analysis of Bitcoin for the Next Three Years
Bitcoin depends on miners for its continued existence, and the most important factor affecting the fate of miners is Bitcoin’s halving events.
For this reason, Bitcoin’s bullish and corrective waves have a time dependency relative to its past movements.
By using this method, along with analyzing wave lengths and key support and resistance zones, we can expect Bitcoin’s price movements over the next three years to follow the path outlined below.
Year 2026
Throughout 2026, Bitcoin is expected to continue its downward trend. The appropriate price range for the completion of this bearish phase is estimated to be between $55,000 and $40,000, based on normal market behavior.
However, if severe negative news emerges, a very fast move toward the $32,000 area can also be expected.
The estimated timeframe for market bottom formation is November 2026 to January 2027.
The optimal buying strategy is to divide capital into 8 equal parts and buy every Saturday, starting from early November, regardless of the current market price.
Selling Time and Price Targets
The expected timeframe for Bitcoin to reach its next major peak is between August and October 2029.
Under normal market conditions, the minimum and maximum price range we expect Bitcoin to reach is between $165,000 and $250,000.
The probable price path over the coming period is illustrated on the chart as a curve.
A similar analysis was conducted in 2020, the link to which is attached. You can observe that Bitcoin followed the projected bullish and bearish path almost exactly as anticipated.

#UKOIL - Double bottom, aiming $95Hi guys! 👋
🔔Brent crude has been in a prolonged corrective phase since the 2022 highs, but price action now suggests a potential trend reversal from a well-defined long-term support zone.
🔔 The market has twice defended the $58.7 level, forming a clear double bottom structure and signaling seller exhaustion after an extended downtrend.
🔔 The first rebound occurred near the 0.5 Fibonacci retracement, strengthening the validity of the base and increasing the probability of a sustained upside move.
🔔 Key resistance levels to watch are $72.5, $77, and $86.5, each acting as a structural barrier that must be cleared to maintain bullish momentum.
🔔 A confirmed breakout above these zones opens the path toward the $95–$95.7 target, which represents the measured move of the double bottom pattern.
🔔 From a macro perspective, steady global oil demand growth and persistent geopolitical risk in major producing regions may support higher prices by sustaining a risk premium.
Bias : Bullish above $58.7
Invalidation : Sustained breakdown below the double-bottom base
✊ Good luck with your trades! ✊
• If you like the idea, hit the 🚀 button
• Please ✍️ your thoughts in the Comments section
• And follow me for more updates.

BTCUSD - Cycle Analysis UpdateHi guys! 👋
🔔 As you can see on the chart, we are following the setup precisely.
🔔 I'm still expecting another red candle to complete the Three Black (Red) Crows pattern.
🔔 The third red candle will signal us for a short-term uptrend to revisit $100K and have a steep drop.
🔔 There's also a chance of having an extended impulsive moves which consists of 9 waves.
🔔 Nevertheless, the next week's candle is much important. The original Cycle Analysis is attached to this article.
✊ Good luck with your trades! ✊
• If you like the idea, hit the 🚀 button
• Please ✍️ your thoughts in the Comments section
• And follow me for more updates.

EURUSD Short: Fake Breakout at Supply, Pullback to 1.1850Hello traders! Here’s a clear technical breakdown of EURUSD (4H) based on the current chart structure. EURUSD initially traded within a well-defined ascending channel, confirming a strong bullish environment with consistent higher highs and higher lows. This phase reflected clear buyer control and healthy trend continuation. After reaching the upper boundary of the ascending channel, price lost momentum and transitioned into a descending corrective channel, signaling a temporary pullback rather than a full trend reversal. The corrective move remained orderly, with price respecting the descending structure and gradually compressing toward the lower boundary. At the lower edge of the descending channel, EURUSD formed a clear pivot point, where seller pressure weakened and buyers stepped back in aggressively. This led to a bullish breakout from the descending channel, confirming the end of the corrective phase. Following the breakout, price accelerated sharply higher, impulsively breaking above the key Demand Zone around 1.1850, which previously acted as resistance. This clean structure flip confirmed strong buyer commitment and renewed bullish momentum.
Currently, price then surged directly into the higher-timeframe Supply Zone around 1.2000–1.2050, where a fake breakout occurred. The rejection from this area suggests that sellers are active at the highs and that the market may be temporarily overextended after the strong impulse. Such behavior often leads to a corrective retracement rather than immediate continuation.
My primary scenario is a corrective pullback from the supply zone toward the 1.1850 Demand Zone (TP1). This level represents former resistance turned support and is a key area where buyers previously entered aggressively. As long as EURUSD holds above this demand zone, the broader bullish structure remains intact, and any pullback should be viewed as corrective within an overall uptrend. A strong bullish reaction and stabilization from the demand area could open the door for another attempt higher toward the supply zone and potentially new highs. However, a decisive breakdown and acceptance below the 1.1850 demand zone would weaken the bullish bias and increase the probability of a deeper correction. For now, the market favors buyers, with the current move best interpreted as a pullback after a strong impulsive rally. Manage your risk!

BTCUSDT Fake Breakdown Sparks Bounce from DemandHello traders! Here’s my technical outlook on BTCUSDT (1H) based on the current chart structure. Bitcoin initially traded within a clearly defined range, where price moved sideways, indicating temporary balance and accumulation before the next directional move. This range eventually resolved to the upside, triggering a strong bullish impulse that pushed price sharply higher. However, this breakout failed to sustain, and BTC quickly turned around from the highs, signaling exhaustion of buyers and the start of a corrective phase. After the rejection, price transitioned into a well-defined descending channel, where it consistently respected the falling resistance line and internal support, forming a sequence of lower highs and lower lows. This structure clearly confirmed short-term bearish control. Currently, BTC is holding above the reclaimed support and stabilizing after the fake breakdown, indicating acceptance above the Buyer Zone. This behavior often precedes a corrective recovery rather than an immediate trend reversal. From a structural perspective, the area around 84,700 acts as the next Resistance / Seller Zone, which aligns with previous support turned resistance and represents a logical upside target. My scenario: as long as BTCUSDT holds above the Buyer Zone around 82,000 and continues to respect this reclaimed support, a corrective move toward the 84,700 resistance area (TP1) remains likely. This would represent a healthy pullback recovery within a broader bearish structure. However, a strong rejection from resistance could resume downside pressure, while a decisive breakdown back below the Buyer Zone would invalidate the recovery scenario and signal continuation of the downtrend. For now, price is at a key reaction zone, with buyers attempting to confirm the fake breakout and extend the rebound. Please share this idea with your friends and click Boost 🚀

EURUSD Reclaims Key Structure - Upside Toward 1.2050Hello traders! Here’s my technical outlook on EURUSD (2H) based on the current chart structure. After an extended consolidation phase, EURUSD initially traded within a clearly defined range, reflecting market indecision and balance between buyers and sellers. This ranging behavior laid the groundwork for a larger directional move. Eventually, price broke below the range and continued to trade inside a descending channel, confirming bearish control and a structured corrective phase. Sellers consistently defended the upper boundary of the channel, while price respected the descending resistance and support lines. As the downtrend matured, selling momentum gradually weakened, leading to a breakout above the descending channel resistance. This breakout marked a critical structural shift and the beginning of a bullish impulse. Following the breakout, EURUSD accelerated higher, breaking above the Buyer Zone around the 1.1920 area, which previously acted as a key resistance. This move confirmed a transition from bearish correction into bullish expansion, with buyers clearly regaining control of the market. Currently, price is trading above the Buyer Zone and holding above a rising triangle support line. A brief fake breakout below the ascending support was quickly absorbed by buyers, reinforcing the strength of demand and validating the support level. This price behavior suggests that the pullback was corrective rather than impulsive, allowing the market to reset before continuation. EURUSD is now approaching the Seller Zone / Resistance Level around 1.2050, which represents a major reaction area where selling pressure may increase. My scenario: as long as EURUSD holds above the Buyer Zone and continues to respect the ascending support structure, the bullish bias remains intact. A continuation toward the Resistance Level at 1.2050 is expected, with this area acting as TP1. A clean breakout and acceptance above the Seller Zone would confirm further upside continuation and open the door for higher targets. However, a strong rejection from resistance combined with a breakdown below the ascending support and Buyer Zone would signal the start of a deeper corrective phase. For now, structure, momentum, and price action favor buyers, with the current pullback behavior suggesting consolidation before a potential continuation move. Please share this idea with your friends and click Boost 🚀

ETH at a Decision Zone Ethereum is testing the lower boundary of a well-defined ascending channel, while experiencing a sharp capitulation drop.
This zone represents a make-or-break level for the broader bullish structure.
Technical Overview
• Ascending channel remains valid (for now)
• Price is sitting on channel support
• Price is below the moving average → short-term bearish pressure
Key Levels
• Critical Support: 2,300 – 2,400
• Next Support: 1,900 – 2,000
• Resistance: 3,000 – 3,100
• Major Resistance: 3,800 – 4,000
Bullish Scenario
If:
• Daily candles hold above channel support
• Buying wicks appear
➡️ A technical bounce is likely.
Bearish Scenario
If:
• Daily close breaks the channel
• Selling pressure continues
➡️ Trend structure fails → deeper correction.
Final Takeaway
Channels don’t break quietly.
If this level fails, ETH enters a trend reset phase, not just a pullback.

Btcusd long?This count is based on my assumptions so anything can happen not a trading or financial advice just for educational purposes only kindly do your own ta thanks trade with care good luck.

ADA [CARDANO] EWP FIB TC ANALYSIS WEEKLY TFADA — Full Cycle Elliott Wave Structure (2017–2027)
From inception to the present, ADA’s price action can be mapped as a large corrective cycle composed of complex structures, with a clearly defined impulsive and corrective alternation across degrees.
The structure begins in 2017 with a clean impulsive advance, which completes Primary wave A. This initial impulse sets the foundation for the entire higher-degree corrective cycle.
Following the January 2018 peak, price unfolds into a complex corrective structure, best labelled as an Intermediate W–X–Y, forming Primary wave B. This correction terminates at the March 2020 double-bottom low, resolving both price and time in classic corrective fashion.
From that 2020 low, ADA launches into a five-swing impulsive advance on the intermediate degree, completing Primary wave C. This move concludes Cycle degree wave W, culminating at the 2021 all-time high.
The subsequent decline unfolds as a five-wave impulsive structure on the intermediate degree, completing Primary wave A of the next higher-degree correction, with the low printed in June 2023.
From that point, price retraces in a corrective ABC zigzag, forming Intermediate degree correction into Primary wave B, which tops in November 2024. The overlapping nature, corrective subdivisions, and momentum profile are all consistent with a B-wave recovery rather than trend resumption.
From the November 2024 high, price action has shifted decisively bearish and appears to be unfolding as an impulsive decline, currently within Intermediate wave 3, heading toward completion of Primary wave C. This move is projected to terminate Cycle degree wave X, with a downside target zone in the 12¢ range.
Forward outlook (structural, not predictive):
• Completion of Cycle X is expected to resolve the entire corrective phase that began after the 2021 peak.
• From that structural low, the model anticipates a Cycle degree Y wave, which would unfold as a major impulsive advance, with long-term upside potential extending toward $10.
• Confirmation will require a clear impulsive reversal structure and sustained higher-timeframe momentum following the Cycle X low.
Like and follow for more charts like this.

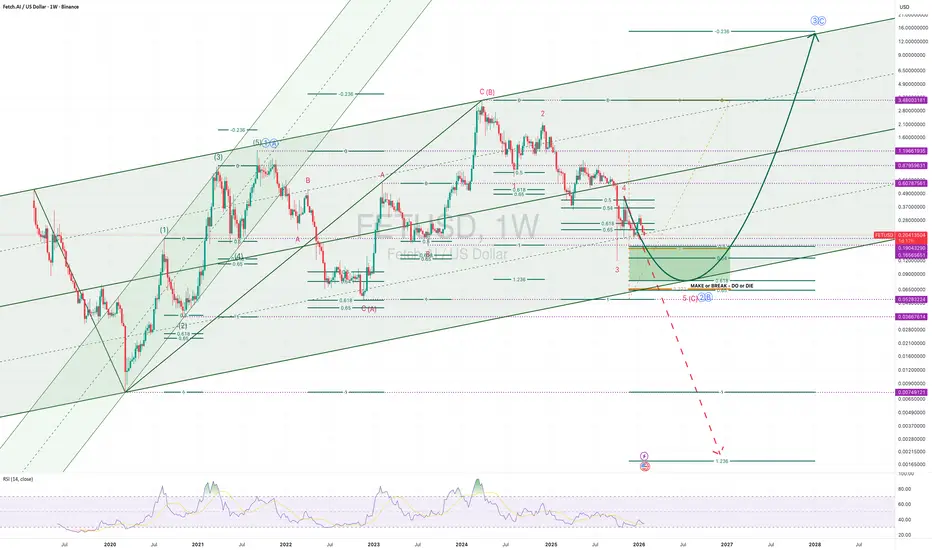
FET/USD [FETCH.AI] EWP FIB TC ANALYSIS WEEKLY TFElliott Wave Overview (FET / USD):
After the initial decline following the 2019 IEO, FET established a long-term base and advanced in a five-wave impulsive structure from the March 2020 low into the September 2021 high, marking Primary Wave 1 / A.
Since that peak, price action is best interpreted as Primary Wave 2 / B, unfolding as an expanded flat correction. Within Intermediate Wave C of Primary Wave 2 / B, the market is currently trading in Minor Wave 5, likely subwave 5 of 5, which typically represents the final phase of downside momentum.
Completion of this structure is expected near the $0.08 area, where Primary Wave 2 / B should terminate. From there, a trend reversal is anticipated, opening the door for a strong impulsive advance toward the $15 region as the next major bullish phase begins.
A decisive break below the GZ - golden zone - would invalidate this scenario and imply a deeper decline toward $0.01 and below.
Like and follow for more charts like this.
Gold 15M upcoming ideaSince Gold has hit below the 4900 area and is currently in a descending channel after coming from the upside, it can be safely analysed on the lower timeframes as hitting forming a double bottom/W formation which always goes to the upside the has a pullback to the neckline of the W before rocketing. Based on the length of the drop before the descending channel begun, we measure it fulfilling the same length in the potential climb zone which is at 5438 which can be identified as the ceiling/ SR flip zone in this setup

It's different this timeDid you🫵know, that AMEX:GLD broke down vs AMEX:SILJ last week?
It means rising support that otherwise would normally signal 4 years of malaise for silver broke. It means that AMEX:SILJ and silver may consolidate here and keep rising.

GOLD - Correction or trend reversal? Interest in 5000...FX:XAUUSD is correcting, heading towards the $5000 liquidity and interest zone after record growth and the formation of an ATH of 5597. The reason is the temporary strengthening of the dollar against the backdrop of the US budget deal and profit-taking.
Key pressure factors
The dollar strengthened on optimism over the Senate deal to fund the US government. Trump's statements: he ruled out military intervention in Iran (reducing geopolitical hedging), but maintained threats of tariffs against Canada and Cuba.
However, risks of the Fed losing its independence (possible replacement of Powell), prospects for rate cuts. Geopolitical tensions (Trump's threats on tariffs, the situation with Iran) support demand for safe havens.
The correction in gold looks natural after its parabolic rise. Long-term drivers (geopolitics, pressure on the Fed) remain, so the decline may attract buyers. Further dynamics depend on the tone of the new Fed chair and inflation data.
Resistance levels: 5110, 5186, 5238
Support levels: 5046, 4988, 4901
Despite the breakdown of the local trend, a correction is forming within acceptable limits on a global scale. The zone of interest is 4988-5000, which gold may test before rebounding to 5110-5200. Gold may close in consolidation at 5000-5250 after a strong liquidation. It is important to monitor the market's reaction to key levels!
Best regards, R. Linda!

GOLD [XAU / USD] CENTURY CHART EWP TC FIB ANALYSIS MONTHLY TFThe Journey of Gold: 1833 – 2026
• 1833: Gold fixed at $20 per ounce. Under the gold standard, gold was essentially money. Prices were stable and dictated by law, not the market.
• 1934: Gold officially revalued to $35 per ounce by the United States. This was a political and monetary decision, not a market move. Gold remained fixed at this level for decades.
• January 1st, 1968: The official end of the gold standard.
Due to massive spending and rising debt from the Vietnam War, the U.S. could no longer defend a fixed gold price. Gold became freely tradable, and its market journey truly began.
The W–X–Y Corrective Structure (1968–2026)
With gold now free to move, the long-term Elliott Wave structure unfolds as a corrective W–X–Y pattern:
Wave W (1968–1980): ABC up
Gold rose from $35 to ~$850, forming a clear ABC structure.
• A: initial breakout after the gold standard ended
• B: mid-cycle consolidation
• C: final blow-off to the 1980 high
Wave X (1980–1999): ABC sideways
A long, shallow correction followed, moving mostly sideways in price but spanning nearly two decades in time. This X wave connected the first advance (W) to the next advance (Y).
Wave Y (1999–2026): ABC up
Another corrective ABC advance.
Internal swings overlap, and momentum diverges at highs, confirming corrective (non-impulsive) behaviour. Gold rises to new highs as the market continues to adjust to decades of fiat currency expansion and global monetary dynamics.
Key Takeaways
• From 1968 onward, gold is fully free to trade and its Elliott Wave journey begins.
• The W–X–Y pattern demonstrates corrective behavior, not impulsive trending.
• Each major rise (W and Y) subdivides as ABC, while the X wave serves as a connector.
• Gold’s multi-decade movement reflects market repricing against fiat currency, not classic bull market impulses.
Like and follow for more charts like this.

BTCUSDT Long: Recovery From Demand Zone - $89,800 in FocusHello traders! Here’s a clear technical breakdown of BTCUSDT (3H) based on the current chart structure. Bitcoin is trading within a broader corrective-to-recovery phase following a strong bullish impulse that previously developed inside a well-defined ascending channel. Within that channel, price consistently printed higher highs and higher lows, confirming buyer dominance and healthy trend conditions. The rally ultimately reached a key pivot point near the upper boundary of the ascending channel, where bullish momentum began to weaken. From this pivot high, BTC transitioned into a consolidation range, signaling temporary balance and distribution rather than immediate continuation.
Currently, BTC is recovering from the demand zone and moving higher along a rising demand line, while approaching the former supply level near 89,800. Price action suggests a corrective recovery rather than a full trend reversal, with buyers attempting to reclaim key structure. The area around 89,800 now acts as a critical decision zone, where market acceptance or rejection will likely define the next directional move.
My scenario: as long as BTCUSDT holds above the 87,200 Demand Zone and continues to respect the rising demand line, I expect a continuation of the recovery toward the 89,800 Supply Level (TP1). A clean breakout and acceptance above this resistance would strengthen the bullish recovery scenario and open the door for a move back toward higher resistance levels. However, a strong rejection from supply followed by a breakdown below demand would invalidate the recovery and suggest continuation of the broader corrective move. For now, price action shows buyers regaining short-term control, but confirmation at resistance is key. Manage your risk!

XAUUSD: at Key Resistance - Pullback Scenario in Focus To $5,400Hello everyone, here is my breakdown of the current XAUUSD setup.
Market Analysis
XAUUSD is trading within a broader bullish structure that previously developed inside a well-defined upward channel. After a prolonged consolidation phase marked by a clear range, price broke to the upside, confirming buyer control and initiating a strong impulsive rally. This breakout from the range acted as a key structural shift, pushing gold into an accelerated bullish phase supported by higher highs and higher lows within the ascending channel. As price continued higher, XAUUSD approached a major higher-timeframe Resistance Zone around the 5,580–5,600 area. This zone has historically acted as a strong supply region, and current price action suggests that bullish momentum is starting to weaken near this level. The market is now showing signs of overextension after a near-vertical move, increasing the probability of a corrective pullback. Importantly, price is currently trading at the upper boundary of the ascending channel, where buyers often begin to take profits and sellers look for short-term opportunities.
Currently, a clearly defined Support Zone around the 5,380–5,420 area aligns with the prior breakout level and the upper boundary of the former consolidation. This zone represents a key area of interest, as it previously acted as resistance before being broken and now serves as potential support. The structure suggests that a pullback into this zone would be a healthy correction rather than a trend reversal.
My Scenario & Strategy
My primary scenario is a short-term corrective pullback from the Resistance Zone toward the Support Zone. As long as price remains capped below the 5,600 resistance and shows rejection from the upper channel boundary, I expect a move lower toward the 5,400 support area (TP1). This short idea is counter-trend and should be treated strictly as a corrective trade within a broader bullish market structure. A clean reaction into the Support Zone could attract fresh buyers and potentially lead to trend continuation afterward.
However, if price fails to find support and breaks decisively below the 5,380 level with strong bearish acceptance, a deeper correction toward the lower channel boundary would become more likely. On the other hand, a strong breakout and acceptance above the 5,600 Resistance Zone would invalidate the short scenario and signal bullish continuation. For now, price is at a critical reaction area where a pullback is technically justified.
That’s the setup I’m tracking. Thank you for your attention, and always manage your risk.
