Anglo American Monthly ViewAnglo American is in pursuit of a yearly low, first we look for a swing low, then a close above the 10 period moving average. At a minimum the yearly low will see price breach the upper resistance of the Pitchfork. In terms of time, we are within a time after a long cycle from the COVID lows.
Pitchforks

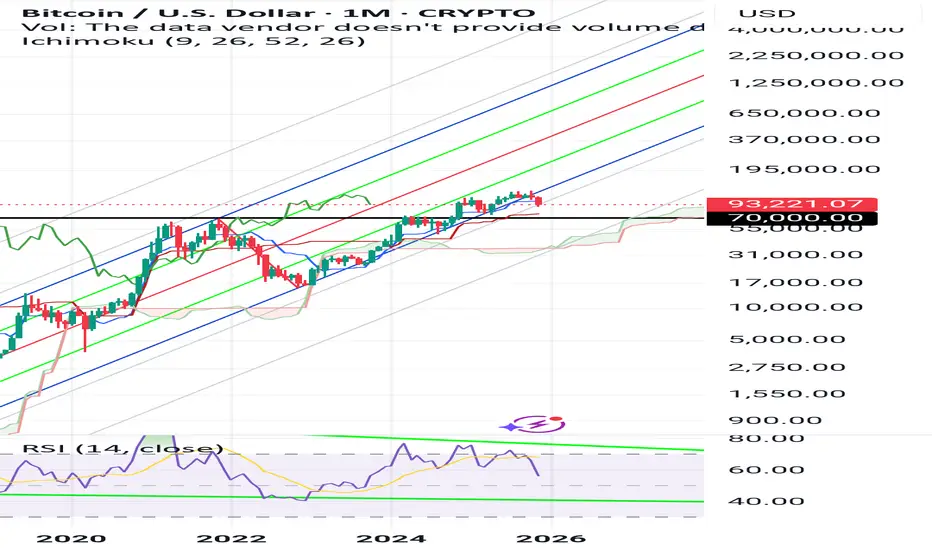
The Future of the Crypto Ecosystem: Will Bitcoin Rise Again?Following Trump’s directive to support digital currencies, Bitcoin surged from around $69,000 to a peak price around $126,000.
But after a period of major turbulence, Bitcoin began to lose value. Based on monthly Ichimoku timeframe analysis and Andrews’ Pitchfork , our models suggest Bitcoin could fall back to around $70,000 in the coming period.
We expect this downward trend to continue until early 2027.
The big question is: what happens after that? Will Bitcoin re-value and recover, or will it get stuck around these low levels, potentially threatening thousands of smaller altcoins?
Btc abcdSo this is like seeing into the future. Impossible you and I will agree. Harmonics should never be traded till they complete, or so they say.
Anyways the chart shows an incomplete AB=CD. A pitchfork.
Just an idea please don't take as gospel.

Brent crude againThe max bat is playing out in real time.
Brent is going to keep going up.
Will link idea from Pico bottom.

$BTCUSDBITSTAMP:BTCUSD monthly: BTC has been battling this support/resistance line for 11 months. The current consolidation is localized within the upper band of the pitchfork.
I don't believe the cycle has topped -- during the last cycle, prices moved down 40% in a little over 3 weeks after topping. Each retrace up only did 38.2%. Now prices have moved down only about 16% in 4-5 weeks and retraces went to 61.8%. It just does not feel like a drop from the cycle top as in the past.
I added to my long position today expecting at least one more wave up.

$BTCUSD 38.2% retracement and pitchfork median line supportBITSTAMP:BTCUSD the 38.2% retracement and the pitchfork median line are providing support for the moment.


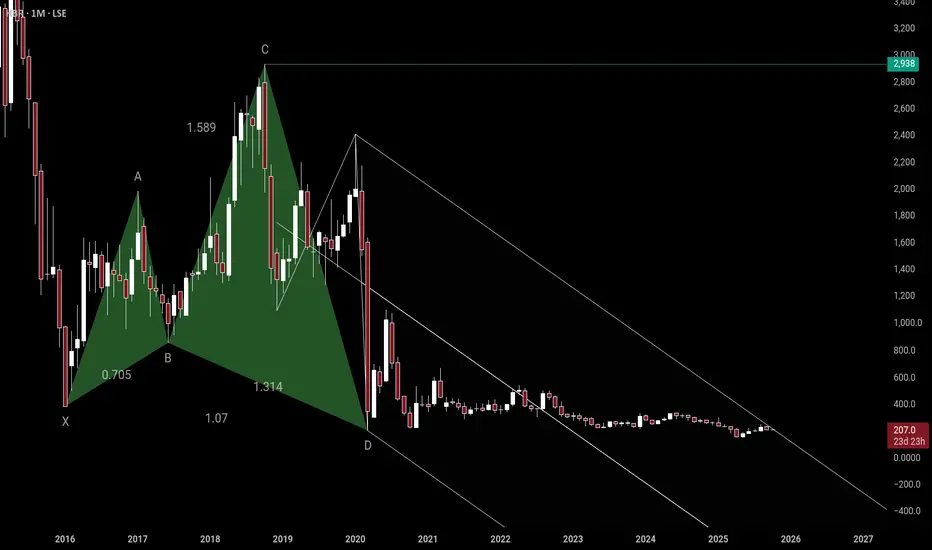
HBR massive shark pattern.This one shows a shark harmonic with schiff pitchfork. The fact this has been in consolidation/PRZ since 2020 means 1 of 2 things.
1. Bearish, the pattern has failed.
2. Bullish, this going to explode so fast and hard.
The fact Brent oil is threatening to clear its main resistance leads me to the latter.

NZDJPY Shortit not to late open Short position. as i seeing, it s starting to make a retracement .
i already opened short. if you planning open short position,
set SL at 87.420 ,
TP at 77.945.
always make BE, after broke dow theory.


USDCAD Shorti diagnosed on 4H and Daily time. now it s going on retracements peak are. its time to open short positions. One short is for daily entry , one entry is for swing trade till 1.21000.
RR is looks good. 1:22.
always move your be till break dow theory.

opened sell position. as my opinion, this movement broke 2 SP lines that shown on this, it might go fake up movement, but doesnt go up much , and i opened entry short

Fibonacci Time Zone Overlap with Fibonacci RetracementAfter breaking out of its valid Andrews fork, the price has stalled at the overlap of the Fibonacci Time Zone with the Fibonacci Retracement, and the likely scenario is a temporary price drop into the fork.
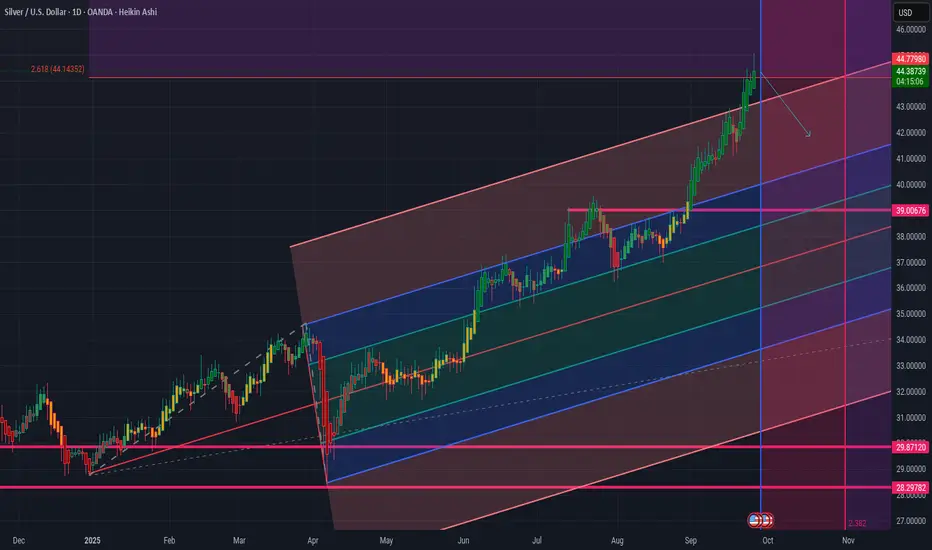
Hitting Fibonacci resistance on the XAGUSD chartAs can be seen in the chart; Fibonacci and Andrews fork are plotted in the same area. After many reactions to the fork ranges, the price has broken out of the fork and hit the Fibonacci resistance. It is likely that the price will return to the fork with this hit and will reject the next price resistances with the help of the fork channels.

XAGUSD reaction to Andrews' forkGiven the high price reactions to the drawn Andrews fork, there is a possibility that the price will return to the fork upon hitting the indicated resistance and follow the path indicated by the arrow.

Xagusd geometric downsideUsing fractals and pitchforks we can see future price targets. This will be hated by many. Its just a chart pattern.

BIRD geometric upsideUsing angles and long dismissed tools we can find opportunity. BIRD at 2.25 is a steal. Targets are rectangles above.

fallin in to the ground coinsfew days ago i published usdt analyses, it went as i think. this up move is going to continue to 4.73%. See my profile other coins analyses how coins drop

DXY Geometric upsideWith the use of Andrew's pitchfork and Gann fan, the pico bottom was preddicted. Both of these tools are overlooked by modern TA.
The bottom is in on the dollar basket for now. 109 is the upside projection which should be delivered at speed.

Grab: Grabbing a RideGrab, often dubbed the "Uber of Southeast Asia," has solidified its position as a leading player in the region's rapidly growing digital economy, making it an exceptionally compelling investment. As of the latest reports, they boast a robust cash reserve of approximately $5.56 billion in cash and short-term investments, representing nearly 30% of its market capitalization. This financial strength provides a significant buffer for both growth initiatives and operational stability. From a financial perspective, Grab has consistently delivered impressive revenue growth, with projections indicating a 17-20% increase in 2024, and a potential acceleration in 2025, driven by its dominant presence in both the ride-hailing and food delivery sectors across eight Southeast Asian nations. Additionally, the company's adjusted EBITDA guidance has been upgraded by 15%, reflecting improving profitability and operational efficiency. Grab's strategic evolution into a super-app, integrating financial services such as digital payments and banking, further diversifies its revenue base, positioning the company as an attractive investment in a region poised for continued digitalization and economic growth.
The company has been strategically managing its finances by increasing its cash reserves and reducing its debt, a move that has positioned it favorably in the competitive ride-hailing and delivery market in Southeast Asia. This financial strategy is evident as Grab has been reported to have decreased its liabilities while bolstering its cash on hand, aiming for greater financial stability and operational flexibility. Simultaneously, Grab's partnership with Uber has been significant; after Uber sold its Southeast Asian operations to Grab in 2018, Uber retained a 25% stake in Grab, which not only facilitated Grab's dominance in the region but also allowed both companies to benefit from shared technology and market insights. This collaboration has been a cornerstone for Grab, enhancing its service offerings and market expansion while maintaining financial health.
$4.50 NASDAQ:GRAB

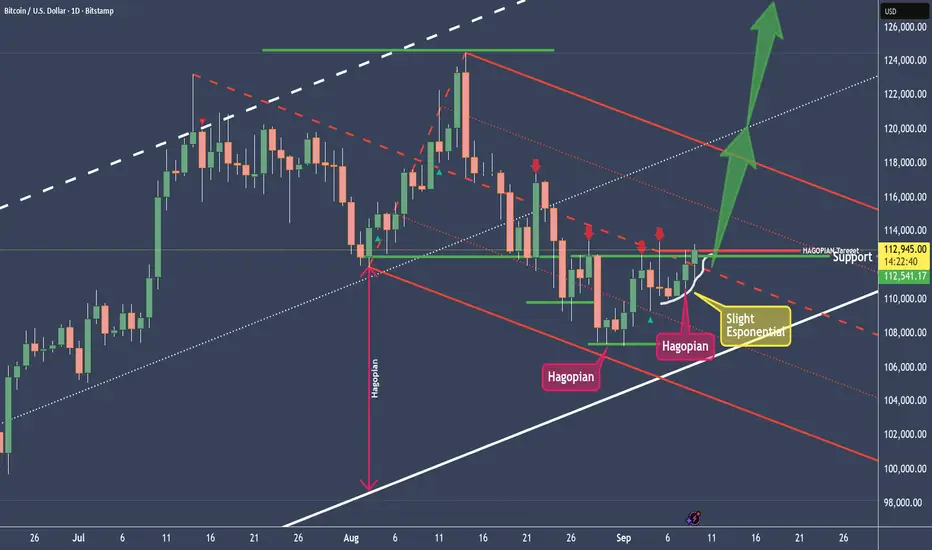
BTCUSD is moving exponential and here's the setupBecause BTCUSD couldn't reach the L-MLH of the red fork twice, we have 2 HAGOPIANs cooking. That means, that price will move further in the opposite direction than from where price came.
Price came from the Centerline, and that's where the high of the today's Candle peeked through. I expect more upside movement.
As for a trade, I want to see price holding above the centerline. From there, PTG1 is the U-MLH and beyond that it's the white Centerline again (...which looks like it's going to the Moon, like XRPUSD).
Of course, we seldom can eat the whole Cake. So we manage it and take partial profits on the way up.
🙏😊✨ Thanks for following and boosting folks. 🙏😊✨
WMT - Our profit target is near, secure some profitsWhen I posted the long trade on Aug. 29th, I did not expect it to run that quick.
Who of you guys or gals pushed it that quick? §8-)
However, I will trail my stop below the last red candles low.
We are not here to win a contest, so we secure some profit, just in case price drops before the Centerline is reached.
Don't forget to follow me and profit from further trades and educational content.
