Christmas ChallengeHowdy everyone
On the top left you can see the rules for trading with Forks.
Your Christmas Challenge:
Which rules apply where on the chart?
Mark the rules in the chart and screenshot it into my Chat:"ForkTrading Method".
Wish you all a super happy Christmas time.
P!
Emilio
Pitchforks

GBP/JPY - Hagopian signal triggered for a rally above 153.41GBP/JPY just triggered a Hagopian signal, which calls for a rally to above 153.41.
I'm sure you are thinking, what is a "Hagopian" signal? A Hagopian signal is triggered, when price doesn't trade to the pitchfork mid-line as it should do 80% of the time according to Dr. Andrew's. This failure is a warning that the decline (in this case) is weak and a opposite price reaction is developing and it will take price above the latest top, which in this case is seen at 153.41.
The trigger for the Hagopian signal, in this case, is when the pitchfork resistance-line is broken, with confirmation, when the resistance at 151.76 is taken out too.
How to trade this Hagopian signal? Buying GBP ag. JPY with the break above 151.76 and placing stop just below support at 151.16 say at 151.05 should be a low risk potentially high reward trade.
The first target to look for is the 153.41 high and above here, will call for a rally to 155.40 as the next minor upside target.
If you want to know more about the Hagopian signal, you can read about it here: technical.traders.com

Daily and Weekly with Median LinesDaily with the +0.25% move up after the test of the lower parallel.
Update of

GBPJPY ... Scan and Pitchfork ... works just as easily on EURUSDToo many traders see harmonic scans as black or white, trade or no trade, winning trade or losing trade. Exact same with forks. Sometimes, they work off each other. If I catch a scan in a fork, great. But THE BEST forks are often drawn AFTER the scan ... as the scan's swings are very significant, and using them to align a fork will almost always give-up pips after the scan is over.

EURUSD 30_minute PitchforkMany traders think pitchforks are used to only identify the trading opportunities inside the fork. While they do that, they also serve as future trade set-ups. Forks are created out of Fibonacci relationships (SH-SL / SL-SH) and thus are Fibonacci-energized. As you can see, S&R that the fork points out, remains AFTER the fork is breached. :)

SNAP dance on the centerline.SNAP is showing a nice example, how the ForkTrading can catch the markets path.
Not only are the Forks a great way to identify the highly potential trend continuation, but also catching the "frequency" of the markets.
Watch this chart closely and observe your thoughts ;-)
Happy new week to all
P!

GBPJPY Harmonic Scan and Pitchfork Tap Into ReversalThe power of Fibonacci n"ver stops. A harmonic scan often generates strong pitchforks due to the level of "Fibonacci-ness" in the primary swing. The advantage of the fork being that it goes beyond what a trend line can do, in that it projects predictive bounces where trend lines cannot yet be drawn. In this instance (and yes, they don't always work ... but then, I only trade them when they do, LOL), the Scan's reversal at D is met by the pitchfork's median. Forks are also great for secondary entries into the channel move, as well as money management.

EURCAD Best-Fit Pitchfork covers move top-to-bottomDrop starts and stops in Best-Fit fork. Additional floor support by Camarilla L3 and 261.8% Fork-Fibo

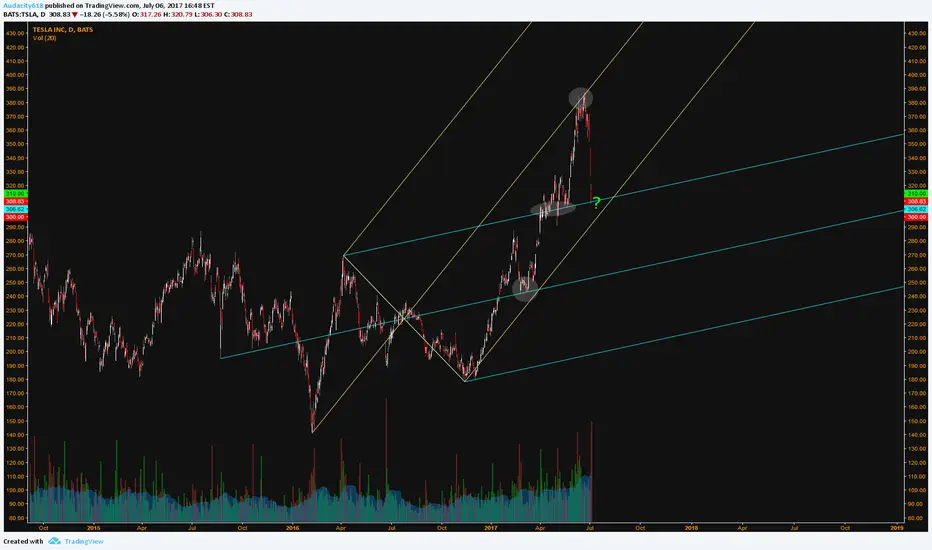
Experiment with different pitchfork pointsHere's a pitchfork on TSLA that has a different point 1 but the same point 2 & 3. Both seem to have resistance and support effect on price action.
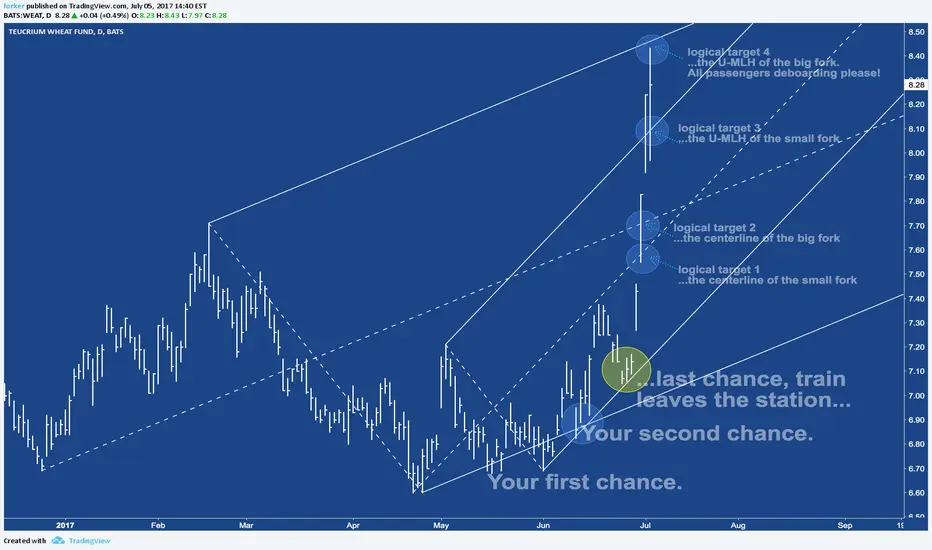
WEAT - This is how ForkTrading works.It's not a question "if" forks work or not.
You better ask: "How can I make them work for me".
Watch the multiple entry points.
Then watch, where you have logical targets.
P!
Platinum & Median LinesBlue Median Line lower parallel test. "Bottom fishing" mode ON . Update of
Informational only, not a recommendation to buy or sell any security.

Best Fit Pitchfork For GoldBest Fit Pitchfork will be good for money management and additional trades ... established based on X-A move of Harmonic Scan

Daily with Median LInes and seasonalitySome levels on watch, seasonality could suggest that a move lower is there to come.
Monitoring support levels and if they hold.

Bitcoin , Andrews Pitchfork & Dragon Analytics
It Never ceases to amaze me how accurate the Andrews Pitchfork is, of the Famous Genius Alan Andrews et al. Take a moment to research this Princeton professor who made all the Kennedy money in the 30's. There is limited information on youtube, etc but I highly recommend MarketGeometry.com run by Mr. Timothy Morge a trading legend and mentor. He has published a wealth of information and should be part of your trading arsenal. Combined with the Dragon Analytics trading methodology, The beast can be tamed.
Beginning in January 2015, when the upward Pitchfork was initiated to the 1st pierce at 1200 in February 2017. The chart speak for itself as the upper line of resistance was pierced this week at 1900.
Check out the older MarketIntelligence charts to see the profits we made via disciplined risk management on the way up and down.
Find out more at Marketintell.net...Good Trading!

USDNOK - Search, ask and you will find...I had not clue about this chart.
So, I was laying back, squeezed my eyes and let it shine on me (...nope, not smoked anything hehe...).
Then it comes together, peace by peace.
Here's how I approach any new analysis.
- Swings & Pivots
- Identify the trend and the flow
- some support & resistance
- action/reaction & forks
- patterns...as far as I can see them (...because I'm a really bad pattern trader)
- fractals
- anything else (...letting creativity flow)
During this process, I delete the whole paintings a couple times.
So this is like Zen to me and hell, I really love what I do §8-)
Let's see if YOU can make something out of this.
Please do me this little favor and let me know if you go long or short.
P!

The Grand PitchforkA weekly chart and pitchfork using Black Monday as a starting point and the Dot-com Bubble/Bust as the top and bottom. You'll notice a lot of support levels created with this long term time frame (notes on chart). My favorite is the median line rejection just before the 2008 financial crisis.
I've also found an indicator that has worked twice in the last two crash that can help signal the next big bear market. Using the difference between the 1 week and 200 weekly moving average, a trend line is formed while climbing into the bull market. If that trend line breaks down, the bear market has begun. As you can see, we have not broken our trend line yet, but this indicator should leave plenty of time to withdraw.
