USDHCF I Weekly CLS Range I Model 1 Hi friends, new range created. As always we are looking for the manipulation in to the key level around the range. Don't forget confirmation switch from manipulation phase to the distribution phase to make the setup valid. Stay patient and enter only after change in order flow. If price reaches 50% of the range take partial or full close. 👊 Your ultimate goal as a trader is not to be a generalist who knows 100 patterns. But rather create one system with narrowed criteria of each element of the trade to remove subjective and emotional decisions as much as possible and stick to this system no matter what. Practice it everyday become a MASTER.
I promised myself I’d become the person I once needed the most as a beginner. Below are links to a powerful lessons I shared on Tradingview. Hope it can help you avoid years of trial and error I went thru.
📊 Sharpen your trading Strategy
⚙️ 100% Mechanical System - Complete Strategy
🔁 Daily Bias – Continuation
🔄 Daily Bias – Reversal
🧱 Key Level – Order Block
📉 How to Buy Lows and Sell Highs
🎯 Dealing Range – Enter on pullbacks
💧 Liquidity – Basics to understand
🕒 Timeframe Alignments
🚫 Market Narratives – Avoid traps
🐢 Turtle Soup Master – High reward method
🧘 How to stop overcomplicating trading
🕰️ Day Trading Cheat Code – Sessions
🇬🇧 London Session Trading
🔍 SMT Divergence – Secret Smart Money signal
📐 Standard Deviations – Predict future targets
🎣 Stop Hunt Trading
💧 Liquidity Sweep Mastery
🔪 Asia Session Setups
🧠 Level Up your Mindset
🛕 Monk Mode – Transition from 9–5 to full-time trading
⚠️ Trading Enemies – Habits that destroy success
🔄 Trader’s Routine – Build discipline daily
💪 Get Funded - $20 000 Monthly Plan
🧪 Winning Trading Plan
🛡️ Risk Management
🏦 Risk Management for Prop Trading
📏 Risk in % or Fixed Position Size
🔐 Risk Per Trade – Keep consistency
Adapt useful, Reject useless and add what is specifically yours.
David Perk
Pivot Points

Induslnd Bank Bullish viewLogic: Indusind bank being in uptrend, there are 2 possible scenarios that can occur.
Scenario 1: If price retraces to the demand zone formed at 870 levels a long opportunity can be seen as the zone is in line with 21 DEMA.
Scenario 2: If the price breaks the previous day high, or gaps up above the previous day high, the entry can be made at previous day high and stop loss at or below the previous day low.
A target of 1:3 can be kept.

Manappuram Bullish viewLogic: Mannappuram Finance is near the all time high level with no obstructing levels or a supply on top.
Since the stock has just made a break out from a consolidation area the demand zone formed on the 298 levels are coinciding with 21DEMA and 50 DEMA.
A price retracement to the zone can be a better opportunity.

Btc setupBtc keep on up trend and reputable price movement
Now it's on premium after breaking out premium swing high
Equilibrium is 90897 this level also structure .
Tps 93734 above liquidity area
Sl 89917 below 50 ema

BTCUSDT: Trend in 4-H time frameThe color levels are very accurate levels of support and resistance in different time frames.
A strong move requires a correction to major support and we have to wait for their reaction in these areas.
So, Please pay special attention to the three accurate trend, colored levels, and you must know that SETUP is very sensitive.
BEST,
MT

Nifty Analysis EOD – January 5, 2026 – Monday🟢 Nifty Analysis EOD – January 5, 2026 – Monday 🔴
Bears Strike Back: 26,375 Rejection Triggers 140-Point Breakdown.
🗞 Nifty Summary
Nifty started the session on a flat note but immediately witnessed an early slip of 95 points, finding initial support at the 26,275 level.
A strong recovery followed, briefly shifting sentiment to bullish as the index breached the day’s high. However, the 26,375 resistance zone proved to be a formidable ceiling, gradually pushing prices back into the Initial Balance (IB).
The afternoon session was marked by extreme volatility; around 2 PM, an IBL breakdown was attempted, but the CPR BC support triggered a sharp “false breakout” spike back into the IB.
Ultimately, the bears regained control, dragging the index down nearly 140 points from the peak. Nifty concluded the day 34 points above the low but a significant 90 points below the PDC, marking a clear bearish victory after a day of intense tug-of-war.
🛡 5 Min Intraday Chart with Levels
🛡 Intraday Walk
The session was a masterclass in market “drama.” The first hour saw high-velocity swings of 100 points, exhausting both early bulls and bears.
The mid-session sideways grind lured traders into a false sense of security before the 140-point breakdown commenced. The most critical technical event was the 2 PM IBL break; while the CPR provided a temporary floor, the inability of bulls to sustain the recovery confirmed that supply was overwhelming demand.
Bears successfully shifted the battlefield lower, ending the day with a dominant stance.
📉 Daily Time Frame Chart with Intraday Levels
🕯 Daily Candle Breakdown
Open: 26,315.40
High: 26,378.20
Low: 26,238.50
Close: 26,272.15
Change: −43.25 (−0.16%)
🏗️ Structure Breakdown
Type: Bearish Rejection Candle
Range (High–Low): ≈ 140 points → High intraday volatility
Body: ≈ 43 points → Moderate bearish close
Upper Wick: ≈ 63 points → Strong rejection from the 26,375 resistance zone
Lower Wick: ≈ 34 points → Some late buying interest from the day’s lows
📚 Interpretation
The long upper shadow is the defining feature of today’s candle, confirming heavy supply at higher altitudes. While the market attempted a bullish extension, the failure to hold above the IBH suggests a lack of follow-through conviction. The close near the lower third of the range indicates that momentum has shifted in favour of the bears for the short term.
🕯 Candle Type
Bearish Candle with both Side wicks
(Signals potential reversal or cooling of bullish momentum; the breach of today’s low will confirm further downside.)
🛡 5 Min Intraday Chart
⚔️ Gladiator Strategy Update
ATR: 170.93
IB Range: 94.65 → Medium
Market Structure: Balanced
Trade Highlights:
13:59 Short Trade: Trailing Exit (1:0.93) (IBL Breakout)
Trade Summary: The system successfully identified the IBL breakdown at 13:59. However, the subsequent interaction with the CPR support zone created a volatile “whipsaw” environment. A trailing stop was utilized to protect capital, resulting in a near 1:1 exit as the market entered its late-day “drama” phase.
🧱 Support & Resistance Levels
Resistance Zones:
26277
26320
26375 (Major Supply Wall)
Support Zones:
26235 ~ 26210 (Immediate Floor)
26155
26104
🧠 Final Thoughts
“The bulls have lost the immediate high ground.”
After today’s rejection at 26,375, the short-term bias has tilted toward the bears. For the upcoming session, the 26,235 ~ 26,210 zone is the final line of defense for the bulls. If this floor gives way, we could see a swift test of 26,155. Bulls need a decisive gap-up or a strong reclamation of today’s IBH to regain their footing.
✏️ Disclaimer
This is just my personal viewpoint. Always consult your financial advisor before taking any action.

Is Gold ready to drop yet?I see XAUUSD inside the bottom half of that daily FVG. If things continue, it should be coming down pretty far. First stop 4250.

XRP grabbing liquidity and back down!I believe XRP will hit the yearly pivot point around 2.36 also hitting the 233 EMA AND sweeping the liquidity from the Nov. 24th run up. There's bigger fish to fry at lower levels.

XRP Macro analysis | The bigger picture | Long-term holdersCRYPTOCAP:XRP
🎯 Wave 4 appears to have completed an expanded flat correction defined by the poke above the all-time high. Price found support at the weekly pivot, just above the weekly 200EMA and High Volume Node, keeping trend signals bullish. Wave 5 has a target of the R3 weekly pivot $5.7.
📈 Weekly RSI has printed bullish divergence.
👉 Analysis is invalidated if we fall below $1.5, keeping wave 4 alive.
Safe trading

SUI Macro analysis | The bigger picture | Long-term holdersCRYPTOCAP:SUI
🎯 Price appears to have completed a shallow wave (B) correction at the S1 weekly pivot and 0.5 Fibonacci retracement. The chart is clean. Wave (C) has a terminal target os the R3 weekly pivot at $10.38 but could also over extend in the right conditions towards the R5, $15.
📈 Price is below the weekly pivot, and there is no 200EMA yet on this young asset. Weekly RSI is ticking bullish near oversold with no divergence.
👉 Analysis is invalidated below wave (B) at $1.3
Safe trading

SOL Macro analysis | The bigger picture | Long-term holdersCRYPTOCAP:SOL
🎯 Sol has been holding up significantly well with only a shallow retracement to the 0.382 for wave A of 4. A running flat correction appears complete at the Fibbonaci 0.236, weekly 200EMA and High Volume Node. Wave 5 has a target of the R3 weekly pivot at $462, but I expect this to overextend due to the shallow pullback to the R% pivot at $660.
📈 Price is above the weekly 200EMA, which is bullish, but below the pivot, which is bearish, giving the overall pattern ambiguity. Weekly RSI is bearish with room to fall, but doesn’t often reach oversold.
👉 Analysis is invalidated if price falls below wave A, $90
Safe trading

ONDO Macro analysis | The bigger picture | Long-term holdersLSE:ONDO
🎯 Wave 2 appears complete at the altCoin golden pocket, 0.786 Fibonacci retracement and High Volume Node support. Price is reacting well with a bullish engulfing candle. Wave 3 has an expected target in price discovery os the R£ weekly pivot $4.21, offering a 10x from here.
📈 Weekly RSI hit oversold threshold and ticked up bullishly.
👉 Analysis is invalidated below $0.35
Safe trading

ETH Macro analysis | The bigger picture | Long-term holdersCRYPTOCAP:ETH
🎯 Wave (IV) appears to have completed a multiyear running flat with weekly bullish divergence. A new motif wave is underway, completing its wave 1 of 5 with a poke above all time high on weekly bearish divergence. Wave 2 appears complete at the 0.5 Fibonacci retracement and High Volume Node support. Wave 3 has a target of the R4 weekly pivot at $7348. Wave 5 could extend towards $10,000.
📈 The retracement has been shallow compared to other alts. Weekly RSI is flipping bullish from below the EQ while price is about to challenge the weekly pivot. Price is above the weekly 200EMA, keeping the bullish trend in tact.
👉 Analysis is invalidated only if we get below$2634, keeping wave 2 alive.
Safe trading

HBAR Macro analysis | The bigger picture | Long-term holdersCRYPTOCAP:HBAR
🎯 Price has printed a textbook ABC for wave 2, now the weekly bullish divergence in the RSI. The bottom may be in with last week’s bullish engulfing candle at the Fibonacci golden pocket, the most likely termination for wave 2. Wave 3 has an expected target of the R3 weekly pivot $0.77.
📈 Price is below the weekly pivot, and there is still no 200EMA so there is still a chance for further downside with a target of the alt-coin golden pocket, 0.786 Fibonacci retracement, S1 pivot and High Volume Node support, $0.75.
👉 Bullish analysis is invalidated below $0.95, keeping wave 2 alive.
Safe trading

DOGE Macro analysis | The bigger picture | Long-term holdersCRYPTOCAP:DOGE
🎯 Uptrend remains intact from the multiyear wave 4 running flat bottom. We could still be in wave 4, as characterised by their long, complex ranges with shallow retracement 0.236 Fibs in this case. The initial upside resistance is the weekly pivot at $0.29, and macro wave 5 has a terminal target off a poke above all-time high at $0.76.
📈 Weekly RSI has printed bullish divergence as price tests the weekly 200EMA. Overcoming this is the first challenge and will add confluence to a bullish move.
👉 Analysis is invalidated below wave 4 and the S1 pivot, $0.0986
Safe trading

BTC Macro analysis | The bigger picture | Long-term holdersCRYPTOCAP:BTC
🎯 Price remains in a shallow corrective phase, similar to previous price behaviour. Bitcoin remains up 420% since the 2023 bottom, and sentiment has never been this low for this long. Weekly RSI has now printed bullish divergence and tapped the weekly pivot, a strong bottoming signal. Wave 4 appears complete, wave 5 has a target of the weekly R4 pivot at $233000.
📈 Price is above the weekly 200EMA and pivot, demonstrating the bullish trend is intact. Weekly RSI bearish divergence has played out. Bitcoin RSI does not often reach oversold on the weekly.
👉 Analysis is invalidated below the weekly 200EMA, $73000
Safe trading

BNB Macro analysis | The bigger picture | Long-term holdersCRYPTOCAP:BNB
🎯 Price completed a macro wave 3 with bearish divergence on the RSI. Wave 4 is expected to end at the 0.382 Fibonacci $640, and can not extend below the 0.5 Fib, $506. Crypto assets can overextend in wave 5, which I believe we will see in 2026, with a terminal target of the R5 weekly pivot target, $2000, a psychological milestone where heaving selling may begin.
📈 Wave 4 is still underway, testing the previous all-time High Volume Node, 0.236 Fibonacci retracement, $760. Weekly RSI is at the EQ, where a bottom was found the previous two times and the price returned to an all-time high.
👉 Analysis is only invalidated if price falls below the 0.5 Fib, $506.
Safe trading

AAVE - Macro analysis | The bigger picture | Long-term holdersEURONEXT:AAVE
🎯 I am still looking at this multiyear triangle to break out to the upside with a terminal target of $670, the all-time High Volume Node resistance. Price is rangebound between $440 and $130 and appears to have completed triangle wave (C). Wave (D) is next, with a target of the upper boundary trend-line ~$340.
📈 Price is below the weekly 200EMA and pivot, reflecting the recent bearish trend, but finding support with bullish divergence in the RSI, suggesting a major bottom is forming. Wave (A) found terminal support at the golden pocket Fibonacci retracement.
👉 Analysis is invalidated below wave (A) or wave (B). This asset has been one of the best assets for trading signals in the last 3 years, sticking to the rules strictly.
Safe trading

Bitcoin Stuck in a Holiday Range — CME Gap Below?During the Christmas period, Bitcoin ( BINANCE:BTCUSDT ) didn’t exhibit strong momentum and has been moving within a range.
Bitcoin is currently near the resistance zone($90,960-$90,090) and the Cumulative Short Liquidation Leverage($91,840-$90,920).
From an Elliott Wave perspective, it appears that Bitcoin has completed the Double Three Correction(WXY).
I expect that given the weekend and generally lower trading volume at this time, Bitcoin may struggle to break the resistance zone($90,960-$90,090) and could begin to decline, potentially filling the CME Gap($88,720-$88,120). If BTC breaks the support lines, we can expect further declines to the support zone($87,050-$86,420).
Note: Additionally, two important trading levels to watch for Bitcoin are $90,300 and $87,830.
What are your thoughts? Do you think Bitcoin will continue its trend into 2026, or should we prepare for a correction? I’d love to hear your opinion!
Cumulative Long Liquidation Leverage: $87,110-$86,020
First Target: Support lines
Second Target: Support zone($87,050-$86,420)
Stop Loss(SL): $91,880
Points may shift as the market evolves
💡 Please respect each other's opinions and express agreement or disagreement politely.
📌Bitcoin Analysis (BTCUSDT), 1-hour time frame.
🛑 Always set a Stop Loss(SL) for every position you open.
✅ This is just my idea; I’d love to see your thoughts too!
🔥 If you find it helpful, please BOOST this post and share it with your friends.

IndusInd Bank: Tight Range → Trend Expansion SetupIndusInd Bank is a leading private sector bank in India with a diversified portfolio spanning retail banking, vehicle finance, MSME, corporate lending, and treasury operations. The bank has steadily focused on strengthening its balance sheet, improving asset quality, and maintaining adequate capital buffers.
📊 Key Fundamental Metrics & Ratios
Market Capitalization: Mid-to-large cap private bank
Valuation (P/E & P/B): Near historical averages, suggesting fair valuation
Return on Equity (ROE): Healthy double-digit range, indicating improving profitability
Return on Assets (ROA): Around industry average, reflecting operational efficiency
Net Interest Margin (NIM): Stable, supported by a strong retail and vehicle finance mix
Asset Quality: GNPA and NNPA show a gradual improvement trend
Capital Adequacy (CAR): Well above regulatory requirements
🔎 Fundamental View:
IndusInd Bank appears fundamentally stable with improving asset quality and reasonable valuations, making it suitable for swing and positional trading setups when technical confirmation emerges.
Technical Analysis
🔍 Price Structure
The stock formed a Tight Range Contraction (TRC) after a strong prior uptrend.
Multiple contraction swings indicated supply absorption and reduced volatility.
A decisive breakout above the consolidation zone signals trend continuation.
📌 Important Levels
Support/Reversal Zone: ₹861 – ₹886
(Bullish structure remains valid above this zone.)
Current Price Zone: Around ₹900
Upside Resistance Targets:
R1: ₹920
R2: ₹945
R3: ₹988
Disclaimer: aliceblueonline.com/legal-documentation/disclaimer/

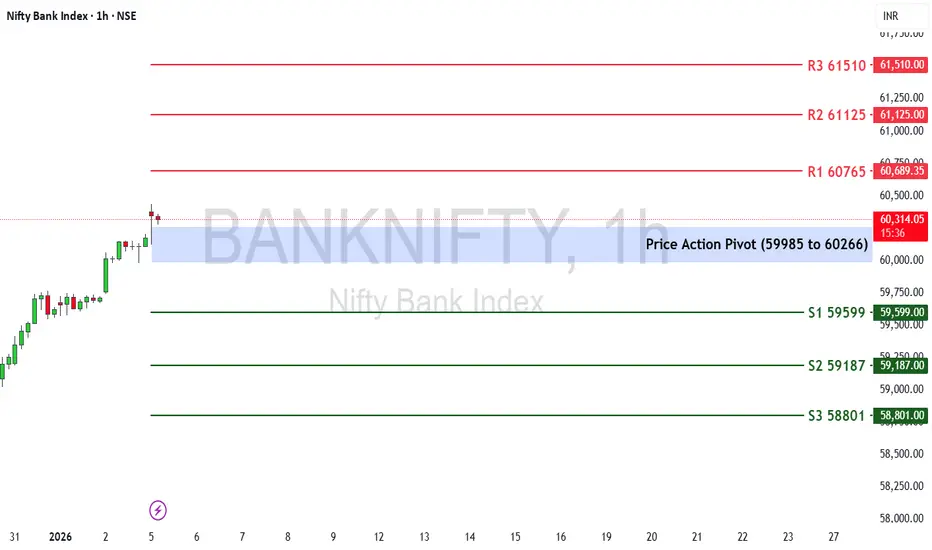
Bank Nifty Weekly Outlook (5th Jan – 9th Jan 2026)The Nifty Bank Index ended the previous week at 60,150.95, registering a strong gain of +1.93%. The index has moved back into a crucial price action pivot zone, making the upcoming week extremely important for directional clarity.
🔹 Key Levels for the Upcoming Week
📌 Price Action Pivot Zone (59,985–60,266)
This blue-shaded zone represents the primary weekly decision area.
Sustaining above 60,266 can keep bullish momentum intact.
Failure to hold below 59,985 may invite short-term selling pressure.
🔻 Support Levels
S1: 59,599
S2: 59,187
S3: 58,801
These levels may act as buy-on-dips zones as long as the broader trend remains positive.
🔺 Resistance Levels
R1: 60,765
R2: 61,125
R3: 61,510
These zones are likely to witness profit booking or supply pressure on upward moves.
📈 Market Outlook
✅ Bullish Scenario:
If Bank Nifty sustains above the Price Action Pivot Zone (59,985–60,266), the index may move toward R1 at 60,765.
A strong breakout above this level could extend the rally toward R2 at 61,125, and continued strength may push the index toward R3 at 61,510 in the coming weeks.
❌ Bearish Scenario:
If the index fails to hold the pivot zone and slips below 59,985, short-term weakness could drag prices toward S1 at 59,599.
Further selling pressure may test S2 at 59,187 and S3 at 58,801. A weekly close below 58,801 would indicate a deeper corrective phase.
Disclaimer: aliceblueonline.com/legal-documentation/disclaimer/
Nifty 50 Weekly Outlook ( 5th Jan – 9th Jan 2026)The Nifty 50 Index ended the previous week around 26,328, maintaining its bullish structure after a strong upward move. The index is currently trading inside a crucial price action pivot zone, which will play a decisive role in determining the next directional move.
🔹 Key Levels for the Upcoming Week
📌 Price Action Pivot Zone (26,280–26,357)
This blue-shaded zone represents the primary decision-making area for the market.
Sustaining above 26,357 can fuel further upside momentum.
Failure to hold below 26,280 may trigger short-term profit booking.
🔻 Support Levels
Support 1 (S1): 26,140
Support 2 (S2): 25,970
Support 3 (S3): 25,839
These supports can act as buy-on-dips zones as long as the broader trend remains positive.
🔺 Resistance Levels
Resistance 1 (R1): 26,507
Resistance 2 (R2): 26,661
Resistance 3 (R3): 26,777
These levels are likely to witness supply pressure or profit booking on upward moves.
📈 Market Outlook
✅ Bullish Scenario
If Nifty sustains above the Price Action Pivot Zone (26,280–26,357), the index may advance toward:
R1: 26,507
A strong breakout above R1 could extend the rally toward:
R2: 26,661
R3: 26,777
❌ Bearish Scenario
If the index breaks and sustains below 26,280, short-term weakness may emerge, dragging Nifty toward:
S1: 26,140
Further breakdown could extend the decline toward:
S2: 25,970
S3: 25,839
📌 Conclusion
The 26,280–26,357 price action pivot zone remains the make-or-break level for the coming week. Traders should closely observe price behavior around this zone for clear directional confirmation before initiating fresh positions.
Disclaimer: aliceblueonline.com/legal-documentation/disclaimer/

AUDCAD - HTF Bullish | Engineered Pullback | Speculation PhaseBias: Bullish (Higher Timeframe)
Model: Accumulation → Expansion → Distribution → Manipulation → Correction → Delivery
State: Speculation / Tracking
Execution: Conditional
⸻
Higher Timeframe Context
AUDCAD remains bullish on the higher timeframe, keeping the expectation for continuation valid.
⸻
Mid-Term Structure & Liquidity
Price first swept mid-term inducement, then mitigated into a mid-term order block, ultimately rotating into the orange HTF order block located on the left side of the chart.
From that zone:
• Accumulation began to form
• Buyers stepped in
• Price delivered a clean expansion
⸻
Market Cycle Behavior
Following expansion, price transitioned into a distribution phase, accompanied by manipulative behavior.
At this stage, I’m waiting for price to:
• Exhaust the manipulation
• Sweep internal liquidity
• Potentially clear external liquidity
• Rotate back into the accumulation area
This aligns with how the market often engineers continuation within a bullish structure.
⸻
Forward Expectation
If price returns into accumulation and holds:
• I’ll be looking for a corrective phase
• Followed by delivery in line with the HTF bullish bias
Execution will depend on confirmation, not assumption.
⸻
Mindset
This remains speculation mode.
Patience is the key.
Tracking is the edge.
Structure engineers the move.
Until price confirms, we stay patient and let the market do the work.
Let’s go. 📈🔥
