APT is Bearish (4H)It has a bearish structure. We have an iCH (liquidity grab / mitigation) on the chart, the overall power is bearish, and price is trading below a resistance line. Recently, a base has also broken to the downside, and all signs indicate a bearish outlook.
We can enter a sell/short position once the stop-loss (invalidation level) is tapped, targeting the levels marked on the chart.
Do not enter the position without capital management and stop setting
Comment if you have any questions
thank you
Pivot Points

CRUDE OIL (WTI): Bullish Move After Trap
There is a high chance that Crude Oil will pull back
from the underlined daily key level.
I see a confirmed bear trap followed by a bullish imbalance
candle on an hourly.
I expect a rise at least to 58.51 level.
❤️Please, support my work with like, thank you!❤️
I am part of Trade Nation's Influencer program and receive a monthly fee for using their TradingView charts in my analysis.

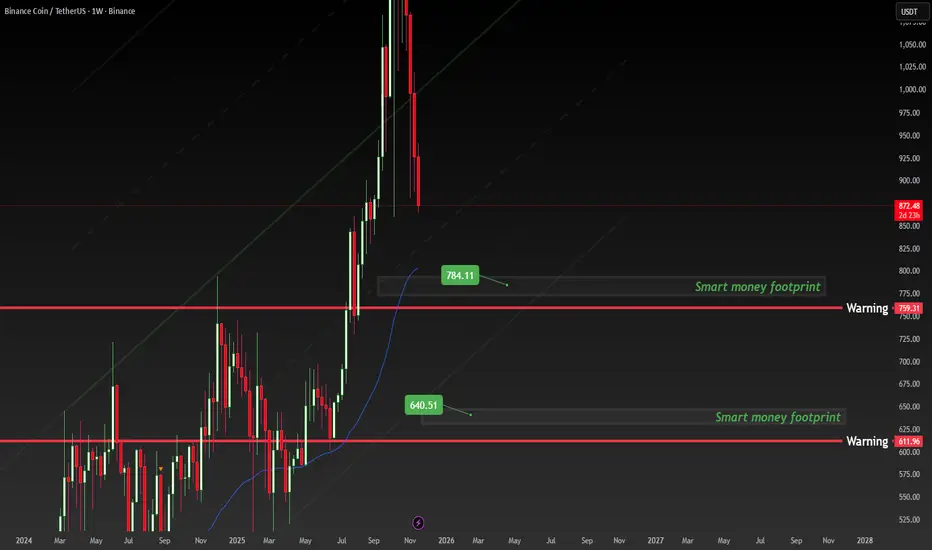
BNB ABOUT TO EXPLODE 300%BNB ABOUT TO EXPLODE 300%?! Smart Money Already Loading at $784 & $640 – Don’t Miss the Next Leg Up! 🚀
This is the EXACT footprint I’ve been waiting for on BNB/USDT weekly timeframe!
Smart money accumulated heavily at $640 and now defending the $784 zone like their life depends on it. Exactly the same pattern that launched us from $17 → $690 in 2021. History is literally repeating in front of our eyes!
Every time BNB holds these “Smart Money Footprint” levels, we see minimum 3-5x moves. The weekly chart is screaming “accumulation phase over” – next stop $2,000+ in this cycle!
Who else is stacking BNB right now? 👇
Tag your crew and let’s make this moon together!
Shoutout to the BNB gods on TradingView:
@CryptoCred @CryptoWolfSignal @TheCryptoDog @Trader_XO @DonAlt @CryptoNewton @WiseAnalyze @Alanmasters – what do you guys think, is $2,000 incoming this cycle? 👀
Drop a 🚀 if you’re loading BNB under $800
Save this chart – you’ll thank me at $2,000+
#BNB #BinanceCoin #Crypto #Altseason #1000x
AUD/JPY: Exhaustion at The High?AUD/JPY briefly traded at a 16-month high on Thursday before reversing lower. At current levels it’s on track to form a spinning-top doji on the weekly chart, and it has already printed a shooting-star candle on the daily at the November high and monthly S1 pivot.
Given the multi-week bearish RSI divergence and false breakout at the highs, the bias is for some mean reversion towards at least the 20-day EMA. The 100 handle and 50-day EMA near the January high also make viable downside targets for bears, should the yen enjoy a bout of risk-on strength.
Matt Simpson, Market Analyst at City Index.

Ethereum Falls Under $2,800 — A 44% Drawdown From the Highs📉 Ethereum ( BINANCE:ETHUSDT ) has officially broken below the $2,800 level, a major structural zone that has acted as both strong support and resistance in multiple past cycles.
🔻 The drop now totals -44% from the all-time highs, pushing price back into an area where long-term buyers previously stepped in aggressively.
📊 The weekly RSI sits near 40, historically a region that has offered short-term relief and attractive asymmetric setups.
🧭 From a risk-reward standpoint, this remains an interesting zone for gradual accumulation, especially as sentiment turns increasingly bearish.
💡 In markets, the best opportunities tend to appear when nobody wants the asset.

$BTC spot planBuying Bitcoin in purple box. Think 86k area will act as a good support. This is not a leverage trade. I am buying this spot so I can adjust my stoploss later if I want to.


MSTR chart update. Bounce to $266-315 before more downside?Updating the prior chart as the levels I had were off. I think it's likely that we bounce from this level.
You can see we've now hit a key support and filled a gap that was on the chart at $176. I think it's likely that we see a strong bounce from this level.
Reasons being:
1. We're at a key support
2. 3 touches of bottom of flag, usually 4th one breaks it, 3rd creates a powerful move in the opposite direction
3. Strong call flow on MSTR the past few days
I think it's likely we bounce up to the $266 or 315 resistance levels. This is a trade, not a long term position to hold.
Let's see if it plays out. Breaking this level as lower support will open up the possibility to see lower levels.

VRAUSDT: Trend in weekly time frameThe color levels are very accurate levels of support and resistance in different time frames, and we have to wait for their reaction in these areas.
So, Please pay special attention to the very accurate trend, colored levels, and you must know that SETUP is very sensitive.
Be careful
BEST
MT

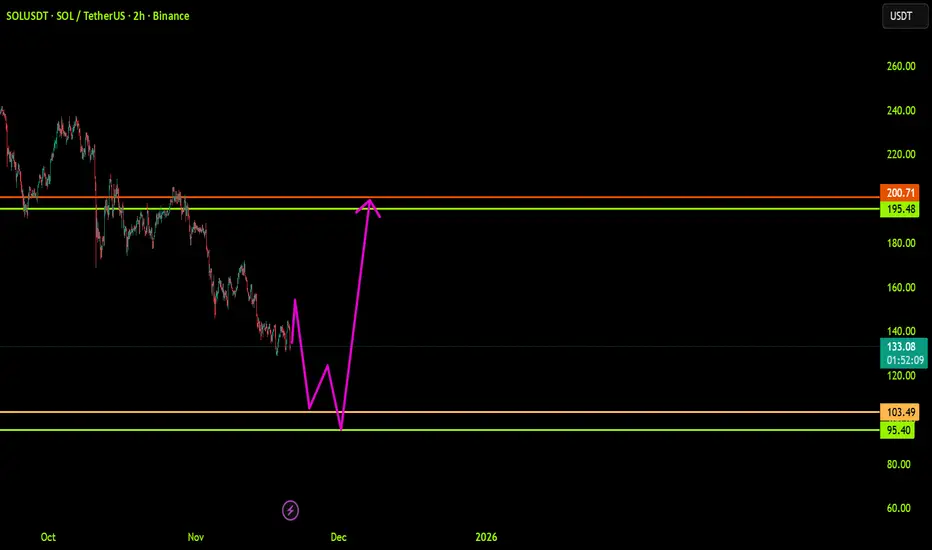
SOLUSDT: Trend in 2-H time frameThe color levels are very accurate levels of support and resistance in different time frames.
A strong move requires a correction to major support and we have to wait for their reaction in these areas.
So, Please pay special attention to the accurate trends, colored levels, and you must know that SETUP is very sensitive.
BEST,
MT
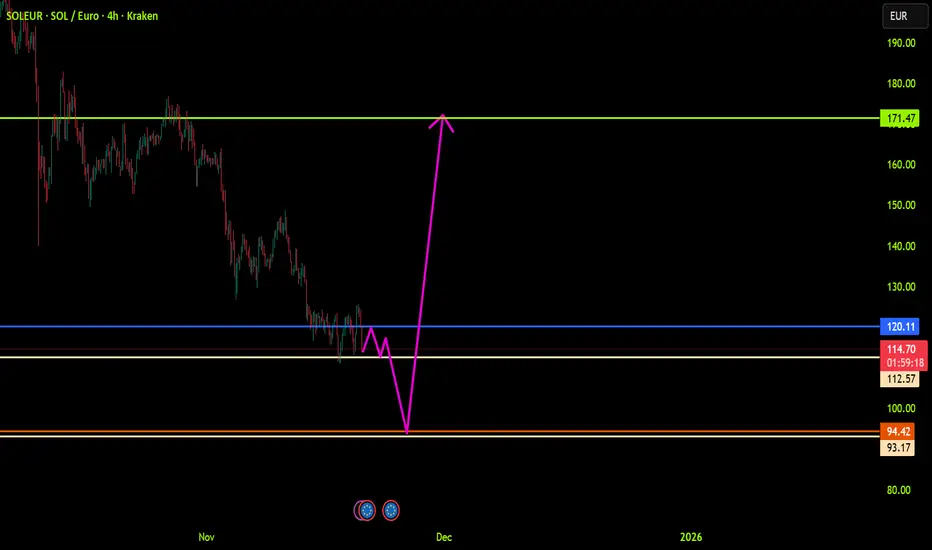
SOLEUR: Trend in 4-H time frameThe color levels are very accurate levels of support and resistance in different time frames.
A strong move requires a correction to major support and we have to wait for their reaction in these areas.
So, Please pay special attention to the accurate trends, colored levels, and you must know that SETUP is very sensitive.
BEST,
MT
BtcusdtI think Bitcoin will bounce from the 77-80K range and touch a new high in the 140K range.
If the 77K range breaks downwards, we should wait for the 60K range.

BITCOIN ON MOUNTLYHello everyone,
I’ve been reviewing Bitcoin on the monthly timeframe and analyzing its local lows, and the results turned out to be quite interesting. Since the major correction in December 2017, Bitcoin has shown recurring corrective structures on this timeframe. When measuring the drawdowns from cycle tops, we typically see corrections in the 70–80% range. Also, before each major downturn, the price tends to form two local lows, with the second one usually providing traders a final opportunity to exit.
This year, based on both historical behaviour and current market dynamics, we’re seeing a similar pattern develop. Considering these factors, I expect the market to remain bearish for at least the next nine months. I see the current potential bottom near $58,800, and if this level breaks, the maximum correction could bring Bitcoin down into the $29–33K range.
On the upside, the $93–102K zone remains, in my view, the most favorable range for exiting the market.
Wishing you all success.

$ZEN Long planAfter my previous LSE:ZEN post where I shared that $16.40 flip is key for ZEN if it wants to go higher. Which failed on 4h tmf to stay above the price. Now again its interesting for me. In a hour if we get the daily close above the purple line $16.40 area, where we get a retest I will go long.


SPX 500: Bullish Rebound to 6760?FX:SPX500 is priming for a bullish rebound on the 4-hour chart , where price has pulled back to a critical support zone following a sharp decline, forming a potential bounce setup amid a broader uptrend—highlighted by the rebound pattern near key levels that could ignite buying if buyers defend against further downside. This confluence at the support offers a high-reward long opportunity in the index's volatile range.
Entry zone between 6530-6550 for a buy position. Target at 6760 🎯near the resistance zone, delivering a risk-reward ratio greater than 1:4 .Set a stop loss on a close below 6500 📊 to manage risk effectively. Watch for confirmation via a strong bullish candle with rising volume above the entry, capitalizing on the index's resilience despite recent pressures🌟.
Fundamentally , the S&P 500 closed at around 6646.7 on November 19, 2025, down over 2% in November amid economic concerns and high valuations, particularly in AI stocks, with the index dipping below its 50-day moving average for the first time since April—yet historical patterns suggest a median 15% upside to 7710 over the next year if it follows median rebounds. Earnings growth remains robust at 16.9% YoY, beating estimates, supporting potential recovery despite tariff worries. 💡
📝 Trade Setup
🎯 Entry Zone (Buy): 6530 – 6550
🎯 Target:
• TP: 6760 (major resistance)
❌ Stop Loss: Close below 6500
⚖️ Risk-to-Reward: Greater than 1:4
What's your outlook on this rebound? Drop your thoughts below! 👇

Nifty Analysis EOD – November 20, 2025 – Thursday🟢 Nifty Analysis EOD – November 20, 2025 – Thursday 🔴
Bullish Extension Continues, Nifty Just 29 Points Away from All-Time High!
🗞 Nifty Summary
The Nifty opened with an 83-point Gap Up, confidently trading above the Previous Day’s High (PDH). The initial few minutes saw the gap fill, finding solid support exactly at the PDH level.
The index then consolidated for about 90 minutes near the CDH + IBH, forming a narrow 20-25 point range. Following this pause, Nifty resumed its upward march with steady “baby steps,” successfully breaching the crucial 26220 resistance level and marking the day’s high at 26,246.65. Although unable to sustain above 26220, leading to a sharp, volatile slip back, the index closed strongly at 26,192.15, adding +139.50 points (+0.54%) from the previous day’s close.
This was a clear bullish extension day, achieving the targets aimed for yesterday, though the lack of participation from small-cap and mid-cap segments remains a point of caution. We are now merely 29 points away from marking a new All-Time High (ATH).
🛡 5 Min Intraday Chart with Levels
🛡 Intraday Walk
The session was defined by an initial deep gap-up, followed by the gap-fill and strong defense of the PDH, confirming the bullish bias.
The mid-session consolidation was a low-volume affair, acting as a spring for the second leg of the upward rally.
The move through 26220 was aggressive, but the quick rejection from the high indicated strong supply at the historical peak levels.
The final closing level, however, remains robust, signaling that overall control is with the buyers, and the primary objective is the ATH.
📉 Daily Time Frame Chart with Intraday Levels
🕯 Daily Candle Breakdown
Open: 26,132.10
High: 26,246.65
Low: 26,063.20
Close: 26,192.15
Change: +139.50 (+0.54%)
🏗️ Structure Breakdown
Type: Bullish candle.
Range (High–Low): ≈ 183 points — healthy, broad intraday movement.
Body: ≈ 60 points — showing controlled but steady bullish strength.
Upper Wick: ≈ 54 points — indicating profit-booking or resistance near the 26220 high.
Lower Wick: ≈ 69 points — strong buying from lower levels, confirming demand on dips.
📚 Interpretation
The strong opening and consistent follow-through buying throughout the day confirm the prevailing bullish trend. Although the upper wick is substantial, reflecting the failure to sustain the breakout above 26220, the close is well above the open and previous major resistance levels. This indicates that while bears defended the immediate high, they were unable to shift the overall market structure.
🕯 Candle Type
Bullish Candle with Both-Side Wicks (Buyers Dominant) — This is a strong continuation signal, confirming the control of the bulls despite minor overhead resistance.
🛡 5 Min Intraday Chart
⚔️ Gladiator Strategy Update
ATR: 196.67
IB Range: 72.8 → Medium
Market Structure: ImBalanced
Trade Highlights:
10:05 Long Trade - Target Hit (R:R 1:3.13)
12:24 Long Trade - Target Hit (R:R 1:3.96)
Trade Summary: The strategy performed exceptionally well today, capitalising on the clear directional moves after the initial range-bound phase. The two high R:R long trades captured the core bullish extension of the day.
🧱 Support & Resistance Levels
Resistance Zones:
26220 (Immediate Resistance)
26277 (All-Time High)
Support Zones:
26135 (Gap Fill Zone)
26104 ~ 26075 (Critical Intraday Support)
26063 ~ 26040
26000 (Psychological Support)
25950 ~ 25940
🧠 Final Thoughts
“The final frontier is 26,277.”
The market is in clear bullish territory, with all major resistance levels below 26220 successfully converted into support. The primary focus for the next session is the All-Time High at 26,277.
A decisive breach and close above this level will trigger strong momentum. If the market fails to breach the ATH, we may see a slight correction toward the 26135 support zone before the next attempt.
Traders must remain mindful that non-participation from the broader market (mid/small-caps) could eventually lead to market breadth deterioration.
✏️ Disclaimer
This is just my personal viewpoint. Always consult your financial advisor before taking any action.

HBAR Sell/Short Signal (1H)The price seems to have reached a strong level that contains a lot of orders and has also shifted to a bearish structure.
Our last valid order block is the red zone | if the price reaches it, it will be a sell/short opportunity.
We have two targets marked on the chart, offering a 1:2 risk-to-reward ratio.
Let’s wait and see what happens next.
For risk management, please don't forget stop loss and capital management
When we reach the first target, save some profit and then change the stop to entry
Comment if you have any questions
Thank You

SIGN Analysis (4H)We currently have strong bullish momentum on the chart, and we already had a bullish CH as well as two bullish BOS signals. The price has also been consolidating in a favorable area for some time, and bearish momentum has nearly dropped to zero.
We will wait for the price to return to the marked demand zone, and within that area we will look to open a buy/long position with proper capital management and risk control.
The targets have been marked on the chart.
A 4-hour candle closing below the invalidation level will invalidate this analysis.
Do not enter the position without capital management and stop setting
Comment if you have any questions
thank you

Pricol Ltd - Cup & HandlePricol Ltd
Sales - QoQ - 12.5%, YoY - 50.5%
Net Profit - QoQ - 28%, YoY - 42.2%
2 good quarters. Valuations are good among the peers. 35% potential. 548-556 is good range to enter or above 600 with SL 522. Cup and Handle breakout. Good volume. Pivot, Fib, cup targets are in chart.

THIS IS THE BULL SIGNAL EVERYONE MISSED!
BTC/USDT & XAU/USD JUST PRINTED A HIGHER LOW ON THE WEEKLY – THIS IS THE BULL SIGNAL
(Strong Support Holding | Next Leg Up Starting NOW)
Professional + High-Engagement Description (copy-paste ready):
🚨 BITCOIN & GOLD ARE SCREAMING THE SAME MESSAGE RIGHT NOW 🚨
After an extremely sharp correction, both BTC/USDT and XAU/USD (Gold) have just formed a clear HIGHER LOW on the weekly timeframe – this is textbook bullish structure in both risk-on and safe-haven assets simultaneously.
Key observations:
• Strong horizontal support zone (green) held perfectly on the weekly
• Price respected the long-term ascending trendline (yellow)
• This week’s candle is forming a higher low vs. the previous major weekly low → shift from distribution to accumulation
• BTC/Gold ratio (top panel) stabilizing after breakdown – correlation turning back in favor of risk assets
This is one of the cleanest macro confirmations we’ve seen since the 2024 bull run began. When Bitcoin AND Gold both refuse to make lower lows on higher timeframes, it usually signals that smart money is done selling and the next impulsive leg is loading.
Targets if support holds:
BTC/USDT: 28,500$ → 29,170$ → new ATH
XAU/USD: 2,800$ → 3,000$+ psychological zone
Watch for weekly close above the trendline – that will be the official trigger.
Who else sees this setup? Drop a 🔥 if you’re loading bids here.
#Bitcoin #BTC #XAUUSD #Gold #Crypto #TechnicalAnalysis #Bullish
(Chart: BTCUSDT + XAUUSD overlay | Weekly timeframe | Nov 20, 2025)

ETH Setup — “Monster R:R Opportunity Inside Smart MoneyETH/USDT — 4H
This chart reveals a clean Smart Money Footprint sitting exactly at the end of the current corrective leg.
Price rejected the upper channel line and tapped deep into the discount zone, creating a high-probability reversal setup.
🔥 Why This Setup Matters
Price tapped SM footprint liquidity
Clear mitigation and bounce structure forming
Market is still trading inside a bearish channel — but we’re now entering the ideal long zone
Target is aligned with the mid-channel & previous inefficiency levels
📈 Trade Idea (Not Financial Advice)
LONG: Around the Smart Money Footprint
SL: Below the footprint low
TP: 3,150 → 3,250 zone
This creates a monster R:R opportunity if the structure shifts to bullish.
“ETH is tapping into a deep Smart Money discount zone. Liquidity swept, footprint printed, structure shifting.
If the bounce confirms, this becomes one of the cleanest R:R setups of the week. Watching the 3,150–3,250 range for targets.”

