Deep corrections are expected for MYX (12H)The MYX token has risen without supportive market structure and mainly through spike-driven moves. After a major bearish CH and the formation of a liquidity pool above the chart, it is now prone to further corrections.
It is expected to move from the supply zone toward the target levels marked on the chart.
It’s advisable not to hold this asset or maintain a bullish outlook on it.
This coin is highly volatile, so use low leverage, scale into positions in multiple entries, and strictly follow your stop-loss.
A daily candle closing above the invalidation level will invalidate this analysis.
Do not enter the position without capital management and stop setting
Comment if you have any questions
thank you
Pivot Points

GBPJPYIf the 206 range is broken, the breakdown of the structure is confirmed and reaches the 203. This scenario is valid until the ceiling of 209 is broken.

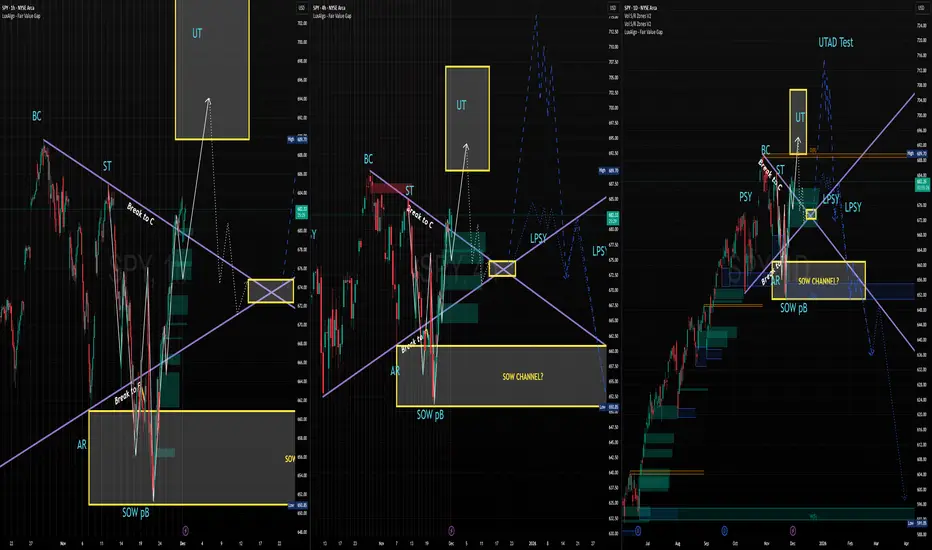
Long Term Wyckoff Distribution In-PlayAs the title states, we have a Wyckoff distribution method/pattern in play here on the chart.
So far the set up and pattern has been pretty on-point if you take a look and analyze Wyckoff Methods from www.wyckoffanalytics.com .
I don't have a ton of additional analysis to add here. I am only analyzing the chart and indicators I have. However, I'd love to hear some additional feedback for contrasting opinions or agreeing opinions for some confluence.
Have a great day TV gang and I hope you have a great December.
MSTR. When Bitcoin sneezes, Strategy looks for the floorMSTR is deep in a corrective phase after the rally to 543. The current decline does not signal a structural breakdown but a return to a major demand zone at 100–102, where long term support and prior accumulation align. Selling volume is fading, suggesting seller exhaustion rather than panic. As long as price holds above 100–102, the recovery scenario remains valid. Initial rebound targets sit near 230, followed by 300 if market structure stabilizes.
Fundamentally, Strategy remains the most leveraged public Bitcoin proxy. As of December 2025, the company holds over 214000 BTC, making it the largest public Bitcoin holder globally. The average acquisition price remains well below historical highs, reducing long term downside risk. In Q3 2025, the company reported an increase in digital asset value as crypto markets recovered. The core analytics software business remains stable, while debt servicing shows no liquidity stress. Strategy is no longer just a software company. It is a macro Bitcoin instrument in equity form.
When Bitcoin panics, MSTR falls harder. But it usually stands up first when the cycle turns.

NQ idea
Seems like NQ is going to want to grab the Liquidity chilling at this 4hr before making any shot at moving higher. If we just smash through it, we are likely trying the fill the volume imbalance on the Daily Time frame (the blue box)
This market is some what of a hard read since we are in a daily up trend, but in a 4 hour downtrend. This 4hr trend could either be a retracement or a complete structure shift. Only the future can confirm

$NFLX one last pump before falling further?NASDAQ:NFLX looks like it's setting up for a reversal here. I could see one last move higher into the $113-117 range as a final rally before heading lower.
We've formed a higher low on the $94.25 support level. Options flows starting to look bullish. Let's see if we get one final move higher into end of the year or early January.

Nifty Analysis EOD – December 17, 2025 – Wednesday 🟢 Nifty Analysis EOD – December 17, 2025 – Wednesday 🔴
Bears Breach PDL: Critical Defense at 25800 Support Zone.
🗞 Nifty Summary
The Nifty opened with a 52-point Gap Up, but the optimism was short-lived as the first candle immediately filled the gap. While bulls attempted a recovery, the 25920 ~ 25930 resistance zone proved insurmountable, triggering a hard sell-off.
This downward pressure decisively broke the CDL, PDC, and the PDL. After breaking the PDL, the index entered a 40-point consolidation phase before another breakdown tested the lower levels.
The 25800 ~ 25815 zone shifted from support to resistance during the session. Nifty managed a late 50-point recovery from its lows to close at 25,822.65, marking a loss of -41.55 points (-0.16%).
Significantly, bears have captured the ground by securing a close below the PDL.
🛡 5 Min Intraday Chart with Levels
🛡 Intraday Walk
The majority of the day’s significant movement was compressed into the first half. The failure at the 25920 zone confirmed that supply remains heavy at higher levels.
The breakdown below the PDL was the technical highlight of the day, signaling that bears are successfully pushing the structural boundaries lower.
The late-day recovery shows some buying interest, but the fact that 25800 ~ 25815 acted as resistance into the close suggests a cautious outlook for the bulls.
📉 Daily Time Frame Chart with Intraday Levels
🕯 Daily Candle Breakdown
Open: 25,902.40
High: 25,929.15
Low: 25,770.35
Close: 25,818.55
Change: −41.55 (−0.16%)
🏗️ Structure Breakdown
Type: Bearish candle (small body).
Range (High–Low): ≈ 159 points — moderate volatility.
Body: ≈ 84 points — reflecting persistent bearish pressure from the open.
Upper Wick: ≈ 27 points — limited buying strength near the open.
Lower Wick: ≈ 48 points — buyers attempted to defend lower levels, creating a supportive tail.
📚 Interpretation
The candle structure reflects a market under pressure. While the change in percentage is small, the internal dynamics—specifically the failure to hold the open and the breach of the PDL—point to a bearish bias. The lower wick suggests that while buyers are present near 25770, they lack the momentum to reclaim the opening price.
🕯 Candle Type
Bearish Candle with Lower-Wick Support Attempt — Signals selling pressure, though buyers are showing interest near the 25800 support zone.
🛡 5 Min Intraday Chart
⚔️ Gladiator Strategy Update
ATR: 193.4
IB Range: 77.80 → Medium
Market Structure: Balanced
Trade Highlights:
0:34 Short Trade - Trailing SL Hit
14:04 Short Trade - Trailing SL Hit
Trade Summary: The morning short trade successfully capitalized on the rejection from the 25920 resistance zone. However, the late-afternoon contra-long attempt met with further selling pressure at the 25815 resistance, resulting in a stop-loss hit as the market failed to sustain the bounce.
🧱 Support & Resistance Levels
Resistance Zones:
25890
25930 ~ 25920 (Major Supply)
25985
Support Zones:
25800 (Immediate Support)
25740 ~ 25715 (Last Resort Zone)
🧠 Final Thoughts
“The 25800 level is the current fort for the bulls.”
The close below the PDL is a warning sign. For tomorrow, if the 25800 level fails to hold as a support base, the 25740 ~ 25715 zone will be the “last resort” for the bulls to prevent a deeper correction.
Bulls need to reclaim and sustain above 25890 to neutralise the current bearish momentum.
✏️ Disclaimer
This is just my personal viewpoint. Always consult your financial advisor before taking any action.

NZDCHF is in the Bearish DirectionHello Traders
In This Chart NZDCHF HOURLY Forex Forecast By FOREX PLANET
today NZDCHF analysis 👆
🟢This Chart includes_ (NZDCHF market update)
🟢What is The Next Opportunity on NZDCHF Market
🟢how to Enter to the Valid Entry With Assurance Profit
This CHART is For Trader's that Want to Improve Their Technical Analysis Skills and Their Trading By Understanding How To Analyze The Market Using Multiple Timeframes and Understanding The Bigger Picture on the Chart

PTB appears to be ready for a bullish move (2H)First of all, be aware that this is a high-risk asset and has experienced heavy drops in the past. Therefore, do not forget proper position sizing and risk management so that getting stopped out doesn’t lead to emotional regret.
Given that price is currently sitting on two key price-action levels, has a bullish CH, and has broken a short-term resistance trendline, we can consider taking a buy/long position by risking the demand zone.
Targets are marked on the chart.
A 4-hour candle close below the invalidation level would completely invalidate this outlook.
Do not enter the position without capital management and stop setting
Comment if you have any questions
thank you
PLong

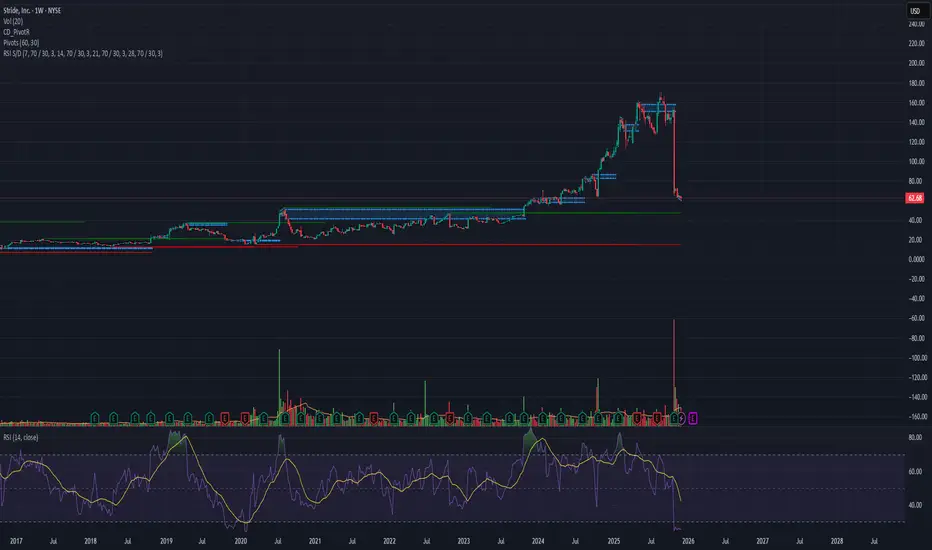
Fast Reversal Setup | Price: 62.68 → Target: 65.81 (+5%)
After the recent lawsuit-related news, LRN dropped sharply from $155 → $62 and is now deep in the oversold area 📉🔥
Volume Signal 📊
This week’s traded volume is higher than anything since its IPO, which often marks a reversal zone.
Repeated Patterns 🔍
Across the daily, weekly, and monthly intervals, the stock is showing its typical reversal pattern, matching previous bounce cycles.
Entry: 62.68
Target: 65.81
Profit: +5% 💰⚡
Nifty Analysis EOD – December 16, 2025 – Tuesday🟢 Nifty Analysis EOD – December 16, 2025 – Tuesday 🔴
Open=High Day: Bears Take Full Control, Closing Nifty on Critical Support.
🗞 Nifty Summary
The Nifty started with a Gap Down of 33 points and immediately extended losses by another 75 points, establishing an Open = High (O=H) formation—a clear signal of bearish dominance.
The initial bounce from the PDL quickly faded, leading to a break below the PDL. The 25890 level acted as a temporary pivot for most of the session, but selling pressure gradually pushed the Nifty down to the next support zone of 25860 ~ 25840.
The day closed near the low at 25,860.10, with a loss of -167.20 points (-0.64%). The day was full of volatility due to the weekly expiry, and bears were firmly in control, successfully denying any significant recovery.
The close right on the important support zone of 25860 ~ 25840 raises the serious question: Is the short-term bull trend fading?
🛡 5 Min Intraday Chart with Levels
🛡 Intraday Walk
The Open=High formation meant sellers controlled the price from the very first tick. The failure to reclaim the PDL after the initial bounce was a strong technical signal that the short-term trend was reversing.
Nifty spent the majority of the session in a sustained downtrend, grinding against the minor support levels until it settled on the 25860 ~ 25840 zone.
The lack of any significant recovery at these levels is a major concern, as it suggests buyers lacked the conviction necessary to defend key structural points.
📉 Daily Time Frame Chart with Intraday Levels
🕯 Daily Candle Breakdown
Open: 25,951.50
High: 25,980.75
Low: 25,834.35
Close: 25,860.10
Change: −167.20 (−0.64%)
🏗️ Structure Breakdown
Type: Bearish candle.
Range (High–Low): ≈ 146 points — moderate volatility.
Body: ≈ 91 points — reflecting clear selling pressure and bearish control.
Upper Wick: ≈ 29 points — early buying attempt but quickly rejected, contributing to the O=H structure failure. (according Pre-Open Price)
Lower Wick: ≈ 26 points — minor buying interest near the lows.
📚 Interpretation
The strong bearish body and the close near the day’s low confirm seller dominance. The absence of a long lower wick indicates that buyers lacked conviction at the 25860 support level. The current close is precarious, sitting right on the final major support before the deeper levels of 25740 ~ 25715.
🕯 Candle Type
Bearish Continuation Candle — Indicates sellers maintaining control; further downside is possible unless a strong bullish reversal appears immediately.
🛡 5 Min Intraday Chart
⚔️ Gladiator Strategy Update
ATR: 197.24
IB Range: 79.10 → Medium
Market Structure: ImBalanced
Trade Highlights:
0:34 Short Trade - Trailing SL Hit
14:04 Short Trade - Trailing SL Hit
Trade Summary: The steady, grinding downtrend made capturing clean trades difficult, resulting in two stop-loss hits on breakout attempts. The low-conviction price action near support zones led to choppy movements that struggled to generate the required high R:R targets.
🧱 Support & Resistance Levels
Resistance Zones:
25890
25930 ~ 25920
25985
26030
Support Zones:
25800
25740 ~ 25715 (Critical Base)
🧠 Final Thoughts
“The test of the bulls is tomorrow’s open.”
The close on the 25860 ~ 25840 support zone is highly critical. To confirm the fading bull trend, we need to see a decisive close below 25740 ~ 25715.
For tomorrow, a break below today’s low (25,834) will open the door to 25740. Until we see a strong follow-up close above 25930, bias remains negative.
✏️ Disclaimer
This is just my personal viewpoint. Always consult your financial advisor before taking any action.


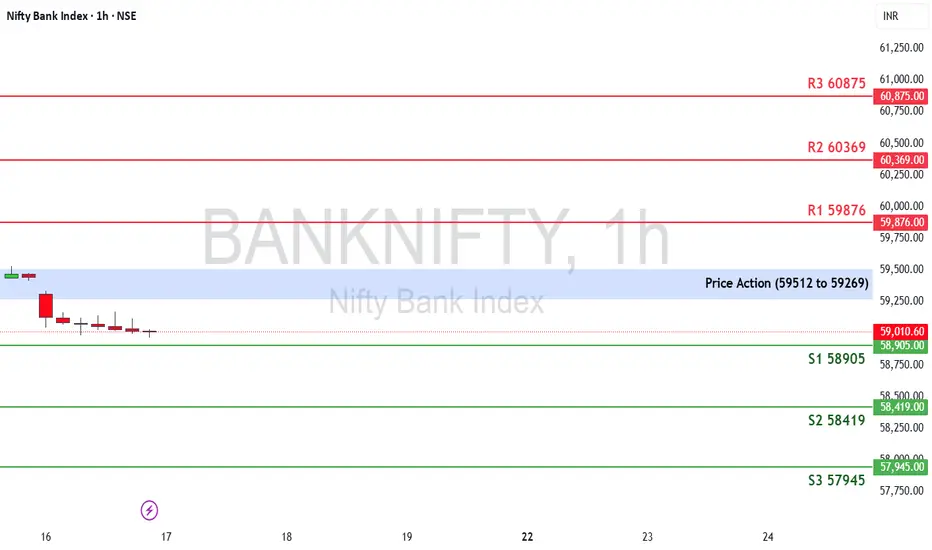
Bank Nifty Weekly Outlook (15th Dec – 19th Dec 2025)The Nifty Bank Index last week ended at 59,389.95, posting a decline of –0.65%.
The index is currently trading inside a crucial supply zone, indicating an important decision point for the upcoming week.
🔹 Key Levels for the Upcoming Week
📌 Price Action Pivot Zone: (59,512 to 59,269)
Sustaining above 59,512 may invite aggressive buying interest,
while rejection from this zone could trigger short-term profit-booking.
🔻 Support Levels
S1: 58,905
S2: 58,419
S3: 57,945
🔺 Resistance Levels
R1: 59,876
R2: 60,369
R3: 60,875
📈 Market Outlook
✅ Bullish Scenario:
If Bank Nifty sustains above the Pivot Zone (59,512–59,269),
the index may move toward R1 (59,876).
A strong breakout above this level could extend the rally toward
R2 (60,369) and eventually R3 (60,875).
❌ Bearish Scenario:
If the index falls below 59,269, short-term weakness may drag it toward
S1 (58,905), followed by S2 (58,419) and S3 (57,945).
A weekly close below 57,945 may signal the beginning of a deeper corrective phase.
Disclaimer: aliceblueonline.com
USDCHF: High Chance for Recovery?! 🇺🇸🇨🇭
USDCHF may continue recovering after a test
of a strong intraday horizontal support.
It looks like we got a bearish trap below that
and we see a relatively strong bullish momentum now.
Goal will be 0.7985
❤️Please, support my work with like, thank you!❤️
I am part of Trade Nation's Influencer program and receive a monthly fee for using their TradingView charts in my analysis.

Selena | XAUUSD 4H - Bullish Continuation Structure ATH SOONFOREXCOM:XAUUSD
The market absorbed prior selling pressure and transitioned into sustained higher highs and higher lows. Current price is trading above the previous consolidation range, suggesting continuation toward higher liquidity zones, while pullbacks remain corrective within trend.
Key Scenarios
✅ Bullish Case 🚀 →
🎯 4350 → 🎯 4420 → 🎯 4500
❌ Bearish Case 📉 → Breakdown below 4050
Current Levels to Watch
Resistance 🔴: 4350 – 4450
Support 🟢: 4180 / 4050
⚠️ Disclaimer: This analysis is for educational purposes only. Not financial advice.

IONX 4H - When the noise fades, volume takes controlIONX is transitioning from a sharp corrective phase into stabilization near the 22 to 23 zone. This move is not random selling but a clear sign of seller exhaustion. Price is holding a confluence area where Fibonacci 0.618 and 0.786 align with a prior accumulation zone. Volume tells the real story. Selling pressure is fading, while momentum indicators show bullish divergence. Sellers are losing control even as price remains near the lower range.
The current structure suggests stabilization rather than trend continuation to the downside. Ranges are tightening and demand reactions are becoming consistent. As long as price holds above 22 to 23, the recovery scenario stays intact. The first resistance zone sits near 29 to 30, where previous balance was formed. A confirmed breakout opens the path toward 38.04 and then 48.10.
IONX is what happens when emotions leave the chart and patience takes over.

AUDUSD - 16/12/25 With the dollar showing some weakness over the next few days - i am looking for AUD to climb up and reverse at the zone above.
AUDUSD has just formed a nice reversal head and shoulders with a break of structure.
I placed a sell limit on the extreme zone and will hold to the next demand zone below.

GBPUSD - 15/12/25 - Day TradeOn the left there is lovely reversal sign showing up with a BoS. now that price on the substructure has formed there is small pull back to grab a buy limit to the top supply zone.
the choppiness of the EUR is making me doubt this trade - but its my idea for the day.

BTC Scalp Sell/Short Signal (30M)Price is bearish on the lower timeframe, which suggests a pullback within the higher-timeframe bullish structure to the downside in order to collect orders, before potentially moving higher.
On the lower timeframe, we have a bearish CH, and there are liquidity pools below the chart that can be swept.
Based on this setup, Bitcoin can be shorted.
At the first target, move the trade to breakeven and take partial profits.
Do not enter the position without capital management and stop setting
Comment if you have any questions
thank you

SOL Scalp Sell/Short Signal (1H)Given the formation of lower LHs and the bearish internal structure of Solana based on a bearish ICH, we can look for short sell positions below the previous highs.
At the first target, move to break-even and shift the stop loss to the entry.
Do not enter the position without capital management and stop setting
Comment if you have any questions
thank you

BUY Tech100 for 1:2 RR 4H chardAfter a significant pullback in the nasdaq last week, it looks like the pullback is turning around here on the 4H chart with promising price action for revisiting old highs. I am buying Tech 100 as I am posting this idea.

Nifty Analysis EOD – December 15, 2025 – Monday🟢 Nifty Analysis EOD – December 15, 2025 – Monday 🔴
Successful Defense: Bulls Protect 25920 Support and Regain 26K Territory.
🗞 Nifty Summary
The Nifty started with a sharp 77-point Gap Down. The first minute saw a 50-point recovery attempt to fill the gap, but the 26K level immediately acted as resistance, pushing the market down over 100 points and breaching the PDL.
This downside move was halted precisely at our immediate strong support zone of 25920 ~ 25930. This zone provided a solid base, initiating a strong recovery that allowed Nifty to climb back above the IBH and test the PDC.
Multiple attempts to breakout above the PDC failed, yet the day successfully closed at 26,014, near the PDC and above the crucial 26K psychological level, forming a bullish recovery candle.
Bulls successfully recovered all lost ground, setting a positive tone for tomorrow.
🛡 5 Min Intraday Chart with Levels
🛡 Intraday Walk
The day’s action confirmed strong buying conviction near the lower support band. The initial sell-off was a clear test of yesterday’s structural stability.
The recovery from the 25920 ~ 25930 zone was steady and powerful, confirming that this level has flipped polarity to become strong support.
The struggle near the PDC showed consolidation, necessary after the sharp recovery.
Given the strong close, I am expecting a bullish extension day tomorrow, provided no negative news emerges. The immediate resistance to watch is 26104.
📉 Daily Time Frame Chart with Intraday Levels
🕯 Daily Candle Breakdown
Open: 25,930.05
High: 26,047.15
Low: 25,904.75
Close: 26,027.30
Change: −19.65 (−0.08%)
🏗️ Structure Breakdown
Type: Strong Bullish Candle with dominant body.
Range (High–Low): ≈ 142 points — moderate volatility.
Body: ≈ 97 points — large body, reflecting strong buying conviction and recovery.
Upper Wick: ≈ 20 points — mild rejection near highs.
Lower Wick: ≈ 25 points — buyers successfully defended the critical 25920 level.
📚 Interpretation
The large bullish body and the recovery back above 26K highlight the market’s strong resilience. The aggressive buying from the 25920 ~ 25930 zone neutralized the early gap-down weakness. The close near the day’s high reflects the successful culmination of the recovery effort, confirming a strong bullish conviction for the next session.
🕯 Candle Type
Strong Bullish Recovery Candle — Signals decisive buyer control and continuation intent.
🛡 5 Min Intraday Chart
⚔️ Gladiator Strategy Update
ATR: 197.72
IB Range: 102.45 → Medium
Market Structure: ImBalanced
Trade Highlights:
09:58 Long Trade - Target Hit (R:R 1:2) (Contra Trend - Engulfing at Important Support with Vwap Cross)
11:49 Long Trade - Target Hit (R:R 1:1.03 Trailing SL) (Trendline Breakout)
14:10 Short Trade - Trailing SL Hit (Trendline BreakDown)
Trade Summary: The strategy successfully captured the crucial reversal from the critical support zone (25920), securing two profitable long trades against the initial negative momentum. The late-day short trade hit a trailing stop loss due to the persistent nature of the defence at 26K.
🧱 Support & Resistance Levels
Resistance Zones:
26070
26104 (Next Major Hurdle)
26155
Support Zones:
25985
25930 ~ 25920 (Today’s Tested Support)
25890
🧠 Final Thoughts
“The 25920 defense line was a success.”
The close above 26K is structurally positive. The focus for Tuesday is the 26104 resistance. A decisive breach of this level will trigger the next bullish leg toward 26155. Failure to cross 26104 could lead to a test of the 25985 support again or halt the bullish momentum.
✏️ Disclaimer
This is just my personal viewpoint. Always consult your financial advisor before taking any action.

USDJPY - 15/12/25On the 1 hour there are 2 significant break of structures which left a hammer demand zone that i am looking for a buy from.
There is imbalance above it that i am expecting to be take out.
I placed a buy limit at this demand zone, but will also watch for a confirmation to form and possible add to the trade if it shows promise. confirmation needs to show up on the 30min or 15min TF.
TP is the recent high of last week.
