Pivot Points
APOLLO HOSPITAL
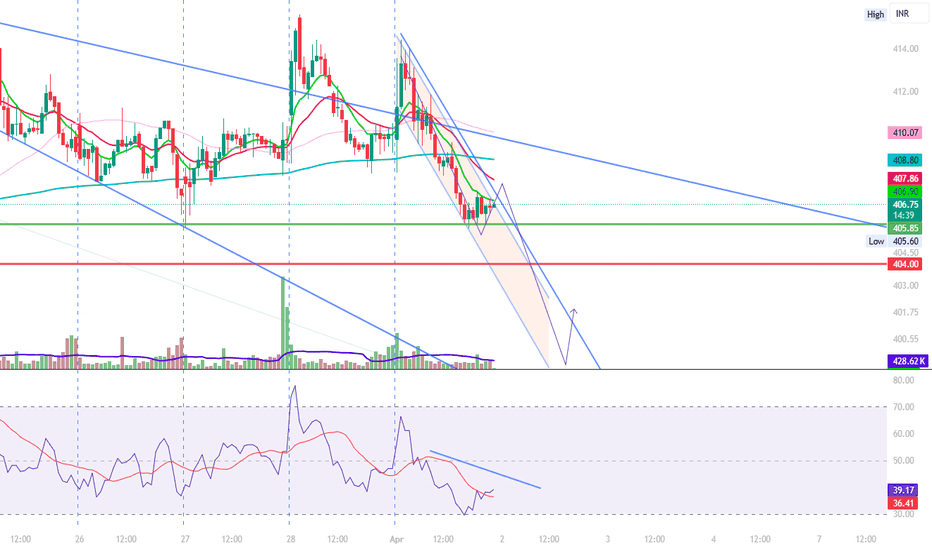
Apollo Hospitals' stock is currently showing a neutral to slightly bearish trend. The stock closed at ₹6,105.65, reflecting a 0.84% increase on the last trading day. Analysts have noted that the stock has experienced a negative price breakout recently, trading below its second support level.
Key support levels for the stock are around ₹6,000–₹6,050, while resistance levels are near ₹6,200–₹6,250. If the stock breaks above ₹6,200, it could signal upward momentum, but a dip below ₹6,000 might lead to further selling pressure.
DOW JOUNES DOWNDOW JOUNES DOWN
It seems you're curious about Dow Jones Index and its future trends. Based on recent forecasts, the Dow Jones Industrial Average (DJIA) is expected to fluctuate within certain ranges over the coming days. For example, predictions for March 19th suggest a range between 37,549 and 43,201, with an average value of 40,375. Keep in mind that market conditions can change rapidly, so these are just projections.
XAUUSD - Live Trade - Amazing Analysis - 1 Hr Time FrameThis analysis is made by reading naked charts and underlying intrinsic nature of price in a rather chaotic and volatile market using advance price action reading supported by some special tools to capture market edges.
Please note this analysis is made for education purpose only. Trade at your own risk.
Google Update - Trade this range and new ATH Identified Update video on the google Long that has been planned since early FEB. The level has now been hit and we got a nice reaction off that level . In this video I look into where I think we go next and how price plays out .
In the video I use the following tools TR Pocket FIB , 0.618 FIB , Pivots , Parallel Channel and the Fixed range Vol Profile.
If we stay range bound inside the channel then we have the potential to see a new high on google at the top of the channel in confluence with 1-1 ext + tr pocket expansion .
Watch the video and mark the levels on your chart and ensure to set your alerts .
Dont forget to Boost the chart Please and i welcome any questions TY
SOLUSD: How to Draw Quarter's Theory LevelsApplying Quarter’s Theory to SOL/USD helps traders identify key psychological price levels where institutional players might step in. With Solana’s volatility, these quarter levels (25%, 50%, 75%, and full dollar increments) act as crucial areas for potential reversals or breakouts.
Current Market Outlook
SOL/USD is currently trading around a major quarter level, signaling a potential shift in momentum. If buyers push above $150, the next logical upside target is $175, while a breakdown could send prices back to $125—both key quarter points.
How to Trade It
Aggressive traders can enter at quarter levels with tight stops, aiming for quick price movements.
Conservative traders should wait for a breakout confirmation and a retest before executing trades.
Renko charts can help filter noise and confirm trend strength, making it easier to spot clean setups.
Is SOL/USD Gearing Up for a Big Move?
With SOL/USD sitting at a crucial level, the next move could be significant. Will we see a drop toward $125, or is a deeper pullback coming? What’s your take? Drop a comment below!


