EURUSD: Support & Resistance Analysis for Next Week 🇪🇺🇺🇸
Here is my latest support and resistance analysis
for EURUSD for next week.
Consider these structure for pullback/breakout trading.
❤️Please, support my work with like, thank you!❤️
I am part of Trade Nation's Influencer program and receive a monthly fee for using their TradingView charts in my analysis.
Pivot Points

XAUUSD Long: The 4,160 Support Holds – Path to 4,260 is OpenHello, traders! The price action for XAUUSD is currently developing within a well-defined ascending trend structure, supported by a rising major Trend Line from the lows. The market previously showed multiple rejections from the Triangle Supply Line, each marked by clear breakout attempts followed by corrective pullbacks. These reactions formed a sequence of higher lows, confirming that buyers remain in control of the broader structure.
Currently, after the last strong impulsive move upward, Gold reacted from the Supply Zone around 4,260, forming a short-term corrective phase while respecting the rising Triangle Demand Line near the 4,160 demand level. Price is now compressing between the descending supply line and the ascending demand line, creating a tightening triangle structure that signals growing pressure for a directional expansion. This compression reflects a balance between profit-taking sellers at resistance and aggressive dip-buyers along demand.
My scenario for the further development is bullish continuation as long as price holds above the Triangle Demand Line and the 4,160 demand zone. I expect a rebound from current levels, followed by a renewed attack on the 4,260 Supply Zone. If buyers manage to produce a clean breakout above this resistance, Gold may accelerate toward higher targets with strong momentum continuation. However, if the supply zone holds and price breaks below the demand line, a deeper corrective pullback toward the main rising Trend Line could develop. For now, the structure favors buyers, with the key focus on a breakout attempt toward 4,260. Manage your risk!

BTCUSD —Retracement Into 4H Demand Before Next Leg UpI’m expecting Bitcoin to complete a healthy retracement before continuing its bullish structure. Price has created a clear higher high on the daily timeframe, and the current slowdown suggests sellers are stepping in temporarily — which is normal after an extended move.
4H Demand Zone (My Entry Area)
I’m watching the 4H demand zone at 86,187 – 87,172.
This zone is:
• Fresh and unmitigated
• Origin of a strong bullish displacement
• Formed after a liquidity sweep and impulsive move up
This makes it a high-probability area for a bullish reaction.
Expectation
I expect BTC to pull back into the demand zone, fill inefficiency, and then continue the uptrend.
Target
My target is the next resistance level around 98,000, which was previously a major support area.

Elite | XAUUSD 15m – Bullish Continuation SetupOANDA:XAUUSD
After sweeping liquidity beneath major support, the market broke downward structure and initiated a bullish correction phase. The breakout above internal range highs and the descending trendline confirms a bullish shift, supported by strong demand rejections. Price is now trading above reclaimed structure and targeting the upper liquidity zone toward $4,256 – $4,260.
Key Scenarios
✅ Bullish Case 🚀
Hold above the re-test demand zone:
🎯 Target 1: $4,230
🎯 Target 2: $4,256 – $4,260 (final liquidity objective)
❌ Bearish Case 📉
Only active if price breaks and closes below $4,210
🎯 Downside Target: $4,170 (previous accumulation level)
Current Levels to Watch
Resistance 🔴: $4,230 / $4,260
Support 🟢: $4,218 / $4,170 / $4,150
⚠️ Disclaimer: This analysis is for educational purposes only. It is not financial advice.

Nifty Analysis EOD – December 5, 2025 – Friday🟢 Nifty Analysis EOD – December 5, 2025 – Friday 🔴
Monetary Policy Boost: Bulls Secure Strong Close Above 26100 Targeted…!
🗞 Nifty Summary
The session began flat to positive, marking the day’s low early at 25,985. In anticipation of news, Nifty stayed range-bound within a tight 40-point range for the first hour. The announcement of the monetary policy rate cut acted as a strong catalyst, immediately triggering high volatility.
The index sharply broke the IBH and PDH, but the next candle was met with a 100-point rejection, trapping early breakout traders. After taking temporary support at the CPR Zone, Nifty resumed its upward conviction, systematically breaching 26132 and testing the Gap Zone.
Following a small consolidation near the Gap Zone (25-30 points), the final surge broke resistance again, taking Nifty to the 26200 level. The day closed at 26,186.45, adding +152.70 points (+0.59%).
This closing is significantly above the 26100 target expected yesterday, confirming powerful bullish control heading into the weekend.
🛡 5 Min Intraday Chart with Levels
🛡 Intraday Walk
The initial fakeout after the news announcement was crucial, shaking out weak hands before the real directional move began.
Once the market absorbed the volatility, the moves were aggressive and targeted. Nifty utilized CPR and 26132 as springboards, confirming that buyers viewed every dip as a buying opportunity in the post-policy environment.
The final close near the day’s high is a definitive technical signal that the strength has returned, and the index is ready to challenge higher structural levels next week.
📉 Daily Time Frame Chart with Intraday Levels
🕯 Daily Candle Breakdown
Open: 25,999.80
High: 26,202.60
Low: 25,985.35
Close: 26,186.45
Change: +152.70 (+0.59%)
🏗️ Structure Breakdown
Type: Strong Bullish candle (Near Marubozu)
Range (High–Low): ≈ 217 points — high volatility and wide trading range.
Body: ≈ 187 points — reflecting dominant upside momentum.
Upper Wick: ≈ 16 points — very limited rejection near highs.
Lower Wick: ≈ 14 points — buyers strongly defended the early weakness.
📚 Interpretation
This candle is a powerful confirmation of bullish conviction, showing decisive absorption of the early selling and continuous buying pressure throughout the session. The wide body and the close near the high signal that buyers are firmly in control. This structure strongly supports trend continuation and suggests that the recent indecision has been resolved in favor of the bulls.
🕯 Candle Type
Strong Bullish Marubozu-Style Candle — Represents decisive buying control and potential momentum continuation.
🛡 5 Min Intraday Chart
⚔️ Gladiator Strategy Update
ATR: 192.7
IB Range: 76.75 → Medium
Market Structure: Balanced
Trade Highlights:
10:16 Long Trade - SL Hit (IBH + PDH Breakout)
10:49 Long Trade - Target Hit (R:R 1:3.34) (IBH + PDH Breakout)
Trade Summary: The volatile, news-driven session initially led to a Stop Loss on the first breakout attempt. However, the strategy quickly adapted, capturing a high R:R profitable long trade on the confirmed directional breakout, successfully aligning with the strong bullish momentum post-monetary policy announcement.
🧱 Support & Resistance Levels
Resistance Zones:
26202 (PDH)
26220 ~ 26235
26277 (ATH)
Support Zones:
26155
26104 (Must Hold)
26070 ~ 26030
🧠 Final Thoughts
“The monetary policy provided the spark needed to re-engage the bull run.”
The successful close above 26132 is a game-changer. The immediate bias for Monday is strongly bullish. We must now watch the critical overhead resistance at 26220 ~ 26235.
A decisive breach here will immediately target the All-Time High at 26277. The 26104 level is the new line in the sand; as long as Nifty holds this support, the bullish momentum remains intact.
✏️ Disclaimer
This is just my personal viewpoint. Always consult your financial advisor before taking any action.

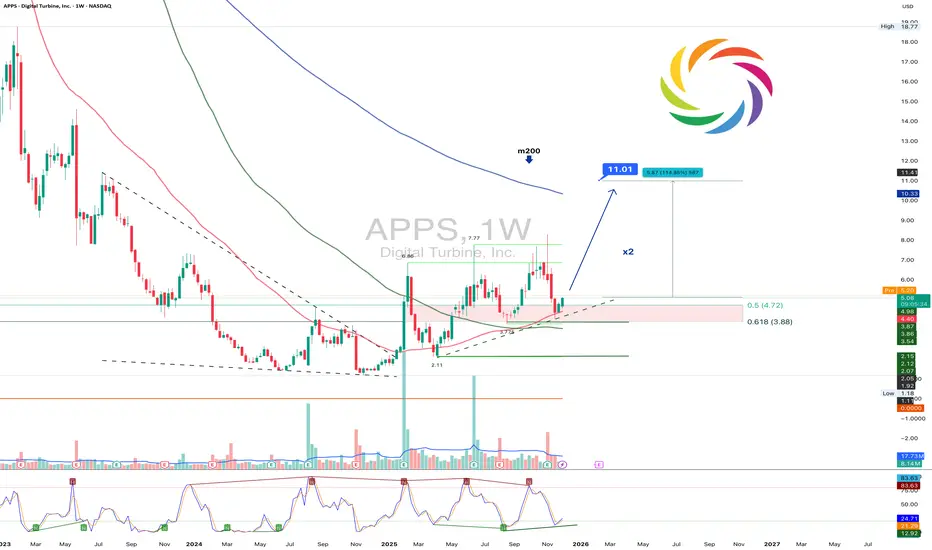
APPS 1W: warms up the stage again or is this only a teaserAPPS is trading at 5.08 and holding above the demand zone between 3.88 and 4.72. These levels correspond with Fibonacci 0.5 and 0.618 and continue to attract buyers. A golden cross between ma50 and ma100 has formed and the ma200 above creates a clean technical structure for a potential breakout. The chart suggests a move toward 7.77 while a confirmed break above it may open the way toward 11.01.
The fundamental picture has strengthened. Revenue grew 18 percent in the latest quarter and adjusted EBITDA increased 78 percent. The business acceleration comes from a sharp rise in ad impressions, wider SDK penetration, stronger non gaming activity and expansion into the Asia-Pacific region. Margin improvement and stronger cash flow support the bullish scenario as the advertising market stabilizes.
As long as price holds above the demand zone between 3.88 and 4.72 the bullish setup remains active. Losing this zone would lead to deeper consolidation yet the combination of technical strength and improving fundamentals favors upside continuation.
Advertising is all about timing and Digital Turbine seems to know exactly when to turn the spotlight on.
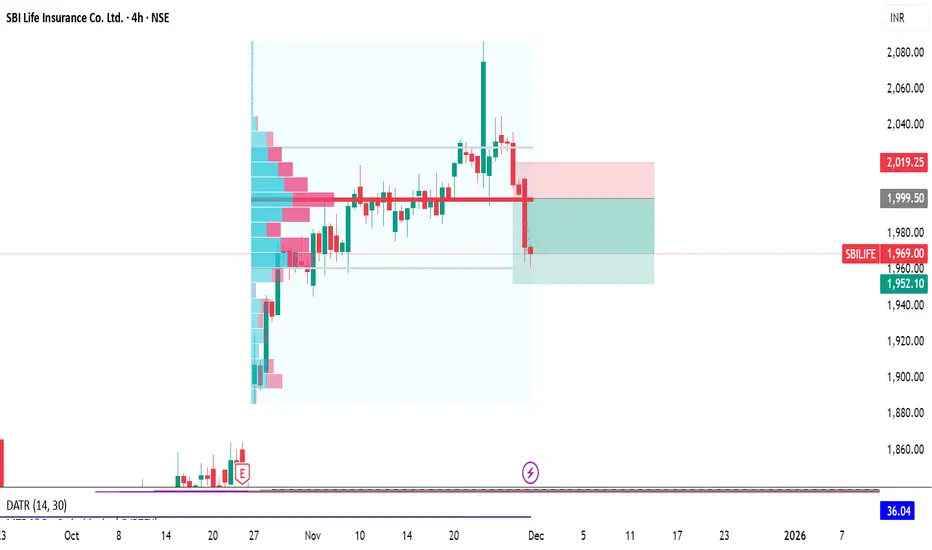
SBILIFE SHORT TRADE SETUPSBILIFE Short trade for 1: 2.4 RR
Logic: SBI life has made a slight bearish move on the daily and weekly.
A supply zone at around 2000 levels can be seen as selling opportunity, the zone is confluncing with Point of control formed by the volume profile data too.
ENTRY: 1999.50
SL: 2019.25
TARGET: 1952.00
ENTRY TO BE MADE WITH CONFIRMATION ONLY. (If a candle on 25/ 30 mins closes below the low of prior candle, of when the price enters the zone and starts downward move.
#Trade to be taken in futures, take half the normal position size as it is a counter trend trade( higher time frame is still up).
#safe trading
US30 BiasM & W: Uptrend, respecting the lows
D: Uptrend, price retraced 78.6%
4H: Uptrend, price made a lower low, possibly trending short
1H: Uptrend, price hit H4 resistance zone + RSI showing oversold and bearish divergence.
CURRENTLY: I'm looking for price to go short to retest H1 trendline, @previous resistance, and continue long.
IF price breaks below H1 trend, I'll look for price to continue short to previous major support area

Leverage Is a Tool — Learn Risk, DCA & Capital EfficiencyIn trading, most failures don’t come from bad entries — they come from bad risk.
This post is a lesson in structured risk management , showing you how to use:
- Leverage as a tool for capital efficiency — not destruction
- DCA (Dollar-Cost Averaging) as a strategic method of entry
- Portfolio risk limits to define, control, and survive uncertainty
If you struggle with:
- Overexposure
- Emotional compounding
- Liquidation from small pullbacks
- No clear entry/exit framework...
… this lesson is for you.
🔐 Risk Management: The Non-Negotiable
Rule #1: Define how much you are willing to lose before entering a trade.
This is called your risk per trade , usually between 1–2% of your portfolio.
At 10%, you're being aggressive — and must have a plan to manage that exposure.
We don't control the outcome — we control the input:
- Entry
- Stop
- Size
- Risk
When you control those, drawdowns are survivable, and probability can do its job.
⚖️ Leverage: Use It Intelligently
Leverage is a tool , not a strategy.
Use it to reduce the amount of margin locked in a trade, not to increase your risk.
With defined stops and limited exposure, leverage lets you:
- Keep cash free for other trades
- Scale into high-conviction zones
- Stay efficient in the market
But uncapped leverage + undefined risk = guaranteed blowup over time.
📊 DCA: A Smarter Way to Scale
DCA (Dollar-Cost Averaging) isn't just for passive investing — it's powerful in trading too.
When the market moves into a reversal zone (support/resistance, divergence, order block, etc.), we don’t guess one perfect entry. Instead:
- Set an anchor entry
- Add 2–4 additional levels deeper into the zone
- Size each entry with increasing conviction (e.g. 1x, 2x, 4x)
This gives you a better average entry , avoids full fills on weak moves, and reduces emotional overreaction to early red positions.
📈 Best Practices (Save These)
✅ Always define risk in % of portfolio
✅ Use 1–3% risk max per trade unless fully planned
✅ Use higher timeframes (1D, 4H) for cleaner levels
✅ Pair DCA with reversal indicators — don’t DCA blindly
✅ Set SL below/above zone based on structure or ATR
✅ Only use leverage when risk is defined — never without a stop
✅ Never DCA into a loser without a stop — this isn't martingale
🛠️ Apply the Lesson — with the DCA Ladder + Risk Calculator
To make this practical, I’ve published a free tool here on TradingView:
👉 DCA Ladder Calculator by @RWCS_LTD
It lets you:
- Input portfolio value, risk %, and leverage
- See optimal entry prices and position sizes
- Understand stop loss placement
- Visualize how capital and risk are distributed
- Teach yourself capital-efficient execution
You can use it for both LONG and SHORT setups.
Pair this tool with your strategy, and your edge will stop bleeding from risk errors.
⚠️ Final Reminder
Risk is not something to react to — it’s something to define.
“It’s not about being right — it’s about not blowing up.”
🛡️ Disclaimer
This is not financial advice.
All content is for educational purposes only.
Trading with leverage involves risk of loss.
Always do your own research and consult a licensed financial advisor before acting on any ideas or tools.

USD/CHF Hints at Swing Low at Round NumberA bullish engulfing candle formed around the 0.80 handle on Thursday, closing back above the monthly pivot point and the 50- and 20-day EMAs. The 4-hour chart shows momentum turning higher after a correction from ~0.81, with the upswing supported by rising volumes — signalling bullish initiation.
Note the high-volume node (HVN) around 0.8050, which may act as near-term resistance and trigger a pullback. Bulls could look for dips within Thursday’s range in anticipation of a move towards 0.81.
Matt Simpson, Market Analyst at City Index.

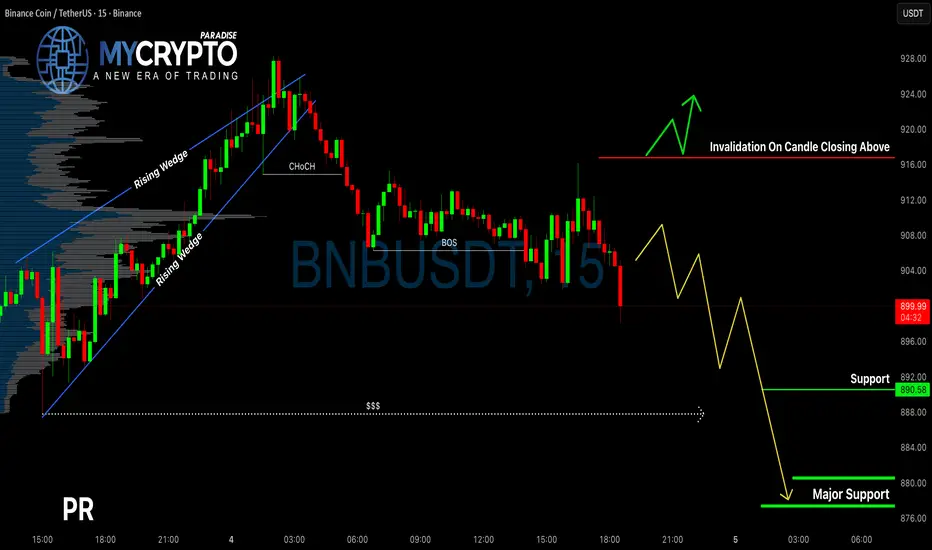
BNB Just Triggered a Breakdown, Are You Ready for the Next Move?Yello, Paradisers! Have you noticed how BNB quietly broke down from its rising wedge while most traders are still waiting for direction? This could be the early signal of a much deeper move—if you're not prepared, you might miss the whole thing.
💎BNBUSDT has officially broken down from a rising wedge formation—a pattern that typically signals a bearish reversal. What makes this even more significant is the clear bearish Change of Character (CHoCH) on the chart, which adds further confirmation that the trend may be shifting downward.
💎We’ve already seen a bearish Break of Structure (BoS), suggesting that downside momentum is building. However, instead of jumping in now, the higher-probability setup would be to wait for a pullback. Ideally, we want to see the price return to a more premium level, where we can then look for confirmation through a bearish candlestick pattern. That would give us a much better risk-to-reward entry point. Once confirmed, we’ll be targeting the next zones of liquidity and support lower on the chart.
💎That said, we always need to plan for the invalidation scenario. If price breaks above our invalidation level and closes a full candle above it, the current bearish thesis would no longer be valid. In that case, it’s best to step aside and wait for more reliable price action before taking any positions. Patience will protect your capital more than any indicator.
🎖Strive for consistency, not quick profits. Treat the market as a businessman, not as a gambler. The next few moves will separate those who follow their plan from those who trade emotionally. Stay sharp, Paradisers.
MyCryptoParadise
iFeel the success🌴
Dxy bear 15 min chartDxy is heading down Converselry I suspect silver and gold will make an upswing from here by 3%

#ETHUSDT: Price is yet to drop around $1780 area before bullsETHUSDT is likely to fall further to around $1900 or $1800. This area appears more promising and has strong bullish volume. We should wait for price confirmation before entering.
If you like our idea, please like and comment. Also, use accurate risk management.
Team Setupsfx_

IDFC LONG SETUPLogic: Since IDFC is in an uptrend, on the daily, the demand zone on the marked levels are near the weekly levels too which has broken a prior pivot and a prior supply zone.
A long can be opened targeting for R:R 1:2/2.5 and trailing the remaining on closing basis.
#Take proper position size
#Safe trading.

Nifty Analysis EOD – December 4, 2025 – Thursday🟢 Nifty Analysis EOD – December 4, 2025 – Thursday 🔴
Bulls Retake 26K: Recovery Capped by Late Selling Pressure.
🗞 Nifty Summary
The session began flat, immediately plunging 50 points to mark the day low at 25,938.95. The subsequent recovery was swift and confident, successfully pushing the Nifty above the initial resistance at 26030 and completing the Initial Balance (IB) formation.
The index then methodically climbed through 26075, PDH, and 26104. Bulls tried hard to sustain above the PDH but failed, leading to a sharp fallback below 25985 and the PDC.
After another strong, 100-point recovery attempt failed to reclaim the PDH, the day concluded with a surprise element: sharp selling in Reliance (2% fall within last 30 minutes) wiped out 50 points in the last 30 minutes.
Despite this late pressure, the Nifty closed successfully at 26,010.35, securing a close above the psychological 26K level. The day was full of action, showing strong territorial fighting from both sides.
🛡 5 Min Intraday Chart with Levels
🛡 Intraday Walk
The initial market weakness was quickly negated by strong buyers at 25938, turning the early move into a deep lower wick.
The strong recovery confirmed demand below 26K. The most crucial structural failure occurred when Nifty broke 26104 but could not hold it, showing overhead supply at that level. This failure indicates that while bulls are defending 26K, they lack the conviction for a sustained breakout.
The final sharp sell-off, attributed primarily to a major heavyweight stock (Reliance), dragged the closing price lower, but the close above 26K remains a small victory for the bulls.
📉 Daily Time Frame Chart with Intraday Levels
🕯 Daily Candle Breakdown
Open: 25,981.85
High: 26,098.25
Low: 25,938.95
Close: 26,033.75
Change: +47.75 (+0.18%)
🏗️ Structure Breakdown
Type: Bullish candle with a moderately long upper wick.
Range (High–Low): ≈ 159 points — demonstrating moderate intraday movement.
Body: ≈ 52 points — reflecting controlled upside strength.
Upper Wick: ≈ 64 points — indicates that buyers attempted a breakout but faced significant resistance near the highs (26,100).
Lower Wick: ≈ 43 points — confirms buyers protected the lower levels early in the session.
📚 Interpretation
The candle is bullish, confirming a successful defense of the 25930 ~ 25920 zone. However, the long upper wick is a warning signal, showing strong supply near 26,100. The overall structure suggests that while bulls are fighting back, they are meeting strong resistance at critical breakout levels. The successful close above the 26K psychological level is the primary positive takeaway.
🕯 Candle Type
Bullish Candle with Upper-Wick Resistance — Upside continuation requires clearing the 26100 resistance decisively.
🛡 5 Min Intraday Chart
⚔️ Gladiator Strategy Update
ATR: 189.97
IB Range: 97.4 → Medium
Market Structure: Balanced
Trade Highlights:
10:07 Long Trade - Target Hit (R:R 1:1.74) (IBH + Resistance Breakout)
12:05 Long Trade - SL Hit (IBH + Resistance Breakout)
Trade Summary: The strategy capitalized on the strong morning recovery from the day’s low, securing an early long target. However, the unexpected high-level rejection and subsequent choppy price action around the PDH resulted in the second trade hitting its stop loss.
🧱 Support & Resistance Levels
Resistance Zones:
26030 ~ 26075
26104
26132 ~ 26160
26220
Support Zones:
25985
25930 ~ 25920 (Immediate Base)
🧠 Final Thoughts
“The fight for 26100 defines the week.”
The market is holding above 26K, which is positive, but the strong selling near 26100 shows bears remain active. For tomorrow’s session, bulls must breach the 26160 gap zone and secure a close above 26100 to maintain bullish momentum. Failure to do so could lead to a re-test of the 25985 support.
✏️ Disclaimer
This is just my personal viewpoint. Always consult your financial advisor before taking any action.

NZDCHF SELL IDEANZDCHF Bearish Trend ,Forming LL and LH, NZD is fundamentally bullish and CHF is bearish, Currently Price is on 4hrs supply zone. From this point expected seller take position and move price downward trajectory in trend direction.

BNB Analysis (12H)As you can see, the Binance Coin structure has turned bearish, but we should not forget that the BNB support zone is not far away.
In the demand zone, we can look for buy/long positions.
The targets are marked on the chart.
A daily candle closing below the invalidation level will invalidate this analysis.
Do not enter the position without capital management and stop setting
Comment if you have any questions
thank you

BNB has cleared an important resistance level (12H)We have a shift in outlook for BNB.
Price has cleared a key supply zone, and now we can look for potential buy/long positions around the demand area.
The targets are marked on the chart.
A daily candle closing below the invalidation level would invalidate this analysis.
Do not enter the position without capital management and stop setting
Comment if you have any questions
thank you

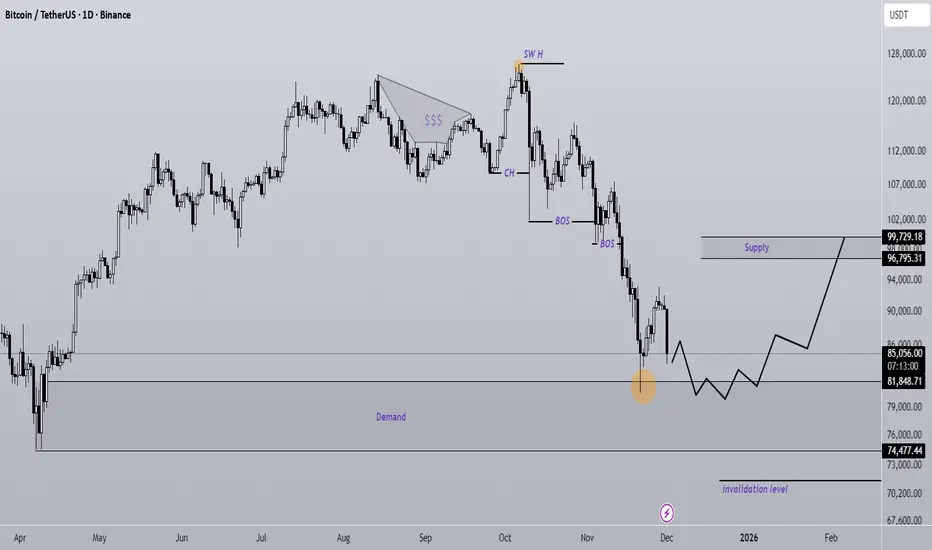
Bitcoin new update (1D)Bitcoin has not yet fully absorbed the buy orders in the marked support zone. This time, upon tapping the support area again, we can expect the price to form a stronger bullish move, at least toward the identified supply zone.
A daily candle closing below the invalidation level will invalidate this outlook.
Do not enter the position without capital management and stop setting
Comment if you have any questions
thank you
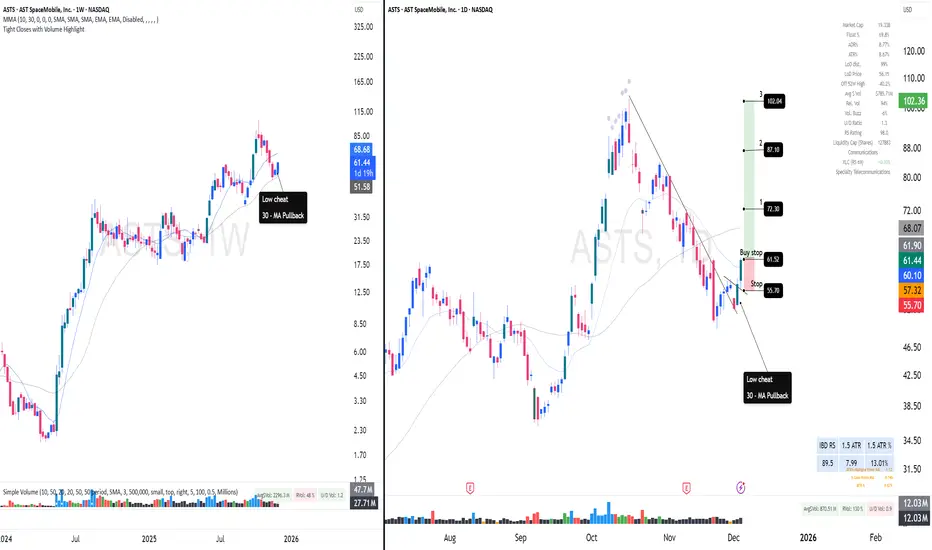
ASTS LongReasoning:
Strong Industry/Sector
50MA Pullback
If Labelled a Swing trade(2-6 Week Holds)
Entry: Full position on breakout
Profit Taking: Sell 1/3 at Goal 1
Final Exit: Remainder at Goal 2
If labelled a long term trade (3-12 Month Holds)
Entry: Full position on breakout
Profit Taking: Sell 1/4 to 1/5 at Goal 1
Exit Signal: Close below 20-day EMA (your trend guide) or 50EMA
Why: Strong moves are hard to time at the top, but the 20EMA acts as a reliable trend filter
Note:
Remember: Every long-term investment alert can also be played as a swing trade.
#GBPCAD: Swing Buy Activated Get Ready For Next Big Thing±GBPCAD moving nicely from our previous trading setup where we had pointed out two possible reversal zones. Where price moved and reversed as we had expected from our zone one. We expect price to continue moving upwards and towards our target one and then later on our target two.
If you want to support us then please consider liking and commenting the idea which will help us post more such analysis.
Team Setupsfx_

NEAR Looks Bullish (4H)In the orange circle, liquidity has been swept, and the price has reacted to a strong historical demand zone.
After the change of character (CH), we can enter a buy/long position on the pullback.
The targets are marked on the chart.
If the stop-loss is touched, the setup will be invalidated.
Do not enter the position without capital management and stop setting
Comment if you have any questions
thank you

Nifty Analysis EOD – December 3, 2025 – Wednesday🟢 Nifty Analysis EOD – December 3, 2025 – Wednesday 🔴
25900 Holds: Buyers Force Doji After 170-Point Plunge.
🗞 Nifty Summary
The Nifty started with a bearish continuation sentiment, leading to a deep plunge of 170 points in the first half of the session. The selling pressure was halted around the 25900 level, where the index successfully found a base and stayed range-bound within approximately 35 points.
The 25950 level acted as a strong hurdle, trapping buyers multiple times. However, in a last-hour push, the index managed to breach this hurdle and successfully tested the psychological 26K mark before closing at 25,986.00, resulting in a loss of -46.20 points (-0.18%).
The day’s close was below the PDL and the 26K level, but the strong defense and recovery from the 25900 support zone are key takeaways. The resulting Daily Candle forms a Doji-like structure right on this important support, signaling potential base-building.
🛡 5 Min Intraday Chart with Levels
🛡 Intraday Walk
The day was marked by strong directional movement in the first hour, followed by dull consolidation within the Initial Balance (IB) range near the bottom. The deep dive confirmed the strong short-term bearish bias following the previous day’s close. However, the subsequent 95-point lower wick confirms that institutional buyers aggressively stepped in at the 25900 zone.
This strong support response is the most positive takeaway. The tight range consolidation near 25950 was eventually overcome, but the failure to close above 26K leaves the short-term bias ambiguous.
📉 Daily Time Frame Chart with Intraday Levels
🕯 Daily Candle Breakdown
Open: 26,004.90
High: 26,066.45
Low: 25,891.00
Close: 25,986.00
Change: −46.20 (−0.18%)
🏗️ Structure Breakdown
Type: Bearish candle (small body) — Doji-like Indecision.
Range (High–Low): ≈ 175 points — indicating elevated intraday volatility.
Body: ≈ 19 points — very small body, highlighting indecision with a slight bearish tilt.
Upper Wick: ≈ 62 points — buyers attempted upside but faced resistance quickly.
Lower Wick: ≈ 95 points — strong buying response from lower levels, forming a large lower shadow.
📚 Interpretation
The small real body and the long lower wick are classic signs of a potential base-building effort. The strong buying from the 25,891 low shows aggressive defense of the support zone. However, the close below 26K means the selling pressure hasn’t been completely negated. We need to watch closely to see if the market honors this Doji by reversing (bullish signal) or continuing the fall (bearish signal).
🕯 Candle Type
Indecision Candle with Bullish Lower-Wick Support — Next candle direction will decide short-term trend continuation or reversal.
🛡 5 Min Intraday Chart
⚔️ Gladiator Strategy Update
ATR: 193.38
IB Range: 144.6 → Big
Market Structure: ImBalanced
Trade Highlights:
11:33 Long Trade - Target Hit (R:R 1:2.33) (Trendline Breakout)
Trade Summary: The volatile initial plunge set a wide range. The strategy successfully capitalized on the strong reversal from the day’s low, capturing the long trade following the trendline breakout after the initial sell-off stabilized.
🧱 Support & Resistance Levels
Resistance Zones:
26030 ~ 26075
26104
26132 ~ 26160
26220
Support Zones:
25985
25930 ~ 25920 (Immediate Base)
🧠 Final Thoughts
“The Doji is the pause button.”
The key now is the 25900 level. Today’s action confirms that buyers are actively defending this psychological zone.
If tomorrow’s session trades and closes above the high of today’s Doji (26,066), we should see a resumption of the upward journey toward 26132. If the market breaks and sustains below 25,891, the short-term bearish move will continue toward 25850.
✏️ Disclaimer
This is just my personal viewpoint. Always consult your financial advisor before taking any action.
