LUNC Analysis (4H)LUNC has moved sharply and without any correction toward the strongest supply zones and has absorbed a large amount of liquidity. Moves like this are not trends; they are impulsive pushes meant only to sweep liquidity.
In my view, sufficient liquidity has now been collected, and the market should enter a phase of price and time correction, gradually and calmly moving toward lower levels while forming a time-based correction.
The supply zones and targets are marked on the chart.
A daily candle close above the invalidation level would invalidate this analysis.
Do not enter the position without capital management and stop setting
Comment if you have any questions
thank you
Pivot Points

Nifty Analysis EOD – December 12, 2025 – Friday🟢 Nifty Analysis EOD – December 12, 2025 – Friday 🔴
Bullish Confirmation: 26030 Conquered!
🗞 Nifty Summary
The Nifty successfully followed through on yesterday’s strength, opening with a 90-point Gap Up above the PDH and immediately targeting the next resistance level.
The index marked its initial high at 26,038.4 but faced a sharp rejection, causing a full retracement back toward the day’s low. This sharp move proved to be a successful bear trap, as buyers defended the base.
The market then recovered fully, pushing back to the day’s high zone. The session closed strongly at 26,037.15, comfortably above the 26030 resistance level.
Despite the narrow range and multiple fakeouts that troubled intraday traders, the strong closing structure reinforces the bullish bias. Bulls have now cleared the 25920 ~ 25930 resistance and must now conquer the next major hurdle at 26104 to sustain the momentum.
🛡 5 Min Intraday Chart with Levels
🛡 Intraday Walk
The day’s narrative was defined by high volatility within a very narrow range. The initial gap-up hit the target resistance and triggered the sharp rejection, but the failure of sellers to break the day’s low confirmed strong underlying demand.
The rest of the day saw the Nifty hover near the Day High/IBH, with multiple false attempts to breach the IBH. This narrow, choppy consolidation was necessary after the strong move from the 25700 base. The close at 26,037.15 is strategically important as it converts the 26030 resistance into new support, setting the stage for the next upward push.
📉 Daily Time Frame Chart with Intraday Levels
🕯 Daily Candle Breakdown
Open: 25,971.20
High: 26,057.60
Low: 25,938.45
Close: 26,046.95
Change: +148.40 (+0.57%)
🏗️ Structure Breakdown
Type: Bullish candle with a strong body.
Range (High–Low): ≈ 119 points — controlled volatility.
Body: ≈ 76 points — healthy bullish follow-through.
Upper Wick: ≈ 11 points — minimal rejection near highs.
Lower Wick: ≈ 33 points — buyers absorbed early selling pressure.
📚 Interpretation
The candle is strongly bullish, reinforcing the strength seen in the previous session’s recovery. The healthy body size and the close near the day’s high with minimal upper wick suggests bulls maintained control and are positioned for a continuation move. This structure invalidates the short-term bearish arguments and confirms the upward trend.
🕯 Candle Type
Bullish Continuation Candle — Indicates buyers maintaining momentum; trend strength remains intact.
🛡 5 Min Intraday Chart
⚔️ Gladiator Strategy Update
ATR: 203.87
IB Range: 75.30 → Medium
Market Structure: ImBalanced
Trade Highlights:
10:26 Short Trade - SL Hit (IBL Breakout)
14:08 Long Trade - SL Hit (IBH Breakout)
Trade Summary: The tight, volatile, and range-bound nature of the session, coupled with multiple fakeouts, created a difficult environment for the strategy, resulting in two stop-loss hits. The market lacked clear directional follow-through after the initial sharp reversal.
🧱 Support & Resistance Levels
Resistance Zones:
26070
26104 (Next Major Hurdle)
26155
Support Zones:
25985
25930 ~ 25920 (Polarity Flip Support)
25890
🧠 Final Thoughts
“The 26104 gate awaits the bulls.”
The strong close above 26030 successfully converts this level into immediate support. The immediate support zone is now 25920 ~ 25930, which was the major resistance just yesterday—a perfect polarity flip. The key focus for the next session is the 26104 resistance. A decisive move above this level will maintain bullish momentum and target 26155.
✏️ Disclaimer
This is just my personal viewpoint. Always consult your financial advisor before taking any action.

Nifty Analysis EOD – December 11, 2025 – Thursday🟢 Nifty Analysis EOD – December 11, 2025 – Thursday 🔴
Bulls Recapture Lost Ground: Strong Recovery Confirms Demand at 25700 Base.
🗞 Nifty Summary
Despite early indications from Gift Nifty suggesting a large Gap Up, the Nifty only opened up 27 points. It immediately filled the gap, testing the 25800 level, and sharply faced rejection, falling below 25700 to mark a low at 25,693.25.
This aggressive dip served to trap bears before a powerful V-shaped recovery began. Buyers stepped in decisively at the 25715 ~ 25740 support, breaching the Day High and testing 25840, and gradually reaching 25900.
Multiple attempts to conquer the strong overhead resistance zone of 25920 ~ 25930 failed, but the Nifty successfully closed near the day’s high at 25,898.55. This strong bullish close recaptures the ground lost yesterday and shows a decisive change in short-term sentiment.
🛡 5 Min Intraday Chart with Levels
🛡 Intraday Walk
The day started with a crucial test: the early breakdown below the PDL was swiftly negated by strong buyer defense at the 25700 level.
This V-shaped recovery confirms the conviction of the bulls at the key support base. The remainder of the session was a sustained, steady grind upward.
The most significant takeaway is the successful close near the PDH, signaling strong momentum.
However, the consistent rejection at 25920 ~ 25930 confirms this remains the most immediate and difficult overhead supply zone.
📉 Daily Time Frame Chart with Intraday Levels
🕯 Daily Candle Breakdown
Open: 25,771.40
High: 25,922.80
Low: 25,693.25
Close: 25,898.55
Change: +140.55 (+0.55%)
🏗️ Structure Breakdown
Type: Bullish candle with a strong lower wick.
Range (High–Low): ≈ 230 points — high intraday activity.
Body: ≈ 24 points — minor profit booking near highs.
Upper Wick: ≈ 83.6 points — strong rejection near the day’s high
Lower Wick: ≈ 78 points — decisive buying from lower levels, forming a long lower shadow.
📚 Interpretation
The candle is strongly bullish, demonstrating that despite the sharp early volatility, demand aggressively absorbed the selling pressure. The strong body and close near the high signals that bulls have regained control of the short-term trend. The long lower wick suggests the low of the day served as a successful bear trap, and the rally has strong underlying support.
🕯 Candle Type
Bullish Candle with Strong Lower-Wick Support — Indicates demand dominance and potential continuation if follow-up buying appears.
🛡 5 Min Intraday Chart
⚔️ Gladiator Strategy Update
ATR: 203.87
IB Range: 109.80 → Medium
Market Structure: Balanced
Trade Highlights:
11:17 Long Trade - Target Hit (R:R 1:2.15) (IBH Breakout + Vwap & Trendline support)
13:07 Short Trade - SL Hit (Contra Trade : Trendline Breakout)
Trade Summary: The volatile reversal day provided mixed results. The strategy successfully captured the core bullish trend with a high R:R long trade following the confirmed recovery, but the attempt to catch the trendline failure later in the day resulted in a stop-loss hit.
🧱 Support & Resistance Levels
Resistance Zones:
25930 ~ 25920 (Immediate Polarity Flip Resistance)
25985
26030
Support Zones:
25740 ~ 25715 (Critical Immediate Base Support)
🧠 Final Thoughts
“The 25920 zone is the key to unlocking the next 26,000 target.”
The bulls successfully reclaimed the ground lost yesterday, and the 25715 ~ 25740 support is now confirmed as a strong base. The immediate challenge for tomorrow is the 25920 ~ 25930 resistance. If this is broken and held, a short covering rally could quickly trigger toward 26030 and potentially 26104. A break and sustain above 26104 would be a very strong signal for a broader reversal.
✏️ Disclaimer
This is just my personal viewpoint. Always consult your financial advisor before taking any action.

ZEC — Another -50% Drop AheadZEC has had one of the wildest runs this year, a +2000% explosion from August to November, all in just 80 days, before topping out at $750. Moves that go vertical like this tend to unwind just as aggressively, and ZEC did exactly that: a sharp –60% correction back into the $300 support zone.
That reaction wasn’t random, $300 was a major confluence level:
0.618 Fib retracement of the entire +2000% move
Weekly level lining up cleanly
0.786 Fib of the smaller impulsive wave
Altogether, an ideal spot for a bounce and that’s exactly what we saw. Looking at the current structure, here’s what I’d like to see next:
1. A move toward $500 → Short opportunity
$500 should now act as a psychological resistance level and would be the perfect area for a rejection.
2. A drop into the $250 region → Long opportunity
This zone is stacked with confluence:
0.702 Fib sweet-spot entry of the entire move
0.886 Fib retracement (deep retrace zone)
Weekly order block
Anchored VWAP
Monthly level
POC
This makes $250 a very attractive long-entry, with a simple target back toward $300.
Educational Insight
Parabolic moves like ZEC’s +2000% rally in such a short time almost never resolve sideways. When price accelerates this fast, the market typically needs time to rebalance value. This usually happens through deep retracements and distribution structures.
The first major retrace to the 0.618 Fib often acts as a relief bounce, which we already saw around $300. This bounce doesn’t mean the trend is healthy again it usually represents short covering and dip-buyers stepping in early. Structurally, these bounces often lead to lower highs, forming patterns like Head & Shoulders or broader distribution ranges.
Deeper retracement levels such as the 0.786 and 0.886 Fib tend to be where strong hands accumulate, especially when they align with:
Anchored VWAPs (fair value over time)
High-volume nodes (POC)
Higher-timeframe order blocks
Monthly or weekly levels
This is why the $250 zone stands out. It’s not just “another support”, it’s where multiple market participants agree on value, which increases the probability of a meaningful reaction.
On the flip side, psychological levels like $500 often attract late buyers and breakout traders during corrective rallies. When momentum fades into these areas, they frequently become ideal zones for short entries, especially if volume dries up or rejection wicks form.
Key takeaway:
Instead of chasing fast moves, focus on where value is likely to be defended or rejected. High-probability trades are built where structure, Fibonacci, volume, and VWAP all align.
In summary:
ZEC is offering two solid setups → one on the short side near $500, and one long near $250. Set alerts on both levels and wait for the reaction.
_________________________________
💬 If you found this helpful, drop a like and comment!

Natural Gas Week 50: -183 BCF Draw – Coldest Start in Years*Due to the platform's features, the charts are arranged in sequence from left to right, from the first to the ninth chart. The charts were created by our team and based on an analysis from Bloomberg and the EIA data. This analysis was conducted in cooperation with Anastasia Volkova, analyst of LSE.
Natural gas entered Week 50 with a historic shift, as the EIA reports a record 183 BCF storage withdrawal for Week 49 (December 5), crushing the 5-year average draw of -72 BCF and leaving inventories at 3,740 BCF-34 BCF below 2024 but still 56 BCF above the median. Cold weather and peak LNG exports earlier drove January futures above $5/MMBtu, but softening forecasts for mid-December have triggered profit-taking, easing near-term prices while 2026-27 contracts hold above the interquartile range.
Current prices compared to price dispersion 10 days before expiration by month since 2010
Last week, cold weather and record LNG flows provided strong support for prices. The situation has now evolved, with signs of a correction due to profit-taking and a softening of weather forecasts for the second half of December. However, fundamental drivers (a prolonged cold spell in key regions, peak LNG exports, and growing demand from the energy sector) remain in place and are keeping 2026 and 2027 contract prices above the interquartile range.
Forward curve compared to 2020-2025
The shape of the 2025 forward curve on nearby contracts is once again approaching the 2023–2024 ranges. Despite high volatility on nearby contracts, contracts with delivery in two years and beyond continue to show clear price stabilization at historically stable levels.
Current stocks and forecast for next week compared to 2020-2024
According to the forecast for week 49 (EIA report dated December 5), gas reserves in underground storage facilities will decrease by a record 183 BCF, which is 111 BCF below the average for the past five years. At the same time, reserves will reach 3,740 BCF, which is 34 BCF lower than in 2024, but 56 BCF higher than the five-year average.
HDD+CDD based on current NOAA data and forecast for the next two weeks compared to 1994-2024
Currently, the total HDD + CDD (heating and cooling degree days) indicators for all climatic regions of the United States are within the moderate range relative to the 30-year climate norm. According to meteorological model forecasts, degree days are expected to increase after December 11, reaching maximum levels by December 14-15, after which they will begin to decline, and by December 17-19, values may fall below seasonal norms.
HDD+CDD based on current NOAA data and forecast compared to 1994-2024 by region
As of December 10, another peak in degree days is expected in the coming week, with values exceeding the upper interquartile range in the central regions of EN, ES, WN, WS, and South Atlantic. After December 18, the weather is expected to stabilize and return to average levels and below.
Daily supply/demand difference compared to 2014-2024
On December 10, the difference between supply and demand in 2025 declines after abnormal growth and approaches the upper interquartile range for 2014–2024.
Number of days for delivery from warehouses
The graph shows the number of days of supply based solely on storage reserves, at current consumption levels. As of December 10, reserves are sufficient for approximately 27 days, which is three days less than in 2024, seven days below the average, and at the lower end of the 10-year range. With this level of reserves and consumption, even minor disruptions in production or spikes in demand could cause sharp price reactions, especially in late winter and early spring.
Filling level of European storage facilities
The overall fill rate of European gas storage facilities as of December 10 continues to decline and stands at 71.5% (-4.4% over the week), which is 10.5% below the average fill rate and 10% lower than last year.
Electricity generation by source
Compared to last week, gas generation in the US48 energy balance fell to 38.4% of the total (-5% over the week) on December 10, 2025. The share of nuclear generation remains around 18-19% and is below the 5-year low. The share of coal generation has grown and remains at an average of 19-20%. The share of wind (11.3%) and solar (4.0%) has increased slightly compared to last week.

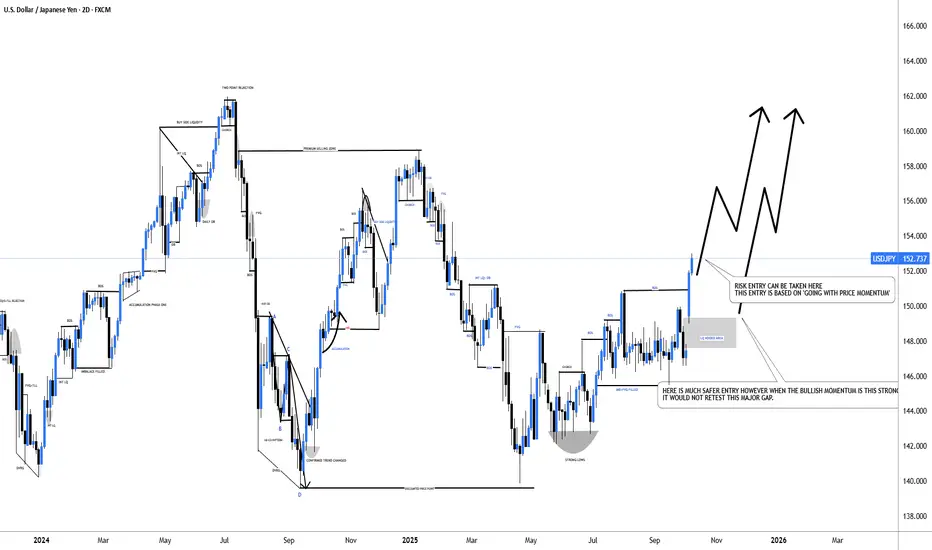
#USDJPY: From +1100 Pips To +1350 Pips A Possible Swing BuyDear Traders,
I hope you’re all having a great trading week!
The USDJPY is currently trading in a 152 price range and is experiencing extreme bullish momentum. The price is rallying without making any corrections, primarily due to the collapse of the Yen. We may see it fall further below. Given this market condition, it’s much riskier to trade with USDJPY.
Here are two approaches you may consider:
1. Take the entry at the current trading price with an accurate stop loss while using a smaller timeframe.
2. Wait for the price to return to the liquidity gap area, where it’s expected to fill.
Good luck, and thank you for your support throughout.
We appreciate your support.
Team Setupsfx_
AUDJPY: +400 Pips Possible Buying Opportunity! Dear Traders,
AUDJPY is likely to continue the bullish price momentum up until 104, currently price has reversed from a critical point. You may consider buying at this moment with a proper risk management. Please use strict management while trading and use this analysis for educational purposes only.
Please like and comment for more!
Team Setupsfx_❤️🏆

#XAUUSD(GOLD):+1300 Pips Move Before Our Swing Sell Entry ActiveGold is likely to continue bullish move where we expect price to hit around 4380 area or 4400. This our intraday approach and before our sell entry get activated which will be our swing entry. There is only one target for this setup which is 4390$. You can adjust stop loss and take profit based on your own view.
If you like our work then do consider liking and commenting the idea.
Team Setupsfx_

Robinhood pretends to chill, but the chart exposes its ambitionsRobinhood pretends to wander, but the chart already knows its destination
HOOD closed at 123.08 on the daily chart and is moving toward the buy zone 116.54–120.86, aligned with the ma100, which forms a strong demand area. As long as price stays above the intermediate support near 120.00, the bullish structure remains valid. The expected scenario is a controlled pullback into 116.54–120.86 followed by accumulation and a fresh upward impulse.
Once demand confirms, the first major resistance is 138–146. A breakout above that level opens the road to the primary target 180.36. Fibonacci aligns cleanly with the structure: 0.618 at 119.54, 0.5 at 123.86, 0.786 at 110.38 remain key tracking levels.
Fundamentally as of December 12 2025, Robinhood is delivering strong performance. Active users exceed 26.5M, trailing revenue is near 2B USD, and options revenue is up more than 18 %. Cash reserves surpass 5.7B USD with minimal debt. Robinhood Retirement, lending products and the fast growing Gold Membership continue expanding monetization. User activity remains high with more than 6M daily trades.
Price has not yet reached the demand zone, but volume behavior and moving averages suggest a strong upcoming entry point. Robinhood looks casual, but the chart hints that something bigger is brewing.

BTC CME GAP (4H)Bitcoin has a CME gap in the $89,805 – $89,425 range
These gaps are usually filled before the price makes its next move.
Let’s see what happens.
For risk management, please don't forget stop loss and capital management
Comment if you have any questions
Thank You

ESPR 1W: cholesterol therapy for patients and investors alikeEsperion Therapeutics (ESPR) has broken its long descending trendline and retested the $2.4–$2.6 support area, forming a solid triple bottom with rising volume. The stock is now holding above key moving averages, signaling accumulation. While above $2.5, the technical setup points to a move toward $6.4, aligning with major resistance and the 200-week MA.
Fundamentally, the company enters one of its strongest phases in years. Following earlier liquidity struggles, Esperion has stabilized its operations and regained investor confidence. The core growth driver is Nexletol (bempedoic acid), a non-statin cholesterol-lowering therapy for patients intolerant to statins. In 2025, combined Nexletol and Nexlizet sales jumped over 45% year-on-year, surpassing $170 million for the first nine months. Recent safety data were positive, leading to new approvals across Europe and Japan - expanding partnerships and licensing revenues. Cash position strengthened via milestone payments from Daiichi Sankyo and Viatris, reducing debt and supporting R&D without new dilution. Challenges remain: profitability is still out of reach, as marketing and development expenses stay high, though liquidity provides breathing room. The broader biotech sector’s rebound amid rate-cut expectations adds tailwind to revenue-backed small caps like Esperion.
Tactically, holding above $2.5 keeps the bullish trajectory intact toward $6.4. A weekly close below $2.3 would negate the setup and re-test lower support, though current accumulation favors the upside.
Esperion helps reduce cholesterol - ironic that its chart still raises investors’ heart rate.

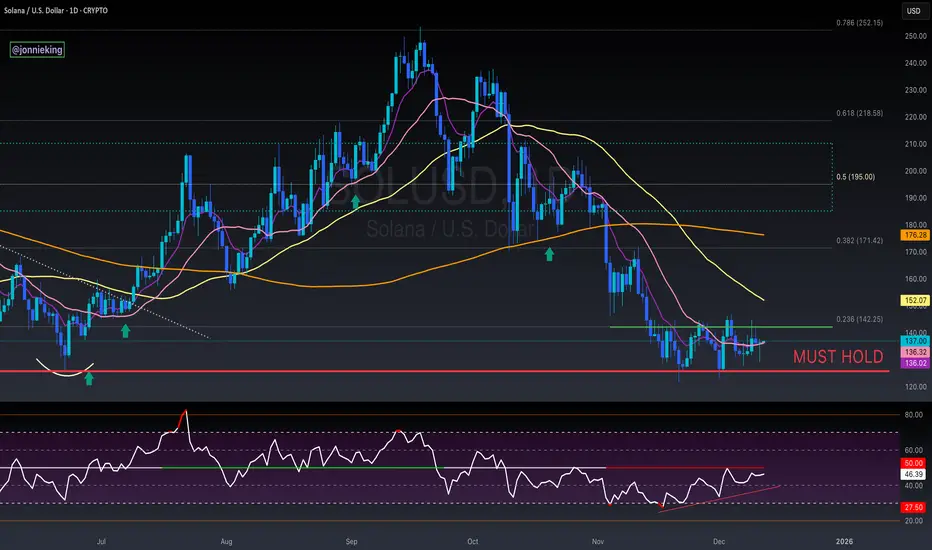
$SOL Stuck In ConsolidationSolana has been stuck in this consolidation range the past month ~$125 - 145
Truly an infliction point for CRYPTOCAP:SOL
a break in either direction should be massive upside or downside.
HOPIUM: bullish divergence appears to be forming on the RSI
Solana Breakpoint just kicked off today, but the market showed very little interest.
Bulls need a huge injection here.
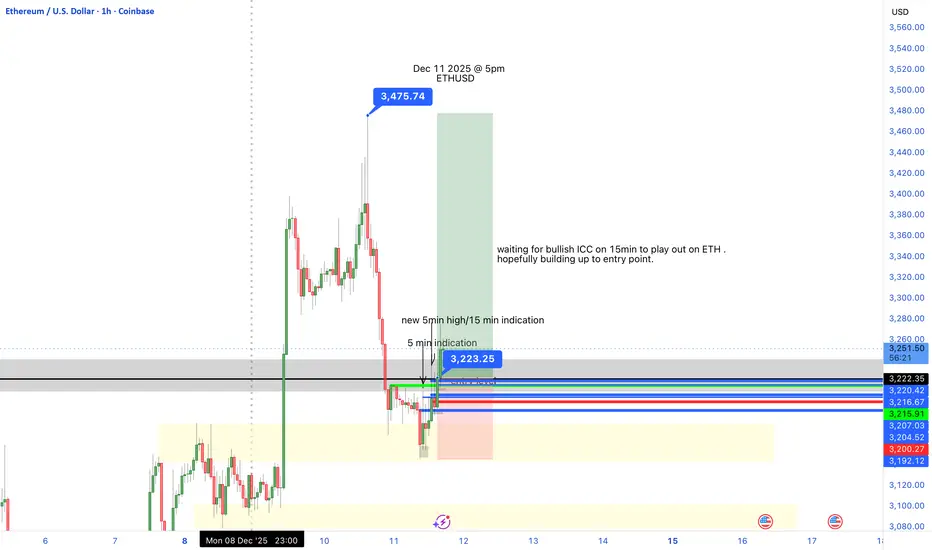
ETH bull planfollowing the ICC concept where bullish structure of higher lows and higher highs were started on the 5 minute, im trying to catch the continuation to the upside after confirming an indication correction and now hopefully the continuation from the 1 and 4 hr. aiming for a new high
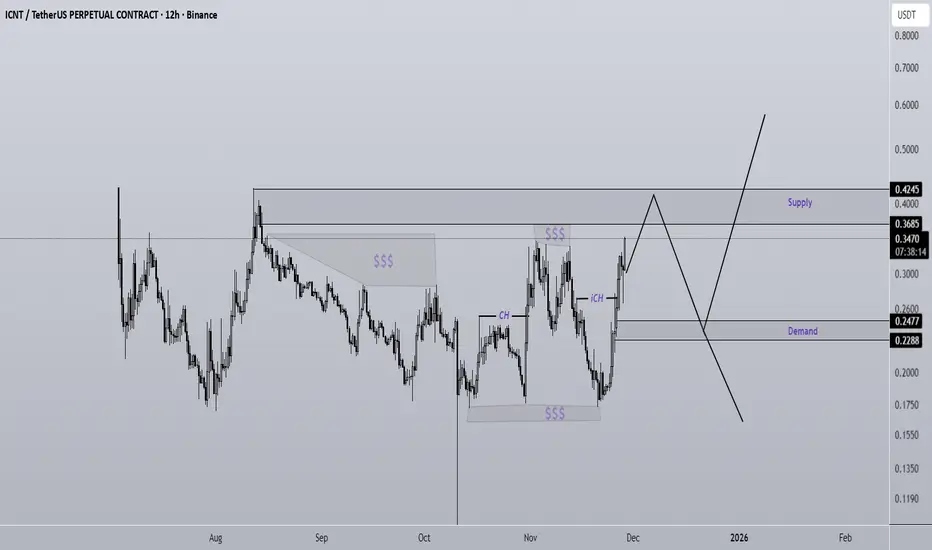
ICNT Analysis (12H)Considering the large liquidity pools that have been collected and the price reaching an origin of movement, the probability of a rejection from the supply zone is high.
Since there is liquidity at the bottom of the chart as well, if the price breaks the demand zone, it may move toward the lower liquidity pools. However, if the demand zone holds as support, we could potentially see a new ATH.
Let’s wait and see what happens
Do not enter the position without capital management and stop setting
Comment if you have any questions
thank you
USDCHF | Long IdeaUSDCHF tapped into Previous Weekly Low and showed a reaction.
I am bullish on this so these are the POI's I look for to make entry.
If price closes under this level, I will be looking for lower POI's to find a new entry points.
Let me know what you think.
Stay safe out there and do your own due diligence, this is not investment advise!

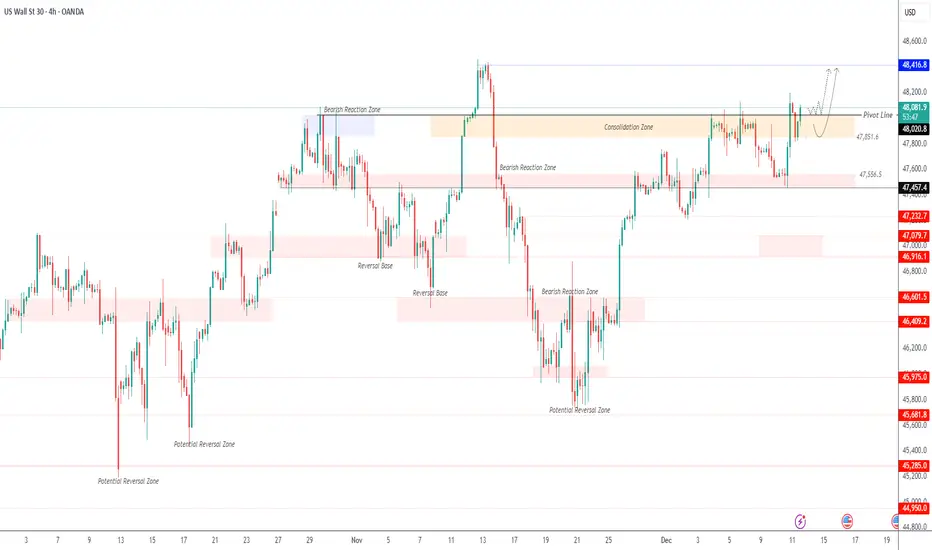
US30 Testing the Pivot Before Next MoveUS30 – Technical Overview
The Dow Jones (US30) gained 1.1% after the Fed’s rate cut, pushing the index within 200 points of a new all-time high. Futures later turned slightly positive, with US30 outperforming Nasdaq and S&P 500 despite weakness in tech.
US30 is attempting to stabilize above the 48020 pivot line. A breakout above this level on a 4H close would support a move toward the previous all-time high at 48415.
A correction remains possible toward the pivot or slightly below it, with 47850 acting as a key pullback level before any renewed bullish momentum.
A 4H break below 47850 would confirm bearish pressure toward 47560 and 47460.
Pivot: 48020
Resistance: 48415 · 48690
Support: 47850 · 47560 · 47460
XAUUSD M15 BUYSPrice is approaching an M5 DEAMND zone, suggesting potential rejection and continuation to the upside. That's a classic Last Point of Support

Dollar Index at Critical Support — Is a Big USD Rally Coming?Today I want to analyze the DXY index( TVC:DXY ) for you, which is one of the key indices in the financial markets.
At the moment, the DXY index is moving near a support zone($98.85-$98.50), Monthly Support (1) level, and the 21_SMA(Weekly).
In addition, the DXY has been trending inside a descending channel for roughly the past 13 trading days.
The main question is whether the DXY can break below this confluence of support levels or not.
Looking at the 4-hour chart, we can identify a Morning Star candlestick reversal pattern, and there is also a clear bullish Regular Divergence (RD+) between the last two lows.
Moreover, the US 10-Year Government Bond Yield ( TVC:US10 ) appears bullish in my view — and its upward movement can potentially support a rise in the DXY as well.
From my perspective, the best currency pairs to capitalize on a stronger USD are USDJPY( FX:USDJPY ) and EURUSD( FX:EURUSD ).
We should also keep in mind that several important US economic indicators will be released this week, which could significantly impact market direction. So be extra cautious with your positions, especially during data releases:
JOLTS Job Openings➡️09 December
Federal Funds Rate➡️10 December
FOMC Statement➡️10 December
FOMC Press Conference➡️10 December
Unemployment Claims➡️11 December
I expect that once the DXY breaks above the upper line of the descending channel, it could at least move toward one of the higher Fibonacci levels.
Do you think the U.S. interest rate will be cut this week?
💡 Please respect each other's opinions and express agreement or disagreement politely.
📌U.S. Dollar index Analysis (DXYUSD), 4-hour time frame.
🛑 Always set a Stop Loss(SL) for every position you open.
✅ This is just my idea; I’d love to see your thoughts too!
🔥 If you find it helpful, please BOOST this post and share it with your friends.

THE Analysis (1H)Considering that THE is currently accumulating liquidity and approaching the supply zone, we can look for sell / short positions in this area.
The targets are marked on the chart.
Do not enter the position without capital management and stop setting
Comment if you have any questions
thank you

SAPIEN Analysis (1H)A structural change (CH) has formed to the bearish side, and now during pullbacks we are looking for Sell/Short positions.
Targets have been marked on the chart.
A 4H - candle closing above the invalidation level will invalidate this analysis.
Do not enter the position without capital management and stop setting
Comment if you have any questions
thank you

NZDUSD: Bullish Trend Continues 🇳🇿🇺🇸
There is a high probability that NZDUSD will continue
rising after a retest of a recently broken horizontal structure.
I expect a growth at least to 0.5814
❤️Please, support my work with like, thank you!❤️
I am part of Trade Nation's Influencer program and receive a monthly fee for using their TradingView charts in my analysis.

ETH Long-Term Ultra Bullish Outlook | Smart Money Zones TradeWithMky Analysis — Weekly Timeframe
Ethereum continues to respect major Smart Money levels, forming a broader accumulation structure inside a high-value demand zone. Price has tapped into the deeper support region where institutional long orders historically activate. As long as ETH holds above these Smart Supports, the long-term structure remains bullish.
A liquidity sweep and deeper retracement toward the $2.4k–$2.1k Smart Support zone could create the perfect Miracle Shot entry, aligning with my strategy’s rule of waiting for exhaustion + re-accumulation before the impulsive leg.
If price respects this zone, the next major target sits at the Smart Resistance around $4,700, which also aligns with a potential long-term breakout and continuation into an ultra-bullish expansion phase.
Key Zones:
Smart Supports: $2,162 – $1,799 – $1,517
Long Accumulation Zone: $2,400 – $2,700
Major Breakout Target: $4,772
This chart outlines a clean roadmap for a future bullish rally, with high-probability long opportunities if price retraces into the smart-money demand zones.
Stay patient. Wait for the setup.
The Miracle Shot always comes to those who wait.

Fifth Spot XRP ETF Set for Launch After CBOE ApprovalThe fifth XRP ETF product is set to begin trading following new approval from the Cboe. This would place the fund in the company of other ETFs that have since recorded over $950 million inflows in less than four weeks.
Cboe Clears Path for New XRP ETF Under Ticker TOXR
The Cboe has approved the listing of 21Shares’ upcoming XRP fund, which will trade under the ticker “TOXR.” This approval was disclosed in a filing to the SEC. The fund will start trading on the exchange once it meets the final requirements.
The current approval brings the list to five different U.S. spot XRP-related funds. This approval comes after 21Shares made its fifth update to its S-1 registration earlier this week to complete the final steps before the launch.
The filing still carries a “delaying amendment.” This means the issuer may be awaiting a CERT notice or direct SEC approval.
Once launched, the XRP ETF will track the CME CF XRP-Dollar Reference Rate, New York Variant. This would expose investors to XRP price performance without having to custody the token. 21Shares publicly hinted at its upcoming launch on X.
The 21Shares TOXR fund is designed to have an annual sponsor fee of 0.3% charged daily and paid weekly in XRP. The issuer improved security and followed regulations by using a system with multiple custodians.
Ripple Markets created initial liquidity for the ETF by providing 100 million XRP. This is currently worth about $226 million. Creation and redemption will be either through in-kind via XRP transfers or via cash settlements.
This would be the latest fund to launch after Franklin Templeton’s spot XRP fund debuted late last month.
XRP Funds Close in On $1 Billion Milestone
The spot XRP ETFs in the U.S. have gathered nearly $1 billion in inflows within less than a month. Total inflows, according to the latest figures, are about $954 million.
Ripple CEO Brad Garlinghouse shared in a post on Monday that XRP has become the fastest-growing U.S. crypto ETF by AUM since Ethereum Demand for regulated products is increasing in the market.
XRP spot funds have not reported any day of net outflows. Just yesterday, despite market fluctuations, it still gained about $10 million in new inflows.
In other news, Ripple released an important update to the XRP Ledger. This update is designed to improve network stability and enhance its DeFi features.
