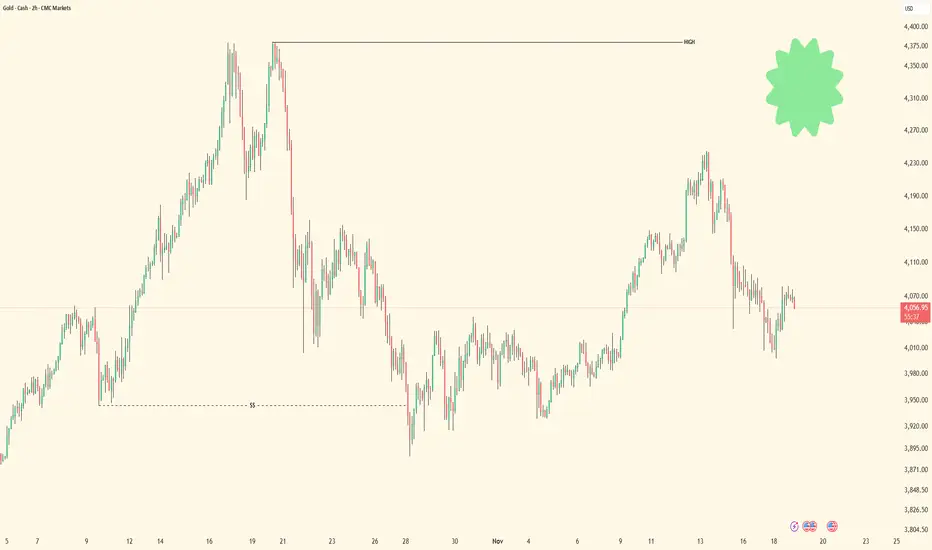
XAUUSD(GOLD): From Previous Setup to this,POV remain the sameGold touched our risk entry and zone and dropped around +800 pips. We expect the price to continue falling and break through the channel. Once we have confirmation, we can focus on the risk area rather than having two selling entries. You can choose from three targets based on your setup. Please manage your risk effectively while trading gold. We wish you the best.
Good luck and trade safely.
Team Setupsfx_
Pivot Points

Nifty Analysis EOD – November 19, 2025 – Wednesday 🟢 Nifty Analysis EOD – November 19, 2025 – Wednesday 🔴
Bulls Reclaim Dominance, Securing a Strong Close Above 26,000
🗞 Nifty Summary
The Nifty opened with a 39-point Gap Up, immediately dipping to find strong support at 25,857.50, which marked the day’s low. From this base, the index began a steady climb, reaching the 25977 resistance without significant hindrance.
After a brief retrace to 25920, the main buying pressure pushed the index into the contentious 26010 ~ 26030 zone. Here, bulls and bears engaged in a strong fight for dominance. Ultimately, the bulls won, successfully breaching 26,040 and marking the day’s high at 26,074.65.
The Nifty closed firmly at 26,052.65, adding +142.60 points (+0.55%) and closing higher than the previous session’s high. This move is a strong indicator of bullish control, completely engulfing the negative candle from the prior day.
For tomorrow, the 25920 ~ 25944 range is critical support, setting the stage for a potential move toward 26104 and higher.
🛡 5 Min Intraday Chart with Levels
🛡 Intraday Walk
The session featured an excellent demonstration of buy-on-dip sentiment. After the initial dip, the price movement was characterized by strong, gradual ascent, indicating institutional participation.
The most challenging part of the day was the consolidation around the 26,000 psychological mark, where high volatility was observed. Although the intraday price action around 26K was tough, the decisive final close near the high confirms that the sellers ran out of steam, and bulls secured dominance.
The daily chart forming an Engulfing Candle is a classic pattern indicating a potential trend continuation with renewed momentum.
📉 Daily Time Frame Chart with Intraday Levels
🕯 Daily Candle Breakdown
Open: 25,918.10
High: 26,074.65
Low: 25,856.20
Close: 26,052.65
Change: +142.60 (+0.55%)
🏗️ Structure Breakdown
Type: Bullish candle, engulfing the previous day’s bearish body.
Range (High–Low): ≈ 218 points — a wide range showing strong intraday activity.
Body: ≈ 134 points — confirming buyers were firmly in control throughout the session.
Upper Wick: ≈ 22 points — mild rejection near the highs, but overall insignificant.
Lower Wick: ≈ 62 points — the early dip was aggressively bought, confirming demand at lower levels.
📚 Interpretation
The strong close near the day’s high indicates solid bullish conviction, completely negating the bearish price action from the previous session. The close above the previous day’s high is a key technical signal. While the move above 26,000 was contested, the resulting Bullish Engulfing Candle on the daily time frame strongly suggests that the bullish momentum is back and possibly accelerating.
🕯 Candle Type
Strong Bullish Candle with Lower-Wick Buying Support — A powerful continuation signal.
🛡 5 Min Intraday Chart
⚔️ Gladiator Strategy Update
ATR: 196.97
IB Range: 77.45 → Medium
Market Structure: ImBalanced
Trade Highlights:
9:32 Long Trade - SL Hit
9:55 Long Trade - Target Hit (R:R 1:1.8)
11:25 Long Trade - Target Hit (R:R 1:3.46)
13:26 Short Trade - Trailing SL Hit
Trade Summary: The volatile nature of the range-bound morning led to an initial loss, but the strategy successfully captured two high R:R long trades during the main directional move upwards. The day’s action provided good two-sided opportunities, but the final outcome confirmed the long side as dominant.
🧱 Support & Resistance Levels
Resistance Zones:
26075 (Day’s High)
26104
26220
Support Zones:
26010 (Psychological Support)
25977
25944 ~ 25920 (Critical Intraday Support)
🧠 Final Thoughts
“The bulls have responded with force. The range battle is over.”
The decisive close above 26,000 has shifted the bias back to the upside. For the continuation, Nifty must clear and hold above 26075. A clean break of 26104 would likely open the path toward 26220. The key level to watch for short-term support is the 25920 ~ 25944 band; as long as Nifty holds here, the path is upward.
✏️ Disclaimer
This is just my personal viewpoint. Always consult your financial advisor before taking any action.

Eose long into pocket I have been watching Eose for a while and it approaches my favorite setup for momentum stocks. The golden pocket is between the teal gold fib lines. My plan would be to enter around here with 3 month calls for another leg up.

XRP Risks Dropping Below $2 as Sentiment Hits “Anxiety” – AnalysA bearish technical chart pattern formation could begin to take effect, triggering a drop in XRP price below $2. Amid the extreme fear sentiment in the crypto market, long-term holders and whales have shifted to the anxiety phase, according to an analyst.
Key Indicator Signals Dip in Long-Term Holders’ Sentiment from “Denial” to “Anxiety” Phase
Glassnode’s XRP Long Term Holder NUPL data indicates that investors are leaning bearish amid heightened uncertainty and volatility in the crypto market.
XRP Long Term Holder NUPL shows “euphoria” in long-term holders ended in mid-2025 itself, which followed massive selloffs by whales. The sentiment has now dropped from “denial” to “anxiety” during the recent crypto market crash.
Meanwhile, on-chain platform Santiment revealed that retail investors holding less than 100 XRP are dumping. It is a sign of a potential rebound during bull markets, but the current crypto market sentiment is bearish.
Notably, XRP supply in profit has dropped to 58.5%, the lowest since November last year when the price was at $0.53. Additionally, 41.5% of the supply sits at a loss despite four times higher trading volumes.
Analyst Predicts XRP Price Fall Below $2
With bulls failing to hold XRP price above key support levels, crypto analyst Ali Martinez predicts a drop below $2 if the Ripple coin drops below $2.15 support.
He shared the UTXO Realized Price Distribution metric that revealed $1.91 and $1.73 are the next key levels to watch in case of further distributions.
At present, crypto traders are closely awaiting key events, including Nvidia earnings, FOMC minutes release, and Nonfarm payroll jobs data, for clues on market direction in the coming weeks. If XRP bulls hold $2.15 level this week, a move to $2.40-$2.70 becomes more likely.
XRP Price Action Slows After Death Cross
XRP price fell 1.7% over the past 24 hours, currently trading at $2.14. The 24-hour low and high are $2.13 and $2.24, respectively. Furthermore, trading volume plunged 35% over the last 24 hours, indicating a decline in interest among traders.
At the time of writing, the price is below the 50-DMA, 100-DMA, and 200-DMA. Also, the formation of a death cross pattern last week triggered a 15% drop in XRP price. Additionally, the relative strength index (RSI) has dropped to 38.44, indicating weakness. The derivatives market shows mixed sentiment in the last few hours, as per CoinGlass data. Total XRP futures open interest dropped more than 1.50% to $3.77 billion in the last 24 hours. However, 4-hour XRP futures open interest climbed 0.75%, rising 0.07% on CME and 2.40% on Binance.

MELANIA Main Trend. Memes with high hype and risk. July 17, 2025Main trend. Time frame 3 days (less is not necessary). Showed conditional levels (zones near them), and percentages of decrease from the maximum (note, I showed from the zone where the main retail of “affected investors” began to connect, that is, the maximum is much lower than on the chart).
Note that now a conditionally large volume “enters”, it is displayed on the price chart (this is important), a sideways squeeze has begun. Local impulse and rollback are now in the moment.
Also showed a large % (intentionally) for orientation, from minimum to maximum zones. On such hype assets, as a rule, medium-term - long-term holding (bought in the right zone) shows significant income.
All level zones are conditional, due to liquidity, but the price will most likely “play” after the breakdown of the downward trend in this range, another alt season (which many do not notice due to the slow breakdown of their opinions, news chaff, and inadequate goals). As for me, above these huge % (resistance zone, or up to 0.869, so as not to waste time), you should get rid of this meme, or its % from the previous position should already be minimal (5-10%).
There are hype zones, there are zones of potential gain (fading hype, interest, and a large % from the maximums). On such assets of "manual trading", where cryptocurrency has no value, it is always sold little by little (many do not understand this), but in order to sell, you sometimes need to make interest, and "instill hope" in previously deceived "investors" who want to get out at least at a loss (it is unlikely to happen). At the right time, 1-2 tweets - statements from the "powers that be" - are pumped up due to low liquidity by a huge percentage.
On such cryptocurrencies, you do not need to guess the “bottom” or maximums. Pricing is formed differently here, as there is no real supply/demand, utility, but only psychology and "hitting the jackpot" of gambling addicts. Be smarter. Diversify such assets, distribute the risk in advance. Make purchases/sales according to plan, without emotions.
When the price goes up, you think it will go much higher, but even if it does, you must sell a certain volume in certain planned zones, without any emotions or sense of lost profit.
Similarly, when the price goes down, people are driven by fear and refuse to buy, and these were probably the minimums of fear.
The average price of the set and reset is important. No minimums and maximums are needed. Be patient and consistent in your actions and plans.

MAN INDUSTRIESMan Industries (India) Ltd. (currently trading near ₹450.20) – Overview Man Industries (India) Ltd., headquartered in Mumbai, is a leading manufacturer of Large Diameter Pipes (LSAW, HSAW, ERW) used in oil & gas, water distribution, and infrastructure projects. Established in 1988, the company has a strong global presence with exports to over 60 countries. Its product portfolio includes coated pipes, stainless steel pipes, and specialty tubes for critical applications.
FY22–FY25 Snapshot • Sales – ₹2,650 Cr → ₹2,950 Cr → ₹3,200 Cr → ₹3,450 Cr Growth driven by strong order inflows in oil & gas and water infrastructure
• Net Profit – ₹145 Cr → ₹165 Cr → ₹185 Cr → ₹210 Cr Earnings supported by scale, export contracts, and margin improvement
• Operating Performance – Moderate → Strong → Strong → Very Strong EBITDA margins improving with high-value contracts and backward integration
• Dividend Yield (%) – 0.60% → 0.65% → 0.70% → 0.75% Consistent payouts alongside reinvestment into expansion and R&D
• Equity Capital – ₹37.5 Cr (constant) Promoter-led governance with no dilution
• Total Debt – ₹720 Cr → ₹690 Cr → ₹660 Cr → ₹630 Cr Gradual deleveraging supported by export cash flows and strong order book
• Fixed Assets – ₹1,050 Cr → ₹1,100 Cr → ₹1,150 Cr → ₹1,200 Cr Capex focused on stainless steel pipe facility in Jammu and H-SAW plant in Saudi Arabia
Institutional Interest & Ownership Trends Promoter holding ~36% FIIs/DIIs selectively invested due to strong infra and oil & gas demand visibility Public float ~64%, with delivery volumes reflecting long-term positioning by infra-focused funds
Business Growth Verdict Man Industries is scaling across oil & gas, water infrastructure, and specialty pipes with strong global client stickiness Margins improving via high-value contracts and backward integration Debt is declining steadily with strong export cash flows Capex supports long-term competitiveness in stainless steel and global expansion
Management Highlights • FY25: Executed large oil & gas pipeline contracts; expanded stainless steel pipe portfolio • Sustainability: Focus on energy-efficient coating and compliance with global standards • Global Expansion: Saudi Arabia H-SAW plant and Jammu stainless steel facility to drive FY27 growth • FY26 Outlook: 12–15% revenue growth, PAT expected to cross ₹240 Cr
Final Investment Verdict Man Industries (India) Ltd. offers a mid-cap infrastructure and oil & gas story built on strong order book, global expansion, and margin improvement. Its improving profitability, disciplined capital structure, and expanding client base make it suitable for accumulation by investors seeking exposure to India’s pipeline infrastructure and global oil & gas theme. With strong execution and global reach, Man Industries remains a durable compounder in the mid-cap manufacturing space.

"The Myth of Confirmation - What Retail Gets Wrong Every Day"🔥 THE TRUTH ABOUT MARKET “CONFIRMATION” (What Retail Never Realizes)
Most traders think confirmation comes from indicators, patterns, candle shapes, or repeating formations on lower timeframes.
This is the greatest misunderstanding in trading.
Confirmation does NOT come from the LTF.
Confirmation comes from alignment of the delivery cycle — and the LTF only expresses what the HTF already decided.
Retail thinks the 5M “creates” trend.
Institutions know the 5M merely reflects it.
Here’s the real breakdown institutions use:
⸻
1. Confirmation = Completion of a Phase, Not a Pattern
A market only confirms when a structural phase fully completes, meaning:
• Liquidity objective hit
• Internal structure reset
• Order flow aligned
• Efficient price or imbalance corrected
• Pullback cycle finished
• New impulsive leg prepared
This is confirmation.
Not a candle.
Not an indicator.
Not a shape on your chart.
⸻
2. LTF Structure Means NOTHING Without HTF Context
Retail loves reacting to:
• 5M BOS
• 1M pullback
• 15M FVG
• Candle patterns
• Trend lines
None of these matter if the HTF hasn’t finished its development cycle.
This is why traders lose:
They see “confirmation” while the HTF is still in a build-up, not a release phase.
⸻
3. The Market Confirms Twice — Retail Only Sees One
Institutional traders track two confirmations:
Macro Confirmation (HTF)
This tells the market what it wants to do next
— continuation or pullback.
Micro Confirmation (LTF)
This tells the market when it’s safe to execute
— trend shift + pullback + OB tap + displacement.
Retail only waits for micro confirmation.
They skip macro confirmation.
So they trade inside noise.
⸻
4. Candles Don’t Confirm — the Cycle Confirms
People over-read 5M candles, ignoring the fact that candles are only expressions of liquidity movement.
You can’t read intent from shape.
You read intent from position in the cycle.
The same candle means:
• continuation in one phase
• reversal in another
• manipulation in another
Only the cycle gives it meaning.
⸻
5. The Market Doesn’t Confirm For You — It Confirms ITSELF
This is the coldest truth most will never learn:
Price never confirms your bias.
Price only confirms where it is in the timeline.
If you don’t know the timeline,
you don’t know the confirmation.
TL;DR
(Beginner/Simple)
Confirmation = Cycle Completion + Alignment
NOT a candle pattern or indicator.
You don’t follow confirmation.
You follow timing.
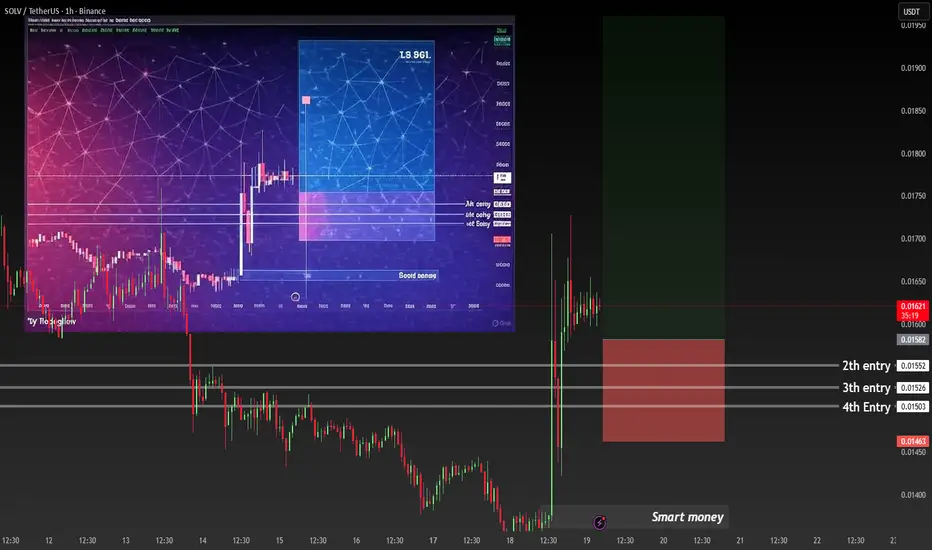
SOLV about to 10x–100x from here | Smart Money quietly loading tThis is NOT Solana ( CRYPTOCAP:SOL ) – this is NYSE:SOLV (Solana VM chain) sitting at the EXACT bottom that printed the +28,000% pump last cycle.
What you’re seeing right now:
- Yearly support held perfectly for 18 months
- Final deviation + reclaim (smart money’s favorite setup)
- 4 layered buy zones I’m filling aggressively: 0.01503 → 0.01526 → 0.01552 → 0.01623
- Volume drying up = calm before the most violent leg up
Last time this level was touched → price went from $0.008 → $2.35 in 4 months.
If you miss this dip, you’ll be buying my bags at $0.50–$1.50 screaming “why didn’t I listen”.
This is the literal “before” picture everyone screenshots in 3 months saying “I was here”.
Not financial advice – just showing you where the rocket fuel is.
#SOLV #100xGem #LowCapSeason #Crypto #Altseason
Screenshot this chart. Thank me in January.
Respect to All Iranian Traders Holding Strong Against Market noiRespect to All Iranian Traders Holding Strong Against Market Noise”
BTC Daily Breakdown
This analysis is dedicated to all my Iranian traders who keep pushing forward, even though TradingView doesn't always give enough visibility to symbols from our region.
We continue learning, improving, and trading with discipline — and that’s what truly matters.
In this chart, price tapped into a key bearish rejection block, failed to reclaim the zone, and continued breaking structure to the downside. The liquidity beneath the previous lows acted as a magnet, and the bearish orderflow remains in control as long as price stays below the rejection zone.
I’ve learned a lot from many international traders whose work has helped strengthen my technical approach.
Much respect to these analysts for their educational content and smart analysis:
@TraderMo @CryptoJelleNL @NaiimTrades @MayfairVentures
@NateFX @LSTraders @CryptoMellany @PAULSTUDY
@MarkCullenFX @KledTrading @TheSignalyst @TraderJupiter
@BrettCrypto @ChartPrime @RJR_Trading @CryptoBrrr
@ZenTradingTech @ElliottWaveStreet @EdgeTrading @Bitcoinsensus
Their insights helped me refine my structure-based approach, especially on BTC’s daily chart.
If you’re from Iran or anywhere else in the world, feel free to drop your view below —
we grow together, we build together.

Liquidity Hunter | Smart Money PlaybookSmart Money Footprint | Market Structure & Liquidity Trader
Hunting liquidity sweeps and smart money footprints across major sessions.
I break down the market the way institutions move it:
SFP • Break of Structure • Premium/Discount • Session Timing • Fakeouts
Daily charts, scalps, and tactical explanations.
Follow if you want to trade with the real flow — not against it.
Drop a comment once at all this information 🤑🔥❤️📉

GBP/USD, GBP/CAD, GBP/AUD Techical SetupsUK CPI data in 8hrs could spark some volatility across British pound pairs. Even so, price action has presented several bearish clues across GBP/USD, GBP/CAD and GBP/AUD.
Matt Simpson, Market Analyst at City Index

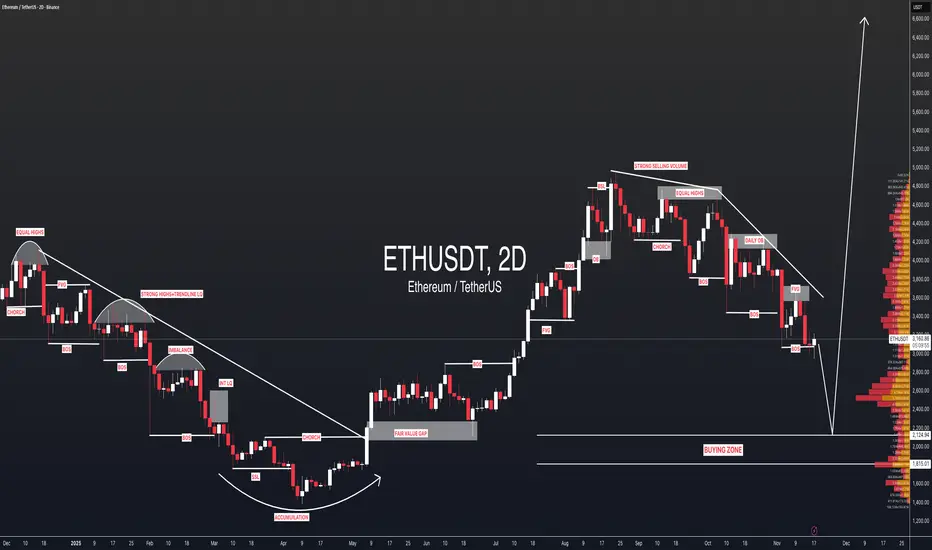
ETHUSDT: First Drop To $2100 And Bounce Up To $6500ETHUSDT is dropping nicely and we expect a smooth reversal around $2200. This area looks promising due to the significant volume sitting there. We just need to avoid liquidation. Once the entry is active, you can enter with strict risk management and set multiple take profit levels. This analysis is suitable for all traders from intraday to swing.
Good luck and feel free to like and comment for more!
Team Setupsfx_
ETH/BTCHere is the range I'm looking at for the ETH/BTC pair. A bounce in this box means buying Ethereum will be more profitable than Bitcoin.

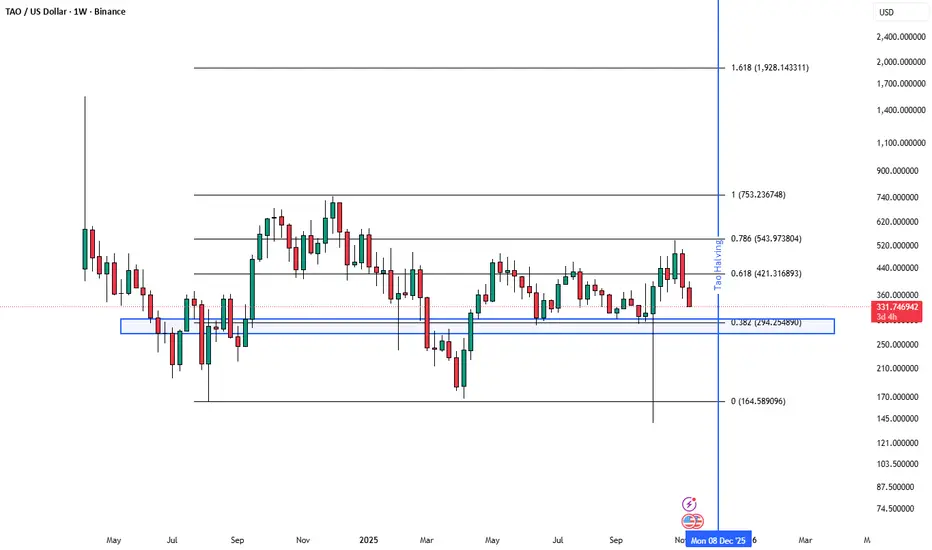
$TAO PlanGETTEX:TAO I put my buy orders in blue box. This is around 300/270 dollars. Also on the montly and weekly chart you can see this is a strong support. With 0.382 fib level around $294, I think this box will hold and we will see a bounce from it.
$Aster low timeframe planTrying this SEED_WANDERIN_JIMZIP900:ASTER short with low risk. We have a resistance here on 4h timeframe and expect the price to dump from this area. But since the market is unsure I'm using low risk for this trade.

$HYPE planSetting bids 40.3/39.5 area for $HYPE. With a support line on 37.77. Rsi below 50 on 1h timeframe. The orange line is an important area on low and high time frame which is why I'm bidding it.

$ETH Macro planI made this CRYPTOCAP:ETH cheatsheet. I'm looking to bid 2900-2700 area. As you can see we lost the level on weekly timeframe. And retesting it this week. A close below means we will likely go to my marked area.

$BTC MacroCRYPTOCAP:BTC following my macro plan. I will start adding in the purple box. We might get a short term bounce but we never got the $106250 which was an important level for us to go higher with btc and potentially see $109000. But now we have lost $100000 I think we will likely end op hitting 88/92k

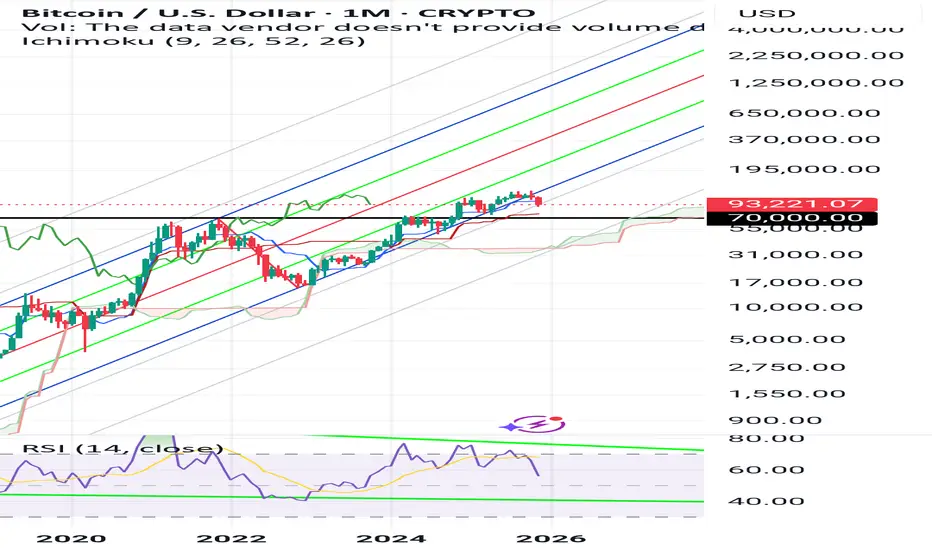
The Future of the Crypto Ecosystem: Will Bitcoin Rise Again?Following Trump’s directive to support digital currencies, Bitcoin surged from around $69,000 to a peak price around $126,000.
But after a period of major turbulence, Bitcoin began to lose value. Based on monthly Ichimoku timeframe analysis and Andrews’ Pitchfork , our models suggest Bitcoin could fall back to around $70,000 in the coming period.
We expect this downward trend to continue until early 2027.
The big question is: what happens after that? Will Bitcoin re-value and recover, or will it get stuck around these low levels, potentially threatening thousands of smaller altcoins?
ZEN is Bullish (4H)The structure of ZEN is completely bullish, and we are looking for demand zones and supportive order blocks to enter long positions, since buy setups align with the bullish structure and therefore carry lower risk.
There is a key zone on the chart; as long as ZEN remains above this level, the market stays bullish. Only if the specified zone gets broken and cleaned out can we say that there is confirmation for ZEN to turn bearish.
Do not enter the position without capital management and stop setting
Comment if you have any questions
thank you

Nifty Analysis EOD – November 18, 2025 – Tuesday 🟢 Nifty Analysis EOD – November 18, 2025 – Tuesday 🔴
26K Rejection: Bears Take Control, Wiping Out Previous Day’s Gain!
🗞 Nifty Summary
Despite lingering negative global sentiment, the Nifty opened with a modest 13-point Gap Up, but the bullishness quickly vanished. The index dipped 97 points in the first minute and eventually found a base near the critical 25880 support, marking the day’s low at 25,882. After a gradual recovery to test the previous resistance levels of 25944 and 25977, the index met the same fight near the 25980 ~ 26000 zone.
The rejection from the psychological 26K mark proved decisive, pushing Nifty sharply back down toward the day’s lows. The day closed at 25,910.05, resulting in a loss of 103.40 points (or -0.40%).
This move erased all of the previous day’s gains and confirmed a clear sign of rejection at the upper levels. The move was tricky, briefly breaching the PDL and hinting at manipulation ahead of the upcoming expiry. The trend confirmation remains pending, and caution is advised.
🛡 5 Min Intraday Chart with Levels
🛡 Intraday Walk
The session was dominated by bears, right from the opening bell, despite the initial small gap-up. The sharp morning decline established the day’s direction. The mid-session saw bulls attempt to reclaim ground, but the recovery was consistently capped by strong supply near 26,000. The failure to hold this key level resulted in the late-day sell-off, closing the index back near the bottom of its trading range.
This volatile price action, marked by the day’s range engulfing the previous day’s range, strongly suggests an upcoming period of higher volatility or a potential change in the short-term trend bias.
📉 Daily Time Frame Chart with Intraday Levels
🕯 Daily Candle Breakdown
Open: 26,021.80
High: 26,029.85
Low: 25,876.50
Close: 25,910.05
Change: −103.40 (−0.40%)
🏗️ Structure Breakdown
Type: Bearish candle
Range (High–Low): ≈ 153 points — indicating higher volatility for the session.
Body: ≈ 65.25 points — clear bullish dominance for the day.
Upper Wick: ≈ ~8 points — confirming immediate rejection and almost no strength from buyers near the open.
Lower Wick: ≈ ~34 points — buyers did attempt to defend the 25880 support, but the recovery was limited.
📚 Interpretation
The strong bearish body and the close well below the open are clear indicators that the upward momentum has stalled, and selling pressure is currently dominant. The small upper wick confirms that the bearish sentiment was present from the very beginning. This candle’s large range, encompassing the previous day’s action, is often a warning sign of a shift in market sentiment.
🕯 Candle Type
Bearish Candle with Lower-Wick Support — A strong bearish signal, moderated slightly by limited buying interest near the day’s lows.
🛡 5 Min Intraday Chart
⚔️ Gladiator Strategy Update
ATR: 194.58
IB Range: 134.05 → Medium
Market Structure: Balanced
Trade Highlights:
10:47 Long Trade - Target Hit (R:R 1:4.57)
12:54 Long Trade - Target Hit (R:R 1:3.28)
14:03 Long Trade - SL Hit
Trade Summary: Despite the overall bearish market structure, the Gladiator Strategy successfully capitalized on the strong counter-trend buying attempts in the mid-session, yielding two high R:R profitable long trades. The final short trade was stopped out due to the sharp reversal back to the lows.
🧱 Support & Resistance Levels
Resistance Zones:
25944
25977
26010 ~ 26040 (Crucial Rejection Zone)
Support Zones:
25880 ~ 25865 (Current Base)
25790
25740 ~ 25715 (Ultimate Support)
🧠 Final Thoughts
“Caution is the watchword until the range is broken.”
The market has now established a high-volatility range between 26,040 (Resistance) and 25,865 (Support). I will maintain a cautious bullish sentiment only until a decisive breach and close below the lower level of 25700 occurs, or until bulls achieve a solid close above 26100. The upcoming sessions are likely to remain choppy as this indecision plays out.
✏️ Disclaimer
This is just my personal viewpoint. Always consult your financial advisor before taking any action.

FF Looks Bullish (2H)FFUSDT has been ranging within a zone for a while, taking out both buyers’ and sellers’ stop-losses. After creating a large liquidity pool at the bottom and sweeping that lower pool, it now appears ready to move toward the key level.
On this timeframe, we have a bullish outlook on the FFUSDT pair.
Do not enter the position without capital management and stop setting
Comment if you have any questions
thank you

Gold Ready for Reversal? Price Tapping Key Liquidity“Gold is tapping into a major liquidity pocket.
If we hold this zone, a sharp bounce is on the table — if not, prepare for deeper expansion.
Watching this level for a high-probability reaction.”
“Price just swept liquidity under the recent lows and tapped into a clean demand zone.
If smart money defends this area, the move up could be explosive.
This is the zone I’m watching for a sniper entry.”
