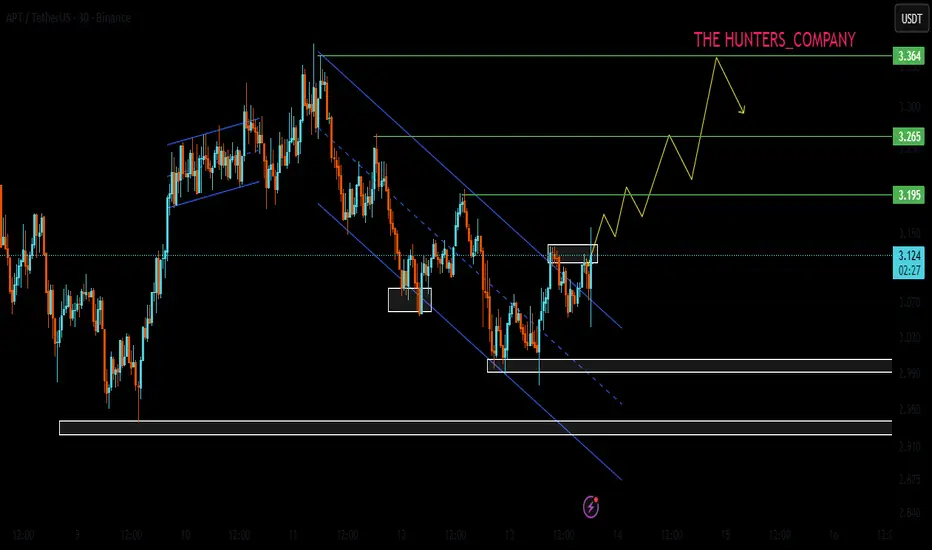
APT;Is it possible to climb the stairs?Hello friends
Considering the rise we had and the subsequent price compression that occurred, there is now an important resistance in the way of the price, and buyers can take the price to the higher targets that have been identified by breaking this resistance.
In case of further correction, we have also identified two other support areas.
Don't forget risk and capital management.
*Trade safely with us*
Pivot Points
EURUSD: Downtrend Pressure – Key Resistance Decides Next Move!📊 EURUSD: Major Downtrend Under Pressure – Key Resistance Decides Next Move!
Timeframe: Daily Chart
The EURUSD pair on the Daily chart is currently at a pivotal crossroads, trading around 1.16184. After a notable rebound from a robust support zone, the pair is now directly confronting a significant confluence of overhead resistance that has largely dictated its trend for the past few months.
Current Price Action & Trend Analysis:
Since the peaks observed in mid-September, EURUSD has been under a clear bearish influence, establishing a distinct downtrend characterized by a series of lower highs and lower lows, visually traced by the light blue zigzag pattern. This downtrend is unequivocally defined by the prominent red descending trendline that has consistently capped all attempts at a sustained bullish recovery.
However, in early November, the pair encountered substantial buying interest within the 'Good Support' zone, broadly spanning from 1.1400 to 1.1450. This area served as a strong foundation, initiating a healthy multi-day rebound that has pushed the price significantly higher. This recent upward movement has now brought EURUSD into direct collision with the '1st Resistance' zone (approximately 1.1600 to 1.1670). Crucially, this horizontal resistance band aligns perfectly with the long-standing red descending trendline, creating a powerful confluence of resistance.
The current price action represents a critical test for the bulls' recent strength. While the bounce from the 'Good Support' was impressive, overcoming this dual resistance (horizontal zone + trendline) will require substantial momentum. A decisive breakout above this area would be a powerful signal of a potential trend shift, whereas a rejection could quickly send the pair back towards lower support levels.
Key Resistance Levels:
1st Resistance (1.1600 to 1.1670): This immediate red zone is the primary short-term hurdle. It has acted as a critical pivot point previously and is currently being vigorously tested by the recent bullish surge.
Descending Red Trendline: This dynamic trendline, originating from the September peaks, is a fundamental component of the current downtrend. Its intersection with the '1st Resistance' zone forms a formidable barrier that needs to be broken for any significant bullish continuation.
Higher Resistance (around 1.1700-1.1750 and 1.1800): These levels, representing previous swing highs, would become the next targets for bulls, but only if the immediate 1st Resistance and trendline are decisively cleared.
Key Support Levels:
Good Support (1.1400 to 1.1450): This broad green zone proved its resilience in early November, acting as the springboard for the current rally. It remains a crucial defense for bulls and a key level to monitor for any bearish reversal.
Lower Support (below 1.1400): If the 'Good Support' zone were to fail, the market would likely seek further psychological or structural support levels, potentially towards 1.1350 or beyond, indicating a resumption of the broader downtrend.
Bullish Scenario:
For EURUSD to successfully reverse its daily trend and shift momentum, a decisive and sustained breakout above both the 1st Resistance (1.1600-1.1670) and the descending red trendline is paramount. A strong daily close above this combined resistance, ideally accompanied by robust buying volume, would signal a potential trend reversal, opening the path for a move towards the 1.1700-1.1750 area and possibly challenging the previous high around 1.1900.
Bearish Scenario:
The current technical structure suggests that the bearish scenario remains the primary path if the overhead resistance holds firm. A failure to break above the 1st Resistance and the descending red trendline, particularly if followed by a strong bearish daily candle formation, would likely result in a rejection. This rejection would set the stage for a retest of the 'Good Support' zone between 1.1400 and 1.1450. A decisive break below this 'Good Support' would confirm renewed bearish momentum and target lower lows.
Conclusion:
EURUSD is at a highly critical juncture. The current price action represents a direct challenge from the recent bullish rebound against a formidable, long-standing confluence of '1st Resistance' and the descending trendline. Traders should exercise caution and closely monitor how the price interacts with this crucial area. A definitive breakout or a clear rejection from this resistance will undeniably dictate the pair's direction for the coming weeks.
Disclaimer:
The information provided in this chart is for educational and informational purposes only and should not be considered as investment advice. Trading and investing involve substantial risk and are not suitable for every investor. You should carefully consider your financial situation and consult with a financial advisor before making any investment decisions. The creator of this chart does not guarantee any specific outcome or profit and is not responsible for any losses incurred as a result of using this information. Past performance is not indicative of future results. Use this information at your own risk. This chart has been created for my own improvement in Trading and Investment Analysis. Please do your own analysis before any investments.

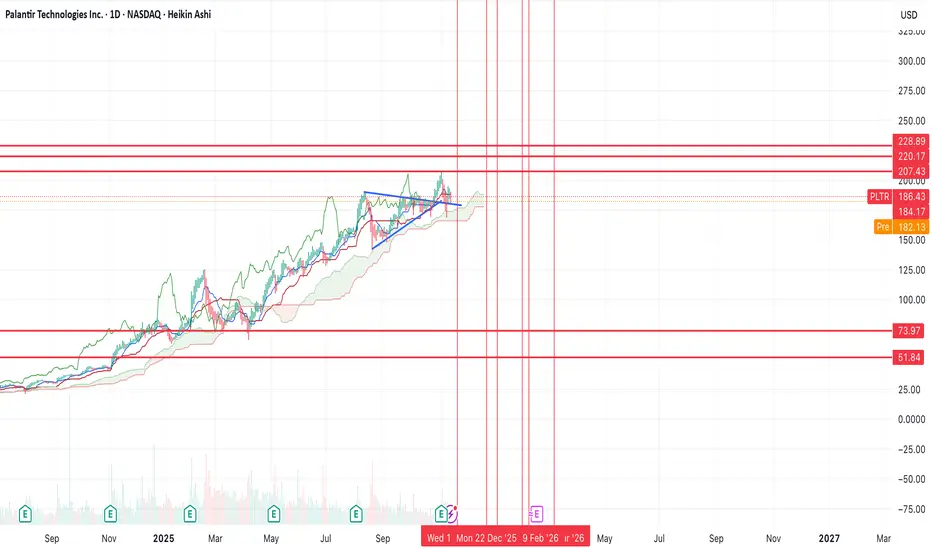
PLTR one more push up before a 70% correction?NASDAQ:PLTR looks like it's on it's last legs here.
If it can push off of this trend line here, then I think we can see one last move higher either into prior resistance, or there's a chance we can break it and form brief new highs. However, after that, I think we'll see a 70% correction back to the lower supports.
We'll either bottom at $74 or $52.
My best guess as to timing is that we bottom before March 2026.
Nifty Analysis EOD – November 13, 2025 – Thursday🟢 Nifty Analysis EOD – November 13, 2025 – Thursday 🔴
Bulls Test 26,000, But Face Sharp Rejection, Ending Day Flat!
🗞 Nifty Summary
The Nifty commenced the session with a minor 33-point Gap Up but immediately slipped almost 100 points, finding crucial support near the 25800 zone. From the day’s low of 25,808.40, the index launched a strong, conviction-fueled upward rally, breaching key resistance levels (CPR, IBH, PDH, R1) without hesitation and pushing toward the important resistance zone of 25977.
After testing this level, Nifty struggled against the psychological 26,000 mark. Although the bulls briefly pierced it, marking a high of 26,010.70, sharp rejection and profit booking triggered a 132-point drop back toward 25880. The day closed at 25,879.15, resulting in a virtually flat close (+0.01%). The selling pressure is clearly reflected between 25977 ~ 26010.
For tomorrow’s final session of the week, bullish momentum critically relies on holding above the 25800 structural support.
🛡 5 Min Intraday Chart with Levels
🛡 Intraday Walk
The day began with immediate volatility as the initial gap-up was quickly sold into, finding a floor at the 25,808 level. This drop was swiftly negated by strong buying conviction, allowing the Nifty to charge through multiple intraday resistance bands.
The market showed peak strength between 10:00 AM and 12:00 PM, achieving the all-important 26,000 psychological level.
However, after making the high, profit booking accelerated dramatically, signaling that aggressive sellers were positioned at this zone. The resulting downtrend was steep, erasing all of the day’s significant gains and confirming a strong defense by bears near the 26,000 mark.
📉 Daily Time Frame Chart with Intraday Levels
🕯 Daily Candle Breakdown
Open: 25,906.10
High: 26,010.70
Low: 25,808.40
Close: 25,879.15
Change: +3.35 (+0.01%)
🏗️ Structure Breakdown
Type: Small-bodied neutral candle with long upper and lower shadows.
Range (High–Low): ≈ 202.30 points — signifying high intraday volatility.
Body: ≈ 26.95 points — a very small real body, reflecting strong indecision.
Upper Wick: ≈ 131.55 points — a clear rejection signal from near the 26,000 level.
Lower Wick: ≈ 70.75 points — confirming sustained buying interest from the 25,800 area.
📚 Interpretation
The index opened firm near 25,900 and successfully tested the 26,010 high, but the failure to sustain above this level is the key takeaway. Selling emerged decisively near the round-number resistance, dragging prices lower toward the 25,808 low, before a mild, indecisive recovery into the close.
The close, which is almost flat (+0.01%), indicates a significant pause in momentum after the multi-day bullish run.
🕯 Candle Type
Doji-like neutral candle (or Spinning Top) — signals indecision and a temporary equilibrium between bulls and bears.
Appearing after a significant upmove, it suggests short-term exhaustion and the necessity for consolidation or a clear break in either direction.
🛡 5 Min Intraday Chart
⚔️ Gladiator Strategy Update
ATR: 209.18
IB Range: 98.40 → Medium
Market Structure: Balanced
Trade Highlights:
09:46 Long Trade – Target Achieved (R:R 1:1.04)
10:24 Long Trade – Target Achieved (R:R 1:2.37)
12:32 Short Trade – Trailing SL Hit
Trade Summary:
The strategy capitalized on the initial two-sided volatility, successfully capturing the strong morning up-move. The afternoon’s sharp reversal led to the trailing stop loss being hit on the counter-trend short trade, reflecting the balanced yet erratic price action.
🧱 Support & Resistance Levels
Resistance Zones:
25920 ~ 25944
25977 ~ 26010 (Crucial Barrier)
26050
26100
Support Zones:
25835
25790
25715 ~ 25680
🧠 Final Thoughts
“The psychological barrier of 26,000 proved too heavy today.”
The market has now clearly defined the critical battle zone for tomorrow: 25977 ~ 26010 on the upside, and 25800 on the downside.
We need a decisive close above 26,010 to confirm the next leg up towards 26050, or a clear breakdown and sustain below 25800 to initiate profit booking towards 25715.
Avoid trading the congestion zone; wait for the breakout or breakdown confirmation.
✏️ Disclaimer
This is just my personal viewpoint. Always consult your financial advisor before taking any action.

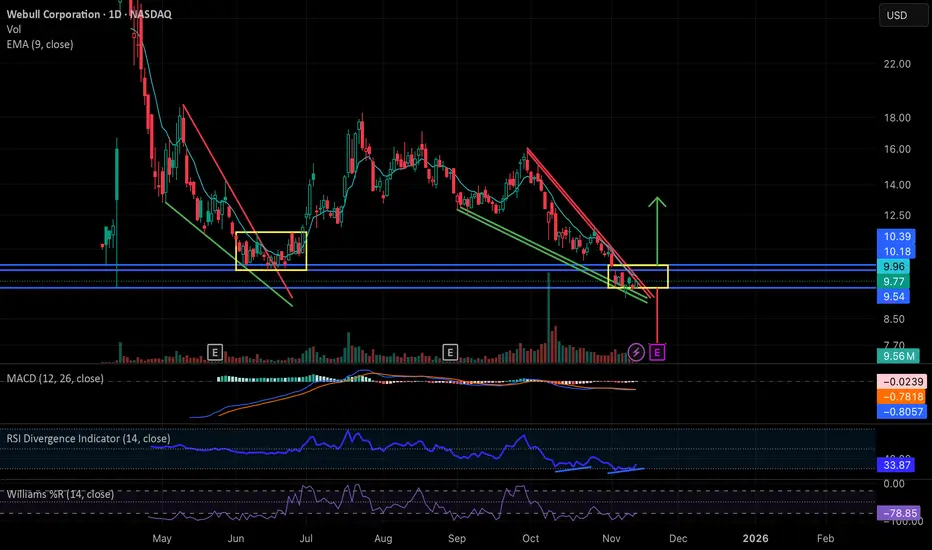
Webull: Falling Wedge Breakout ImminentNASDAQ:BULL has been in a steady decline essentially since the start of the government shutdown, forming a clean falling wedge structure very similar to the setup we saw in May and June. Back then, the wedge resolved with a brief breakout but ultimately moved into a sideways consolidation inside the yellow range before finally lifting in late June/early July.
Price is now sitting at the apex of a new wedge right as the government has officially reopened, almost to the day. With the president signing the bill, this may act as a macro green light for liquidity into year end, and BULL is positioned to potentially benefit from that.
Technically, the stock is deeply beaten down (roughly 40 percent from pre-shutdown levels), the MACD is starting to curl up, and there’s a clear daily RSI divergence. Together, these conditions make a relief move or breakout increasingly plausible.
If we don’t get a meaningful directional move between now and earnings on 11/20, then the most likely scenario is a replay of the May/June pattern: a period of sideways chop inside its current established support and resistance band zone around 9.54-10.18/10.39 while the market waits for the earnings catalyst. That report would then determine the next substantial move up or down.
In short: BULL is at a technical decision point, with momentum indicators improving, macro pressure easing, and earnings close enough that either a near-term wedge break or a consolidation-before-catalyst are both reasonable outcomes from here.
XRP BUYPrice broke above the last Lower High (LH) and formed a new Higher High (HH), confirming a shift to bullish structure. After that move, it pulled back into the breakout zone, now acting as demand, where buyers look to step back in.
As long as price holds above this level, I’m keeping a bullish bias with targets toward the previous HH. A break below the current HL would invalidate the setup — that’s where my stop loss sits.
Entry: 2.40947
Stop Loss: 2.34257
Take Profit: 2.61517

Stellar's(XLM) trajectoryConsidering the price hitting the supply zone (green area) and consuming the orders in that zone along with the reaction it has shown, now if the market also consumes the supply zone (orange area) and breaks through it, we expect the continuation of the upward movement to the next levels. BINANCE:XLMUSDT

SOLANA BOUT TO MOON!Here is some play for you so seems bullish on 1hr time frame as it shows a strong bullish candle and continue to make that bullishness

XAU Mid Buying ModelHello everyone, Welcome to the XAU-SYNDICATE...
This is my entry model for buying. so I'll wait for my zone, as soon as the price reaches my zone I'll look for a INT.IDM hunt or M15 single bullish candle close above 3916 second confirmation and plan my trade accordingly.
#XAU-SYNDICATE

Is Meta Share Price About To Get Better?Meta hasn’t been kind to the bulls in recent weeks, falling around 25% from its August high. However, with bullish price action emerging near a key support cluster, it may finally be time for buyers to step in.
Matt Simpson, Market Analyst at City Index.

ICP @ 50% retracement ICP is at the 50% Fib retracement (~$6.15) from the November 7 high. If a floor forms here, then a potential rise in pricing could happen, potentially seeking previous highs ~$10. Failure to hold could see ~$5.20-4.70 support.
Solid floor here could be a buy signal. Failure to hold means further drop to old support.

XAU Selling Model #1Hello everyone, Welcome to the XAU-SYNDICATE...
This is my entry model #1 for selling. so I'll wait for my zone, as soon as the price reaches my zone I'll look for a Liquidity hunt and bearish candle confirmation and plan my trade accordingly. 15-MIN, MSS after liquidity grab is most important part and extra confirmation.
#XAU-SYNDICATE

XAUUSD(GOLD): +1874 PIPS Target| Touching $3600? Gold experienced a significant price surge, driven by the ongoing conflict between Iran and Israel. This heightened uncertainty among global investors led to a price touch of $3445. The current price is accumulating, and we anticipate a strong bullish distribution in the near future. Please prioritise accurate risk management during trading.
Good luck,
Team Setupsfx_

XAU Buying Model #1Hello everyone, Welcome to the XAU-SYNDICATE...
This is my entry model #1 for buying. so I'll wait for my zone, as soon as the price reaches my zone I'll look for a single bullish candle confirmation and plan my trade accordingly.
#XAU-SYNDICATE

BTC HARMONICSBtc 1M fractal close. 102400 ish.
Two harmonics one up one down.
See how price reacts see which is victorious.
112500 upper target if we go up.

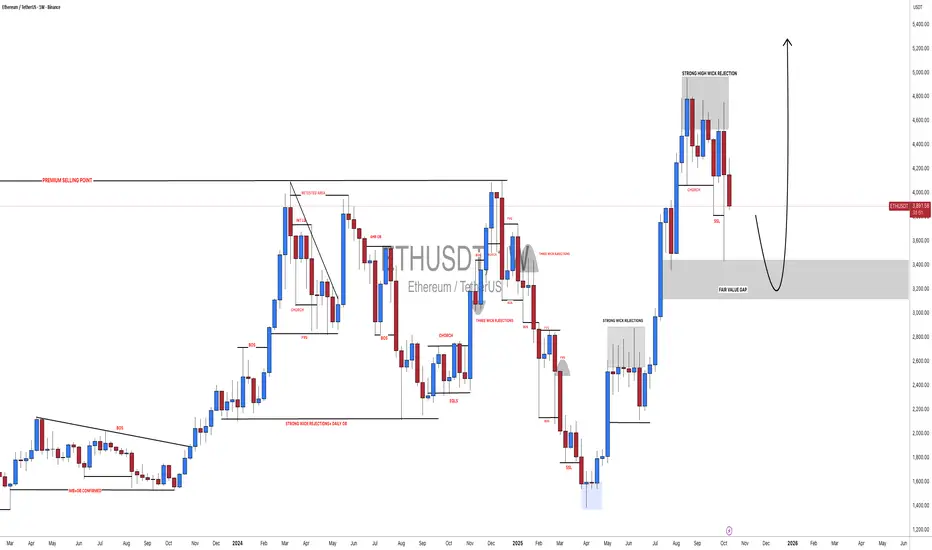
#ETHUSDT: Fill The Gap At $3200, Target At $6000 The significant price gap has been closed and the market is now in correction mode. We anticipate a further decline of approximately $3200 which remains a key support level for buyers. Our next step is to observe the market’s reaction and remain patient.
Please note that this is not a guarantee and you should always conduct your own research before making any significant investment decisions.
Best regards,
Team Setupsfx
#XAGUSD(SILVER):Is Bull Run Over? Major Correction On the Way? Dear Traders,
Silver has experienced a significant decline since the DXY began to recover. The price is likely to continue falling and we believe this may be the commencement of a major decline. We anticipate a smooth drop based on previous price reactions.
**Potential Entry Zone:**
- Enter when the price reaches the FVG area marked with a white box. The initial take profit can be set at $45 and the swing trade at $40.
**Support:**
- We would appreciate your support by liking and commenting on our ideas which will encourage us to post more in the future.
Team Setupsfx

#XAUUSD: Will There Be Major Price Correction On Gold? Dear Traders,
Gold has been rallying with strong bullish momentum and has not experienced a major correction since the last few weeks. We have identified a key level from which the price can continue its bullish momentum if fundamentals do not change. Furthermore, we can target $4200 in a few weeks if the current momentum continues.
Best regards,
Team Setupsfx_

XAUUSD shortXAU/USD Analysis
Price has retraced back to the Lower High (LH) area, which represents a potential sell zone according to market structure.
On the lower timeframe (15-minute chart), a Double Top pattern is forming.
If the neckline breaks and a confirmed pullback occurs, it could provide a good selling opportunity with continuation to the downside.

Continued bullish run but be careful of the US shutdown endWith enough volume, if Gold goes pass the 4.146 mark, and retest
we may have a bullish run adding on to the 3 week. But be weary of the
US shutdown which may boost the $ weakening the bullish run.

XAUUSD | Educational Sell Setup on Gold – Watching for Reversal Gold is currently approaching a major resistance area around 4165 – 4185, a level that has repeatedly acted as a short-term supply zone in recent sessions.
This region remains crucial for determining the next directional move — whether price confirms rejection or breaks through toward higher targets.
We are closely monitoring this zone for bearish reversal confirmation, preferably a bearish engulfing candle or any strong rejection structure on the 4H or 1H timeframe.
Once a clear reversal candle forms, short positions may be considered with strict money and risk management.
📊 Trade Overview
Type: Educational Sell Setup
Entry Zone: 4165 – 4185 (confirmation required)
Stop Loss: 4195 (4H candle close above)
Setup Context: Price testing resistance; potential corrective move expected upon rejection.
🎯 Target Map (Risk–Reward Structure) (SL: 4195)
Entry Risk ($) TP1 (1:1) TP2 (1:2) TP3 (1:3) TP4 (1:4) TP5 (Extended) R:R Ratio
4165 30 4135 4105 4075 4045 — 1 : 4
4175 20 4155 4135 4115 4095 4045 1 : 6.5
4185 10 4175 4165 4155 4145 4045 1 : 14
Each position is managed independently.
Partial profits are taken at each milestone (1:1, 1:2, 1:3, 1:4), and stop-loss is moved to break-even after TP1 is reached.
Remaining exposure may target the extended level at $4045 if bearish momentum continues.
⚙️ Trade Management Rules
1:1 (First Target): Partial profit + move SL to entry.
1:2 and 1:3: Gradually reduce exposure while protecting capital.
1:4: Full closure unless strong momentum remains.
Extended TP5 (1:6.5–1:14): Optional trailing continuation only under sustained bearish structure.
📈 Technical Notes
The 4165–4185 range is a confirmed supply area on the 4H structure.
4H close above 4195 invalidates this setup and shifts bias toward 4205 → 4285.
Rejection within this resistance zone keeps the short bias valid toward 4045 as an extended target.
⚠️ Disclaimer:
This analysis is for educational and informational purposes only and does not constitute financial advice.
All entries, targets, and risk parameters are provided for learning purposes within structured trading frameworks.

XAUUSD – Gold Price Analysis | 4H Chart🧭 Market Overview
Gold continues to trade within a strong bullish momentum after breaking above the $4,083 resistance level, confirming short-term strength and pushing prices toward the current resistance area around $4,135–$4,160.
This region represents a critical decision zone, where the next move will likely determine the short- to medium-term direction of gold.
📊 Technical Structure
Key Support Zone: $4,005 – $4,045
Decision Zone (Current): $4,120 – $4,135
Resistance Levels: $4,160 → $4,185 → $4,205 → $4,285 → $4,365
The market recently closed multiple 4-hour candles above $4,083, confirming a strong bullish structure.
However, the current Resistance Zone ($4,135–$4,160) could trigger a temporary correction if price fails to maintain momentum above this range.
🧩 Potential Scenarios
Bullish Continuation:
If gold sustains 4H and daily closes above $4,135–$4,160,
momentum could accelerate toward $4,205, $4,285, and possibly $4,365–$4,380, which aligns with the previous historical peak.
Bearish Rejection / Correction:
If price fails to hold above $4,120–$4,135,
a pullback toward $4,085, $4,045, or $4,005 is likely before buyers attempt to regain control.
🔭 Outlook Summary
The zone between $4,120 and $4,135 remains the core decision area.
Holding above = continuation of bullish momentum.
Closing below = short-term correction phase.
Traders should monitor candle closes rather than quick spikes or wicks,
as false breakouts are common in such volatile conditions.
⚠️ Disclaimer:
This analysis is for educational purposes only and does not represent financial advice or trading recommendations.
Always conduct your own research and risk management before entering the market.

$BTC plan after monday rangeThis is my CRYPTOCAP:BTC plan after the monday range. I will let the price action make the decision for me. For both shorts or longs I will enter on a retest of the monday range. Simple plan, and work with triggers.
