USD/CAD: Will the Great Divergence Break the Greenback?The financial world stands on the precipice of a defining moment for North American currency markets. The USD/CAD pair hovers near 1.3855, ticking nervously as traders count down to a rare double-header of central bank decisions. December 10, 2025, marks a pivotal divergence point where economic pathways between the United States and Canada split sharply. This is not merely a technical adjustment; it is a fundamental collision of monetary policy, geopolitical strategy, and industrial resilience. The outcome will likely dictate the Loonie’s trajectory for the coming year.
Macroeconomics: A Tale of Two Trajectories
The macroeconomic landscape reveals a stark contrast between the two nations. The Federal Reserve prepares to slash interest rates for the third consecutive time, targeting a range of 3.50%-3.75%. Markets price this move at nearly 88% probability. The US labor market displays clear signs of cooling, necessitating easier financing conditions to prevent a recession. Conversely, the Bank of Canada (BoC) stands firm. Canada’s economy defied expectations with a robust 2.6% annualized GDP growth in Q3, crushing earlier forecasts. This resilience compels the BoC to hold rates at 2.25% to prevent reigniting inflation, which remains sticky at 2.2%.
Geostrategy: The Fertilizer Chess Game
Beyond interest rates, a high-stakes geopolitical trade war complicates currency valuation. The US administration’s threat of severe tariffs on Canadian fertilizer imports paradoxically jeopardizes US food security. American farmers rely heavily on Canadian potash, importing over half of Canada’s production. Tariffs here act as a double-edged sword: they aim to punish Canada but simultaneously drive up input costs for the US agricultural sector. This strategic misstep weakens the US Dollar’s purchasing power domestically while forcing the administration to print subsidies, further diluting the currency.
Industry Trends: Agriculture Under Siege
The agricultural industry sits at the epicenter of this financial storm. The promise of $12 billion in aid to US farmers highlights the structural damage already inflicted by trade barriers. This subsidy model creates a vicious cycle of dependency rather than innovation. While Canadian fertilizer producers face tariff headwinds, their product remains essential, granting them significant pricing power. US farmers face a "margin squeeze" that ripples through the broader economy, softening the US economic outlook and diminishing the appeal of the Greenback relative to the resource-backed Loonie.
Management & Leadership: Powell vs. Macklem
Leadership styles at the central banks further amplify market volatility. Fed Chair Jerome Powell operates under intense political pressure and conflicting data, forcing a reactionary "data-dependent" approach. His leadership currently signals caution and retreat. In contrast, BoC Governor Tiff Macklem displays a steady hand, anchoring policy to tangible growth metrics like the recent 180.6K job surge. This stability in Canadian monetary leadership attracts foreign capital seeking predictable returns, creating a natural demand for the Canadian Dollar over the politically volatile USD.
Business Models: Supply Chain Resilience
The trade dispute forces companies to rethink business models. Canadian exporters are diversifying markets beyond the US, strengthening long-term resilience. Meanwhile, US importers face a supply chain crisis, unable to quickly source alternative fertilizer at competitive rates. This rigidity in the US supply chain exposes a critical weakness in the American business model for agriculture. Investors recognize this structural flaw, leading to capital flows that favor the adaptability of the Canadian export sector, thereby supporting the CAD against the USD.
Conclusion: The Loonie’s Rebellion
The confluence of diverging interest rates and self-inflicted US trade wounds creates a perfect storm for USD/CAD bears. The Federal Reserve’s dovish pivot contrasts sharply with the Bank of Canada’s confident hold, widening the yield spread in favor of Canadian assets. Combined with the strategic failure of fertilizer tariffs, fundamental drivers point toward a weaker US Dollar. Traders must watch the 1.3850 level closely; a break below likely signals the start of a prolonged downtrend for the pair. The divergence is real, and the Loonie is ready to rebel.
Ratecut

XAUUSD Set for Surge? Safe-Haven Demand and Fed Cut Bets AlignHey Traders,
In today’s session we are monitoring XAUUSD for a potential buying opportunity around the 4,200 zone. Gold remains in a strong uptrend, and the current correction is bringing price back toward the key 4,200 support–resistance area, which could offer a favorable entry.
Fundamentally, GOLD should continue to benefit from the ongoing weakening of the U.S. Dollar, driven by expectations of a 25bps rate cut. As we head into Wednesday’s FOMC, markets are likely to keep front-running the event, which typically pressures the dollar lower.
Just be cautious—if we see too much front-running, the classic “buy the rumor, sell the fact” reaction could hit once the decision is officially announced.
Additionally, rising geopolitical tensions between Venezuela and the United States are increasing safe-haven demand, which further supports upside for Gold.
Trade safe,
Joe.

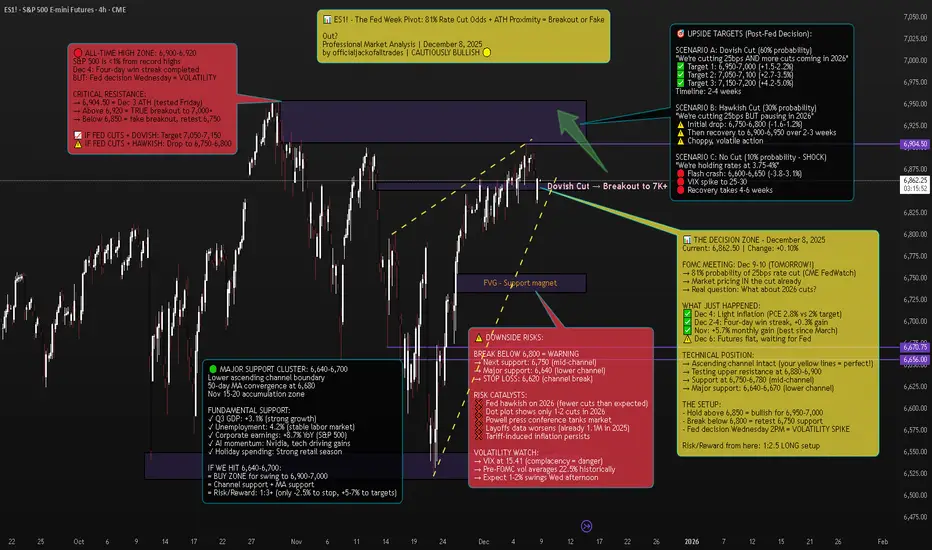
ES1! S&P 500 E-mini Futures - The Fed Week Pivot📈 Executive Summary - The Setup
Current Price: 6,862.50 | Date: December 8, 2025 | Change: +6.75 (+0.10%)
The S&P 500 E-mini futures are sitting less than 1% from all-time highs on the eve of the Federal Reserve's most anticipated meeting of 2025. After a four-day win streak that added 0.3% to the index, markets are now in a classic consolidation pattern at resistance, waiting for Wednesday's 2PM ET catalyst.
The Technical Picture:
Pattern: Ascending channel (intact since November)
Current Position: Testing upper resistance at 6,880-6,900
ATH: 6,904.50 (December 3) - 0.6% away
Support: 6,750-6,780 (mid-channel), 6,640-6,670 (lower channel)
The Fundamental Backdrop:
FedWatch shows a near-90% probability the FOMC will cut the target range for the federal funds rate by another 25 basis points. But here's what markets are REALLY pricing: not just the cut itself (that's a given), but Powell's guidance on 2026.
Minutes from the October meeting showed "many" FOMC members saying no more cuts are needed at least in 2025. Yet the market now indicates an 80% likelihood of a December rate cut, following dovish statements from NY Fed President John Williams and Fed Governor Christopher Waller.
The Trade: This is a tactical long from 6,850-6,870 targeting 6,950-7,050, with stop at 6,820. Risk/reward: 1:2.5.
But the real opportunity? Buying any Fed-induced dip to 6,750-6,800 for a swing to 7,000+.
🔎 Market Context - What's REALLY Happening
The Pre-Fed Calm
US stock futures stall as traders wait for the Fed meeting, with the S&P 500 just below record highs. This is textbook behavior: The indexes have quietly stitched together consistent gains. The Dow and Nasdaq scored back-to-back positive weeks; the S&P 500 added another 0.3% and now sits only a touch from record territory.
S&P 500 futures (ES) traded around 6,880-6,885, roughly 0.1% higher by 6:00-7:30 a.m. ET on Monday.
But don't mistake the calm for weakness. Even after November's wobble, dip-buyers came back as shutdown fears faded and AI jitters cooled.
The Fed's Dilemma
The Federal Reserve is in an impossible position:
Argument FOR cutting:
Concerns about a softening labor market
Employers cut more than 1.1 million jobs through November, the most since 2020 and a 54% increase from the same period a year ago
Job growth remains too low to keep up with labor supply growth and a rising unemployment rate
Argument AGAINST cutting:
Latest inflation scorecard, the Fed's preferred PCE index, is running at 2.8 percent a year, close to its 2 percent goal but not quite there
The annualized inflation rate grew to 3% in September from 2.9% in August and 2.7% in July
Officials expressing skepticism about the need for an additional cut that markets had been widely anticipating, with "many" saying that no more cuts are needed at least in 2025
The Missing Data Problem:
Here's something CRITICAL that most traders don't know: The U.S. central bank will have to make its decision without some key government data. Hiring data for November and the latest inflation number have been delayed until mid-December, after the Fed's meeting, because of the U.S. government shutdown.
The meeting minutes indicated the decision-making was complicated by a lack of government data during the 44-day federal government shutdown. Powell himself compared this to "driving in the fog".
Translation: The Fed is making a $28 TRILLION (SPY market cap) decision BLIND.
The Internal FOMC War
"It's difficult to recall a time when the Federal Open Market Committee has been so evenly divided about the need for additional rate cuts than the upcoming December meeting," Michael Pearce, chief U.S. economist at Oxford Economics, said.
Jerome Powell faces a credibility issue as he tries to satisfy hawks and doves on the most divided Fed in recent memory.
The October meeting vote was 10-2, but the 10-2 vote was not indicative of how split officials were at an institution not generally known for dissent. The minutes revealed multiple camps:
Some favored cutting
Some supported cutting but could have supported holding
Several were against cutting
For December, Mericle expects at least two dissents in favor of no rate cut as well as one in favor of a larger rate cut.
📊 Technical Analysis - The Ascending Channel At Decision Point
The Pattern: Ascending Channel (Bullish Structure)
Your chart annotation is PERFECT. The yellow dashed ascending channel captures the exact structure driving ES1! since the November bottom.
Channel Characteristics:
Lower Support: 6,640 (tested Nov 15, Nov 29) → 6,670 (current)
Upper Resistance: 6,850 (Nov 25) → 6,900 (Dec 3-6) → 6,920 (projected)
Angle: ~25° (strong bull trend)
Tests: 6 touches (3 upper, 3 lower) = highly reliable pattern
Current Position: We're at the UPPER boundary of the channel, testing 6,880-6,900 resistance.
Key Technical Levels:
🔴 RESISTANCE (Selling pressure zones):
6,880-6,900: Current test, upper channel boundary
6,904.50: All-time high from December 3
6,920-6,950: True breakout zone (if we clear ATH)
7,000: Psychological milestone
🟢 SUPPORT (Buying interest zones):
6,850: Immediate support, bull/bear line
6,800-6,820: Minor support cluster + FVG
6,750-6,780: Mid-channel support + 23.6% Fib
6,700-6,720: 38.2% Fib retracement
6,640-6,670: Major support (lower channel + 50-day MA + November accumulation)
Technical Indicators:
Moving Averages:
50-day MA: ~6,680 (rising, bullish)
200-day MA: ~6,450 (rising, bullish)
Golden Cross: Active since mid-November = long-term bullish
RSI (Relative Strength Index):
Current: 58-60 (neutral/slightly bullish)
Not overbought (room to run to 70+)
Not oversold (not panic selling)
Interpretation: Healthy consolidation before next leg
Volume Analysis:
Declining volume into Fed decision = normal pre-FOMC behavior
Stock volatility averages around 22.5% in the month preceding rate cuts, compared with roughly 15% during normal periods
Expect volume spike Wednesday 2PM-4PM (100K+ contracts)
VIX (Fear Index):
VIX at 15.41, down -0.37 (-2.34%)
This is LOW = market complacency
Pre-FOMC, VIX typically rises to 18-22
IF VIX spikes to 20+ Wednesday = sell signal
🎯 Scenario Analysis - Three Possible Outcomes
SCENARIO A: Dovish Cut (60% Probability) - BULLISH
What Happens:
Fed cuts 25bps to 3.50-3.75% range ✓
Dot plot shows 3-4 more cuts in 2026 ✓
Powell says "labor market concerns outweigh inflation" ✓
Balance sheet runoff stops as planned (December 1) ✓
Market Reaction:
Immediate: ES pumps 1-1.5% to 6,930-6,950
Day 1-3: Consolidation at 6,920-6,950
Week 1-2: Breakout to 7,050-7,100
Month 1: Target 7,150-7,200 (+4.2%)
Sector Leaders:
Small caps (Russell 2000) +2-3%
Tech (Nasdaq) +1.5-2%
Financials +1-1.5%
Trade Setup:
Enter: ANY dip to 6,850-6,870 before Fed
Add: On breakout above 6,910 with volume
Target: 7,050 (+2.7%), 7,150 (+4.2%)
Stop: 6,820 (-0.6%)
Risk/Reward: 1:4
SCENARIO B: Hawkish Cut (30% Probability) - NEUTRAL/CHOPPY
What Happens:
Fed cuts 25bps to 3.50-3.75% range ✓
BUT dot plot shows only 1-2 cuts in 2026 ❌
Powell says "we're near neutral, will pause to assess" ❌
Market had priced in 3-4 cuts for 2026 = DISAPPOINTMENT
Market Reaction:
Immediate: ES drops 0.8-1.2% to 6,790-6,820
Day 1: Volatility, chop between 6,780-6,850
Week 1-2: Dip-buying brings it back to 6,870-6,900
Month 1: Grind back to 6,950-7,000 (+1.3%)
Sector Rotation:
Small caps (Russell 2000) -1.5-2%
Tech holds up better (mega-caps)
Defensives (utilities, staples) outperform
Trade Setup:
DO NOT chase before Fed (risk of -1.2% drop)
Buy: Dip to 6,750-6,800 (mid-channel support)
Target: 6,900-6,950 (+2-3% from dip entry)
Stop: 6,720 (-1%)
Risk/Reward: 1:2
SCENARIO C: No Cut OR Very Hawkish (10% Probability) - BEARISH
What Happens:
Fed HOLDS at 3.75-4% range (SHOCK) ❌
OR cuts but says "this is the last one for 6+ months" ❌
Powell cites inflation persistence, tariff risks ❌
Market has 90% priced in for cut = PANIC
Market Reaction:
Immediate: ES flash crashes 2-3% to 6,650-6,750
Day 1: Volatility, VIX spikes to 25-30
Week 1-2: Bounce attempt to 6,750-6,800 fails
Month 1: Retest 6,600, then recovery to 6,800-6,850
Sector Carnage:
Small caps (Russell 2000) -3-4%
Tech -2-3%
Everything bleeds
Trade Setup:
Exit ALL longs immediately on no-cut announcement
Wait for VIX to spike above 25
Buy: Capitulation at 6,600-6,650 (lower channel)
Target: Recovery to 6,850-6,900 (+3-4%)
Risk/Reward: 1:3 (but high stress)
🎯 THE TRADE SETUP - Professional Execution Plan
🟢 PRIMARY LONG SETUP: BUY ES1!
Entry Strategy (Scale In):
Option A: Conservative (Wait for Fed)
50% at 6,750-6,780 (IF hawkish cut dips)
50% at 6,720-6,750 (IF deeper dip)
Best for: Risk-averse traders
Option B: Tactical (Enter Now)
40% at 6,860-6,870 (current - small position)
30% at 6,820-6,840 (IF pre-Fed dip)
30% at 6,750-6,780 (IF post-Fed dip)
Best for: Experienced traders comfortable with volatility
Stop Loss: 6,620 (HARD STOP)
Below 6,620 = channel break on daily close
Below this = technical structure invalidated
Max loss from 6,862 entry: -3.5%
Take Profit Targets:
TP1: 6,950-7,000 (Probability: 70%)
Initial breakout above ATH
Psychological 7,000 level
Action: Take 40% profit, move stop to 6,850
Gain: +1.3-2.0% | Risk/Reward: 1:2
TP2: 7,050-7,100 (Probability: 50%)
Momentum continuation
Channel projection
Action: Take 30% profit, trail stop to 6,920
Gain: +2.7-3.5% | Risk/Reward: 1:3
TP3: 7,150-7,200 (Probability: 30%)
Full breakout extension
TradingView puts it, with a potential breakout in S&P 500 futures above the 6,900 area
Action: Take 20% profit, let 10% ride
Gain: +4.2-4.9% | Risk/Reward: 1:4
Entry Confirmation Checklist:
Before entering, CHECK:
✅ Price holding above 6,850 (bull/bear line)
✅ Volume spike on bounce (80K+ contracts on 15min)
✅ RSI crosses above 60 (momentum shift)
✅ VIX drops below 16 (fear subsiding)
✅ Fed announces 25bps cut (as expected)
✅ Powell's tone is dovish or neutral (not hawkish)
WAIT FOR 4/6 BEFORE FULL POSITION
Fed Day Volatility Protocol:
December 10, 2PM ET - Fed Announcement:
1:45 PM: Tighten stops to 6,830 (before announcement)
2:00 PM: Fed statement released - READ IMMEDIATELY
2:00-2:05 PM: Algorithmic reaction (ignore, volatile)
2:05-2:30 PM: Human digestion of statement
2:30 PM: Powell press conference begins - WATCH LIVE
2:30-3:15 PM: Powell Q&A determines direction
3:15-4:00 PM: Final positioning for overnight
IF DOVISH: Add to position on dip to 6,900
IF HAWKISH: Cut 50%, trail rest tight at 6,820
Weekly Monitoring:
Check EVERY DAY:
Fed speakers: Any 2026 guidance changes
Economic data: Jobs (Dec 16), CPI (Dec 18)
Technical levels: Is channel intact?
VIX: Spikes above 20 = warning
Volume: Declining = weak trend
Emergency Exit Conditions:
❌ Daily close below 6,620 = EXIT ALL (channel break)
❌ VIX spikes above 25 = EXIT 50%, tight stop on rest
❌ Fed announces NO cut (10% scenario) = EXIT ALL immediately
❌ Powell says "this is the last cut for 2026" = EXIT 50%
❌ ES gaps down >1.5% overnight = reassess, likely exit
📊 Fundamental Analysis - Why This Matters
CATALYST #1: The Fed's Impossible Position
Federal Reserve policymakers are expected to cut interest rates at this week's meeting despite inflation remaining above their target amid concerns about a softening labor market.
This is the classic Fed dual mandate dilemma:
Mandate #1: Maximum employment (FAILING - 1.1M layoffs in 2025)
Mandate #2: Stable prices (FAILING - inflation at 2.8% vs 2% target)
They can't fix both. So they have to choose.
David Mericle, chief U.S. economist at Goldman Sachs notes job growth remains too low to keep up with labor supply growth and a rising unemployment rate.
My take: The Fed will prioritize employment over inflation. That's dovish = bullish for stocks.
CATALYST #2: Corporate Earnings Remain Strong
Despite all the macro noise, corporate profits are SOLID:
S&P 500 earnings: +8.7% YoY
Tech sector leading: +12-15% earnings growth
AI spending driving margins higher
Q4 guidance mostly positive
Carvana (CVNA) stock rose 8% before the bell on Monday following news on Friday that it will join the S&P 500 as part of the index's quarterly rebalancing.
Translation: Fundamentals support higher prices, Fed just needs to cooperate.
CATALYST #3: Seasonal Tailwinds
Could spark a "year-end melt-up", as TradingView puts it, with a potential breakout in S&P 500 futures above the 6,900 area.
December-January has positive seasonality:
Holiday spending strong
Tax-loss selling done (Nov-early Dec)
January effect (fresh capital inflows)
Pension/401k rebalancing (buy equities)
Historically, S&P 500 averages +1.3% in December and +1.1% in January.
CATALYST #4: Institutional Positioning
Bloomberg's interviews with 39 investment managers show that most are still planning for a risk-on 2026, citing expectations of continued AI-driven productivity and earnings growth.
But here's the key: Asset managers such as EFG Asset Management and BNP Paribas Asset Management caution that with 2025 already a strong year, they are reluctant to increase equity exposure into thin year-end liquidity, preferring instead to wait for better entry points in early 2026.
Translation: Institutions are WAITING to buy. Any Fed-induced dip to 6,750-6,800 will be AGGRESSIVELY bought.
⚠️ Risk Factors - The Bear Case
RISK #1: Hawkish Powell Tanks Market
Feroli noted that the firm is anticipating at least two dissents in favor of no rate cut as well as one in favor of a larger rate cut.
If Powell leans hawkish to appease the dissenting hawks, market could drop 1-2%.
RISK #2: Tariff-Induced Inflation
Minutes mentioned Trump's tariff policies in forecasts they provided in early September, projecting higher inflation and unemployment, slower growth and a lower federal funds ratel.
If inflation accelerates in 2026 due to tariffs, Fed might have to HIKE again = very bearish.
RISK #3: Labor Market Deterioration
Employers cut more than 1.1 million jobs through November, the most since 2020 and a 54% increase from the same period a year ago.
If this accelerates, could trigger recession fears.
RISK #4: Technical Breakdown
Break below 6,620 = channel invalidated → target 6,500-6,550 (-4.5-5.2%)
🔥 The Bottom Line
Here's what I KNOW on December 8, 2025:
✅ 81% probability of 25bps cut Wednesday
✅ S&P 500 less than 1% from ATH
✅ Your ascending channel is PERFECT technical structure
✅ 39 investment managers planning risk-on 2026
✅ Corporate earnings strong (+8.7% YoY)
✅ Seasonal tailwinds (December +1.3% avg)
✅ Support at 6,750-6,800 = institutional buy zone
Here's what I DON'T know:
Will Powell be dovish or hawkish?
How many 2026 cuts will dot plot show?
Will Q&A reveal recession concerns?
But here's what the MATH says:
Risk: 6,862 → 6,620 = -3.5% (if channel breaks)
Reward: 6,862 → 7,050 = +2.7% (base case)
Extended: 6,862 → 7,150 = +4.2% (bull case)
Risk/Reward: 1:2.5 minimum
The Play:
Small position NOW at 6,860-6,870 (20-30% of intended size)
IF hawkish dip to 6,750-6,800 → ADD 50-70%
IF dovish → ADD on breakout above 6,910
Stop at 6,620 (non-negotiable)
Target 7,050, then 7,150
This is a PROBABILITY game. 60% dovish, 30% hawkish, 10% shock. Position accordingly.
📍 Follow officialjackofalltrades for institutional-grade technical analysis, professional risk management, and trades backed by data.
Drop a 📊 if you're trading the Fed decision.
Drop a 🎯 if this helped your ES1! analysis.
Drop a 💰 if you're ready for 7,000+ SPX.
08/12/25 Weekly OutlookLast weeks high: $94,171.14
Last weeks low: $83,809.87
Midpoint: $88,990.51
Bitcoin performs a double Swing Fail Pattern (SFP) as price sweeps both extremities of the range before closing out near the midpoint. After such a dramatic drawdown during Q4 so far, the possibility of a V-shape reversal as the year comes to a close was never going to be a high probability. With that we have seen a steady base being built and a higher low printed, certainly a more bullish structure than last weeks opening.
This week we have FOMC on Wednesday:
Previous: 4.0%
Forecast: 3.75% (-25bps)
Actual: ?%
A 25bps cut is forecast with an 87% chance. Could this finally reignite some buyside volume? The timing of year end doesn't help, I think volume stays relatively subdued until 2026 where the Fed ending QT & lowering rates help risk-on assets. For now I will maintain that a $80,000-$100,000 range is where Bitcoin stays for some time, thin orderbooks creating short term volatility but not necessarily strong moves in either direction.

DXY | Price Action - Awaiting a Clear BreakoutMacro approach:
- US dollar index has traded slightly weaker so far this week, pressured by rising expectations of another Fed rate cut and soft US data at the start of Dec. Sentiment toward the greenback has been cautious amid a pullback in US yields and ongoing repricing of the Fed’s policy path.
- Markets are increasingly discounting a high probability of a Dec FOMC cut as recent communication and prior easing have reinforced the view that policy is moving deeper into an easing cycle, undermining the US dollar’s yield advantage. At the same time, the latest ISM manufacturing release showed activity remaining in contraction territory, adding to concerns over US growth momentum and limiting support for the currency. Risk appetite in equities and metals has also improved, further reducing near‑term safe‑haven demand for the dollar.
- US dollar index may remain under pressure if the upcoming US labor market data and services surveys indicate further cooling, reinforcing the case for additional Fed easing. Key catalysts include this week’s jobs indicators, the ISM Services Index release, and fresh Fed speeches, which could potentially shift rate-cut expectations and drive renewed volatility in the index.
Technical approach:
- DXY consolidated within the range of 99.00-100.28. The index is between both EMAs, indicating a sideways movement remains intact.
- If DXY breaches above 100.28, the price may rise toward the following resistance at 101.70.
- Conversely, closing below EMA78 and 99.00 may prompt a further decline toward the subsequent support at 97.60.
Analysis by: Dat Tong, Senior Financial Markets Strategist at Exness

Can crypto catch the rate cut bid?Recently I noticed a falling wedge on an equal-weight crypto basket which can be bullish. However prices resolved sharply lower!
This week is seeing an aggressive increase in Dec Fed rate cut expectations, evidenced by
Bond yields TVC:TNX -- lower
US Dollar fx basket TVC:DXY -- lower
Small cap stocks AMEX:IWM -- higher
The moves haven't all happened in tandem; it looks like bonds were first to price in the rate cut bet. In recent sessions we're starting to see a follow through in Dollar and small cap stock pricing.
Nothing says a rate cut is imminent, but if the market is pricing for that across asset classes, does that make a stronger case for a small ascending triangle in an equal-weight crypto basket?

NVDA Head and Shoulders- Dec Rate Cuts has changed setupNvidia’s setup has shifted. With the Fed signaling a likely rate cut on December 10th, the market will start baking that optimism into asset prices ahead of time. When monetary conditions ease, high-valuation tech often gets an extra tailwind, which means the expected head-and-shoulders pattern on NVDA may fail to play out cleanly. The chart might still roll over, but the macro backdrop now works against a decisive breakdown. Short positions here demand caution.
Original post
Nvidia’s bear case rests on one core idea: the stock price assumes a flawless, world-eating AI future, and markets almost never deliver on “perfection narratives.” NVDA trades at extreme valuation multiples for a hardware-driven, highly cyclical business. Those multiples only hold if AI infrastructure spending keeps compounding at its current breathtaking pace for years. But that demand is dangerously concentrated in a handful of hyperscalers who are spending now and rationalizing later. Michael Burry’s recent argument sharpens this point: he claims true end-demand for AI horsepower is vastly overstated, and that much of the current GPU frenzy is a self-reinforcing loop of capital, hype, and accounting gimmicks rather than broad, organic need. If boards pause to question real ROI, or if the circular funding loop breaks Nvidia’s revenue curve can flatten quickly, dragging the valuation down with it.
Competition, long dismissed by NVIDIA bulls, is another structural headwind. AMD is now shipping accelerators that hyperscalers are actually integrating, and every major cloud provider is building in-house silicon to reduce dependence on NVDA’s margins. Even if Nvidia maintains leadership, it doesn’t need to lose the crown to lose the multiple, slight shifts in workload allocation or a handful of missed design wins are enough to pressure margins. And Burry’s critique deepens this point: he argues Nvidia’s reported profitability is flattered by depreciation assumptions and massive stock-based compensation that buybacks have failed to offset, meaning the “true” economic profit is less bulletproof than headlines suggest. Add to that the fact that U.S. export controls have effectively erased the China data-center market, once 20–25% of revenues and expectations of a seamless global TAM look increasingly unrealistic.
Technically, NVDA is doing exactly what a euphoric, overowned stock does when gravity starts tugging: momentum is fading, the price is slipping under short-term moving averages, and reactions to spectacular earnings have been strangely sluggish. That’s often the early signature of distribution rather than accumulation. And this lines up directly with Burry’s broader thesis: when a narrative becomes crowded and reflexive, the slightest wobble triggers violent air pockets. NVDA has become the ultimate proxy for the AI boom, the most crowded long in the market, meaning it’s the first thing funds sell when risk appetite cools, and the last thing buyers chase during corrections.
Put simply, Nvidia is a phenomenal company priced as if nothing can ever go wrong, while Burry is arguing that much of what looks “perfect” is not what it seems. The bear case isn’t that Nvidia collapses. It’s that the AI boom normalizes, competition accelerates, accounting realities catch up, margins slip toward something earthbound, and investors recalibrate how much they’re willing to pay. In that world, NVDA doesn’t need bad news to fall. It only needs the news to arrive slightly less euphoric than the fantasies currently baked into the price.
#NVDA #Bearish #HeadandShoulders #MichaelBurry

Russell 2000: Is the lagging small-cap about to charge higher?Russell 2000 is the laggard, while the S&P 500, Nasdaq, and Dow scale new record highs.
Could small caps be next to break out?
While all major US equity indices are hitting new all-time highs, the Russell 2000 is still consolidating just below resistance. This sets up a pivotal moment for traders as the Fed decision looms and Q4 earnings heat up.
Price is holding above the lower trendline of a potential ascending triangle pattern, with buyers defending support and momentum building for a potential breakout above peak resistance.
RSI on a daily basis sits in the mid-50s (neutral), but with room for renewed upside if a breakout occurs. Alternatively, a reset down to oversold could lead to a short-term decline of around 5% to the prior bottom.
But October’s strong earnings and increased bets on Fed rate cuts provide a positive tailwind for small caps this quarter.
Watch for a shift in flows from big tech and mega-caps to small caps if market breadth improves post-Fed.
Keep an eye on the top, as a breakout could open the door to new all-time highs and fresh momentum for the Russell 2000. Don’t miss the rotation potential as Q4 trading picks up.
This content is not directed to residents of the EU or UK. Any opinions, news, research, analyses, prices or other information contained on this website is provided as general market commentary and does not constitute investment advice. ThinkMarkets will not accept liability for any loss or damage including, without limitation, to any loss of profit which may arise directly or indirectly from use of or reliance on such information.

27/10/25 Weekly OutlookLast weeks high: $115,481.36
Last weeks low: $106,688.94
Midpoint: $111,085.15
It's FOMC week again and with it comes speculation and volatility. With the Fed forecast to cut rates another 0.25% where does this leave Bitcoin?
After weeks of consolidation between $106,000 - $111,000 BTC broke above $112,000 resistance level suggesting that sellers have largely been absorbed and momentum is returning to the upside. Trading volume surged as BTC crossed the $112,000 threshold, indicating strong conviction from both institutional and retail participants.
Short-term volatility is expected around the FOMC announcement, I would not rule out a $112,000 retest, it would be a good indicator of just how strong this breakout move is. Macro conditions continue to favor Bitcoin’s long-term bullish case particularly if the Fed signals an eventual shift toward easing in 2026 which is already being discussed.
The next major test lies around $120,000 if weekly high resistance is flipped, but a decisive close above this threshold would likely trigger another wave of momentum buying toward $125K and beyond.
For the bear case a loss of $112,000 would mean a revisit of the same $106,000 - $111,000 range and an increasing loss of momentum for the bull run.
Good luck this week everybody!

Is the Yellow Metal Ready to BUST Out?Hold onto your hats, traders!
It's been a very wild ride in the FX_IDC:XAUUSD market, proving that what goes up (to a Double Top 🏔️🏔️) must come down (with a vengeance!). After a decisive rejection at the $4381 peak, Gold took a spectacular 8.64% dive last Tuesday, landing sharply at the $4002 low 📉. Talk about a waterfall! 🌊
But don't count the bulls out yet! Gold showed some backbone, bouncing 3.97% back up to $4161 before settling into a cage match. It's now consolidating in a classic Triangle pattern (a.k.a. Compression) 📐, ranging from the $4002 floor up to the stronger resistance near $4135.
The Great Consolidation: Triangle Tension 😮💨
The key takeaway? That $4000 psychological support is a BEAST. 💪 It survived test after test during the Asia, EU, and US sessions last Tuesday and Wednesday! This resilience allowed Gold to build support: first at the $4065 level (the Fib 0.382) and then down to the $4043 low, followed by rock-solid support near the $4000 zone.
As Friday closed out the week, Gold was still testing the lower $4100 area, pulling back to $4096. So, what’s next for the shiny metal?
That $33 candle Friday, was a direct reaction to the release of the slightly softer-than-expected US September Consumer Price Index (CPI) inflation data.
My Outlook: Patience is Gold, But the FED is Key 🔑
While some market watchers are singing a bearish tune 🐻, I see this as a healthy consolidation phase. Gold has already corrected 50% from its massive move (from $3631 low to the $4381 high). While a deeper correction to the 0.618 Fib at $3918 is possible, I don't see the catalyst right now to push it that far.
My bet? Gold will continue to consolidate in $4050 - $4150 range until the major announcement from the FED 🏦. The sharp reversal from the Double Top might just be the clean-out needed to launch prices higher once the rate cut announcement (or even just the dovish talk of future cuts) takes place! The last inflation data was a mixed bag, which gives the FED room to sound reassuringly dovish.
The FED Announcement is the main event this week. Mark your calendars! 🗓️
🔥 Key Economic Events: Central Bank Super Week! 🔥
This week is absolutely jammed with market-moving events across the globe. Get ready for volatility! 🌪️
Monday, October 27, 2025
8:30 AM ET: USD 🇺🇸 Durable Goods Orders (MoM) (Sep)
10:00 AM ET: USD 🇺🇸 New Home Sales (Sep)
Tuesday, October 28, 2025
10:00 AM ET: USD CB Consumer Confidence (Oct)
Wednesday, October 29, 2025 (The Fed Day) 🏦
All Day: HKD Holiday - Chung Yeung Day
9:45 AM ET: CAD BoC Interest Rate Decision
10:30 AM ET: USD Crude Oil Inventories
2:00 PM ET: USD Fed Interest Rate Decision
2:30 PM ET: USD FOMC Press Conference
10:00 PM ET (Approx.): JPY BoJ Interest Rate Decision
Thursday, October 30, 2025 (ECB and GDP Day)
2:00 AM ET: EUR German GDP (QoQ) (Q3)
4:00 AM ET: EUR German CPI (MoM) (Oct)
8:15 AM ET: EUR Deposit Facility Rate (Oct)
8:15 AM ET: EUR ECB Interest Rate Decision (Oct)
8:30 AM ET: USD GDP (QoQ) (Q3)
8:45 AM ET: EUR ECB Press Conference
9:30 PM ET: CNY Manufacturing PMI (Oct)
Friday, October 31, 2025 (Inflation and Month End)
6:00 AM ET: EUR CPI (YoY) (Oct)
8:30 AM ET: USD Core PCE Price Index (MoM) (Sep)
8:30 AM ET: USD Core PCE Price Index (YoY) (Sep)
9:45 AM ET: USD Chicago PMI (Oct)
-------------------------------------------------------------------------
This is just my personal market idea and not financial advice! 📢 Trading gold and other financial instruments carries risks – only invest what you can afford to lose. Always do your own analysis, use solid risk management, and trade responsibly.
Good luck and safe trading! 🚀📊

Gold smashes record high: Gov shutdown + EOM flows drive rallyGold hit fresh all-time highs above $3,875 as multiple catalysts converged on September 30th. Let's break down the perfect storm driving this bull run and critical technical levels ahead.
Key Market Drivers:
US Government Shutdown: Congress fails to agree on fiscal budget by tonight's deadline – no jobs data Friday, Fed flies blind into October meeting
Fed Rate Cut Odds: 89% probability of October cut, 65% chance of December follow-up as economic data blackout begins
China's Golden Week: 8-day market closure starting tomorrow removes world's largest gold consumer from active trading
End-of-Month Flows: Quarter-end portfolio rebalancing adding fuel to momentum
Technical Analysis:
Triangle Breakout : Confirmed breakout from major consolidation pattern
Fibonacci Targets : 200% extension at $3,885 (current area), next target $3,920
Elliott Wave Count : Approaching potential 5th wave completion near $4,000
RSI Setup: Flat momentum suggests another leg higher before divergence
Trading Levels:
Resistance: $3,885 (200% Fib), $3,920 (triangle target), $4,000 (psychological)
Support: $3,830, $3,790 (swing low), $3,750 (triangle support)
Channel: Ascending channel intact – trend bullish while above support
Strategy :
Bullish Bias : Continuation above $3,850, target $3,920-$4,000
Risk Scenario: IF (possible) government deal reached, watch for profit-taking to $3,790
Stop Loss: Above $3,910 for any short-term correction trades
A historic confluence of political dysfunction, monetary policy uncertainty, and technical breakout adds to bullish bias.
This content is not directed to residents of the EU or UK. Any opinions, news, research, analyses, prices or other information contained on this website is provided as general market commentary and does not constitute investment advice. ThinkMarkets will not accept liability for any loss or damage including, without limitation, to any loss of profit which may arise directly or indirectly from use of or reliance on such information.

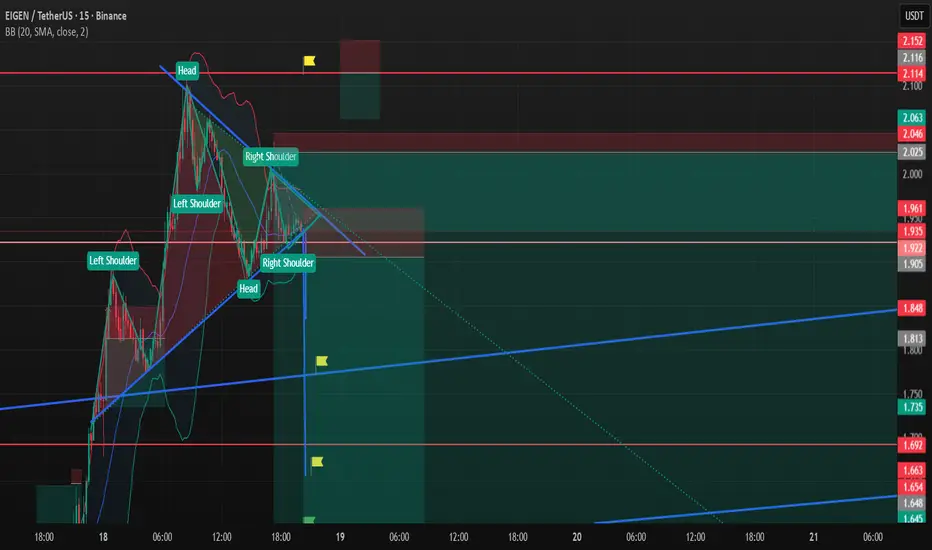
Eigen Short SetupI couldnt publish targets for the last idea it was in rush here I am for the second chart of the same position and also I added a new short position you can follow if you couldnt catch
There is both bullish and bearish head and shoulder formation I assume bearish version will work
Always manage your own risks this is not a investment advise I am not responsible neither your loss nor profit.
Targets
TP1 Blue trendline
TP2 1.658
TP3 1.590
BTC End of Q3 Setup Now that FOMC is over and the FED finally cut interest rates by 25bps, what does this mean for BTC in the short term future and beyond?
It has been known for a while that the September FOMC would bring a cut to interest rates and that is what we got, generally this was priced into the market and despite some low time frame volatility not much has changed in terms of % move in the last day.
However, the macro does look bullish from here. Flipping $117,500 opens up the possibility of a range high test. For me this is the direction I'm leaning towards given the macro and how seasonality suggests a stronger end to the year especially after a rate cut.
Should BTC fail to break above the grey box BTC stays within the same constraints it's had for the last month.

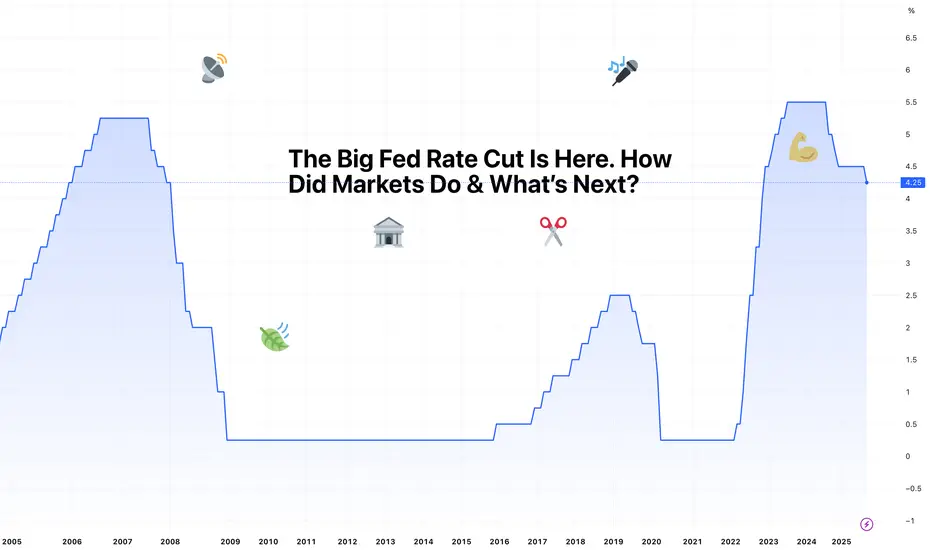
The Big Fed Rate Cut Is Here. How Did Markets Do & What’s Next?“ Best we can do is 25bps ,” officials, probably, when they gathered to lower the federal funds rate. It wasn’t the 50 basis points some of you had expected. But you also didn’t expect to hear that two more trims are most likely coming by year end.
Let’s talk about that and what it means for your trading.
🎤 Powell Delivers
The Federal Reserve finally trimmed rates for the first time in nine months, cutting the federal-funds rate by 25 basis points to 4%–4.25%. This was hardly a surprise.
Markets had already fully priced in a quarter-point move. But the real twist was the Fed boss hinting at two more cuts this year. With just two FOMC meetings on the calendar, it’s pretty clear: unless something changes dramatically, traders should expect a cut at both.
The decision wasn’t unanimous. Newly minted, Trump-appointed Fed governor Stephen Miran wanted to go big or go home with a 50bps slash. Powell, though, balanced his message by saying risks to the labor market had grown while inflation was still running at 2.9% (way above target).
What does this mean? The Fed’s dual mandate of price stability and full employment is officially leaning toward protecting jobs at the risk of flaring up inflation.
💵 Dollar Takes a Dive
The immediate reaction was classic. A weaker dollar is the natural byproduct of lower rates, and the greenback obliged by sliding against major peers.
The FX:EURUSD pushed toward $1.19, its highest in four years, while the FX:GBPUSD tested $1.37 and the FX:USDJPY sank below ¥146.
For forex traders, this was textbook: lower yields make the dollar less attractive, especially compared to rivals with steadier or higher returns. But that was a reaction to the initial shock.
By early Thursday the dollar bounced back, because markets love to overreact before correcting, but the broader trend is still tilted bearish .
📈 Stocks: Buy the Rumor, Sell the News
Stocks were less enthusiastic. The S&P 500 SP:SPX hovered near flat, the Nasdaq Composite NASDAQ:IXIC slipped 0.3% for a second straight loss, and the Dow Jones TVC:DJI managed to buck the trend with a 260-point climb.
The takeaway? Traders had already bought the rumor of rate cuts, jammed their cash into equities, so when Powell delivered the expected 25bps, it wasn’t enough to light another fire.
The bigger hope lies in those promised future cuts, which could set the stage for another push higher – especially if Big Tech earnings hold up through the third quarter. (For the record, earnings season is almost here.)
Thursday's futures contracts were showing a big jump ahead of the opening bell with Nasdaq futures up by more than 1%.
🟡 Gold Shines, Then Stumbles
Gold OANDA:XAUUSD did what gold usually does when the Fed loosens policy: it powered up. Bullion was surfing on the high point of its all-time record of $3,700, before sliding back under $3,640.
What’s the logic behind rising gold prices and a falling dollar? In a low-yield environment, non-yielding assets like gold look more attractive, and a weaker dollar only sweetens the deal for overseas buyers.
Still, this week’s whipsaw reminded everyone that gold is no straight line up – momentum is there, but so are the bears guarding resistance.
🟠 Bitcoin Shrugs
Crypto was more muted. Bitcoin BITSTAMP:BTCUSD slipped 1.2% after the cut, dipping toward $115,000, only to bounce back above $116,000 the next morning.
For the orange coin, the Fed story is just background noise. Institutional inflows and ETF demand remain the key drivers, and traders are still gauging whether crypto wants to behave like a risk asset or play its “digital gold” role.
Still, the OG coin remains off its $124,000 record from mid-August , the market seems caught between consolidation and correction.
⚖️ The Balancing Act
The Fed’s challenge is clear: unemployment is rising, job gains are slowing , and payrolls have been revised lower for months.
At the same time, inflation has crept back up, with core prices still well above target. Cutting too much risks reigniting price pressures; cutting too little risks a labor-market slide that could snowball into recession.
Powell chose the middle ground – a modest 25bps – and teased with two more to calm investor nerves.
👀 What’s Next?
Markets now have a new playbook: watch every jobs report ECONOMICS:USNFP , every CPI ECONOMICS:USCPI release, and every Powell presser between now and December.
If job creation continues to cool, the Fed will likely follow through with the cuts. If inflation heats up, those cuts may get scaled back. And if both trends stall, expect chop – the dreaded sideways trade that tests everyone’s patience.
What can you do in this situation? One message is to stay nimble. The dollar’s longer-term weakness is reshuffling the forex space, gold is on the cusp of a breakout, and stocks remain in record territory. And crypto is doing its usual unpredictable mood swinging.
In a nutshell, Powell gave markets a gift in the form of liquidity, but as history reminds us, the Fed giveth and the Fed taketh away.
👉 Off to you : What’s your strategy in this market? Now that you have the cut (and two more likely on the way), are you bullish or bearish? Share your thoughts in the comments!
Federal Reserve Time: Rate Cut Decision AheadFederal Reserve Time: Rate Cut Decision Ahead 🕰️📉📈
Chart:
Today is not just another day — it’s Federal Reserve Day , and Bitcoin is coiled at a key inflection point. The chart? It’s loud and clear:
We’re sitting directly at the 117,384 resistance — the same major S/R level we've tracked since March 2023. 📍
🎯 If the Fed delivers a 0.25% cut (which CME odds say is 94% likely):
✅ 60% chance of breakout
🎯 Target: 138,888
But...
🔥 A surprise 0.50% cut could mean a 90% breakout probability and clean push through 118,400.
On the flip side...
⚠️ No rate cut? Expect fireworks — and not the good kind. That sets us up for a potential rejection with 95% chance of downside toward 100,831 .
💡 My plan is simple and level-based:
Long above 117,384
Short below 117,384
We’ve seen this movie before. 2019 rate cuts under Trump triggered brief rallies, but the long-term move was muted. History rhymes — but price action leads.
Mindset Check 🧘
"Markets thrive on expectation, not news. Most trades are won before the announcement — on the chart, not on the feed."
One Love,
The FXPROFESSOR 💙
Disclaimer: Everything shared here is opinion-based and for discussion purposes. It is not financial advice. Always do your own research and trade responsibly.

HARD SHORTMy former analysis successfully landed to target zone. And now market wants a pull back.
1-Above there is low liqudation
2-Next week we will probably see a rate cut. thats why I am a little nervous abot open short
3-Till that day I think whales will chase cheap asset that is where my courage come from
4-Market wants to see a pull back
be careful about short you may just want to open long at the below
Always manage your own risks this is not a investment advise I am not responsible neither your loss nor profit.

XRP wave5 to $4.29 Loading (ABCDE) Corrective wave near completeXRP wave5 to $4.29 Loading (ABCDE) Corrective wave near completion
we may or may not sweep the low, but the next move after will be historric. dont miss it., dont get tricked out.

DXY Intraday Overview- US Dollar Index (DXY) breached the symmetrical triangle downwards and sustained downwards.
- It indicates that sellers are still strong, hence the structure remains downwards.
🔽 If the immediate support level of 97.80 (fib level 0.786) is broken again, then the price will continue its fall to the next support zone between 97.56 - 97.50
🔼 However, if the price manages to recover and break through the resistance level of 97.90, we can expect a further rise to the level of 98.00.

Gold Projections (Highly Volatile)GOLD Breaks Through The Historic Milestone of $3500
And Hit a RECORD HIGH of 3508.75
Why?
* The Sep Fed Rate Cut Expectations are Getting Stronger -
* The possibilities of a min of 25 bps cannot be rejected
* Powell will blame weaker labor markets for the rate cuts as inflation are already high and sticky.
Technical Analysis
Gold breached the ascending wedge formation on a Daily TF
While also breaking the previous all-time high of 3500
A close above the 3500 level today will raise the probabilities of a further upward rally till at least the 3520 -3530 zone.
A failure to sustain above the 3500 level might witness some strong corrections in gold due to profit bookings from ATH level

Gold, Silver soar on rate cut hopes & Trump tariff rullingGold and silver are making headlines as both metals surge amid a mix of macroeconomic and technical factors. Gold is trading just below its all-time record, having recently touched $3,495 per ounce, while silver has soared to a 14-year high of above $40.50.
The main catalyst behind this rally is growing confidence that the Federal Reserve will cut interest rates soon, following dovish signals from Fed officials and signs of a softening US job market. With markets now pricing in a 90% chance of a rate cut, the US dollar has weakened, making non-yielding assets, such as gold and silver, more attractive. The recent US court ruling that deemed most of President Trump’s tariffs illegal has added further pressure on the dollar, while thin trading conditions due to a US bank holiday have amplified price moves.
Bullish signals for gold and silver are strong. Both metals are also benefiting from tight supply conditions and ongoing geopolitical uncertainty, which are driving investors toward safe-haven assets.
Gold is consolidating just below record highs, and technical analysis points to a potential breakout from a bullish symmetrical triangle pattern. If confirmed, this could propel gold toward new highs, with targets in the $3,550–$3,820 range.
Silver’s rally is supported by a classic pennant formation, with technical projections suggesting a move toward $42 is possible in the short term.
However, there are bearish risks to consider. If upcoming US employment data surprises to the upside or inflation remains stubbornly high, the Fed could delay or scale back rate cuts, which would strengthen the dollar and potentially cap further gains in gold and silver.
Additionally, both metals are trading near major resistance levels, and a failure to break out convincingly could trigger profit-taking or a technical pullback. For gold, support sits around $3,440, with the 50-day moving average at $3,350 providing a key floor. For silver, a drop below $39.55 could signal a short-term reversal.
While the setup favours further upside, especially if the Fed delivers on market expectations, traders should stay alert to key data releases and resistance levels that could shift the narrative in either direction.
This content is not directed to residents of the EU or UK. Any opinions, news, research, analyses, prices or other information contained on this website is provided as general market commentary and does not constitute investment advice. ThinkMarkets will not accept liability for any loss or damage including, without limitation, to any loss of profit which may arise directly or indirectly from use of or reliance on such information.

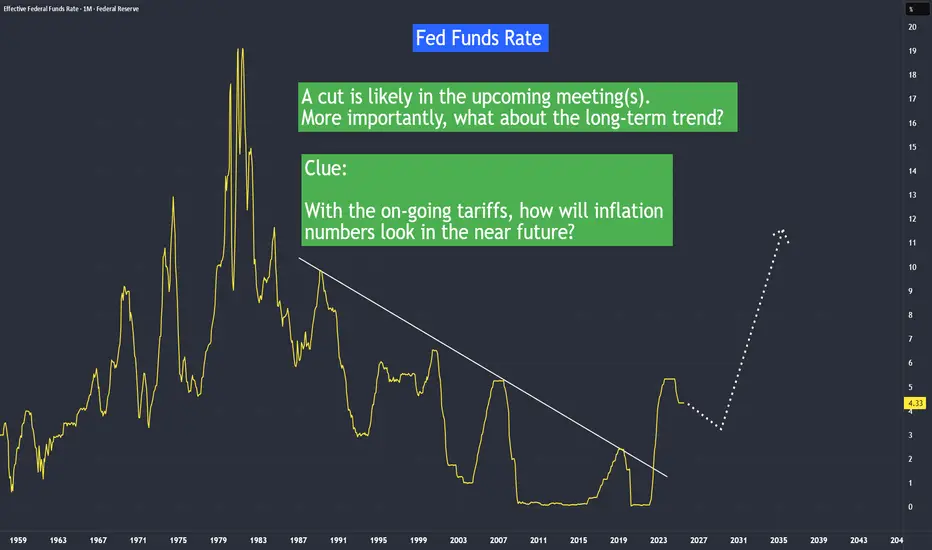
Interest Rate Projection In April, inflation was at its lowest point. It was also the month when the 'Liberation Day' tariffs were introduced, applying a 10% baseline tariff to most countries.
But it wasn’t until August—when the July Core CPI rose to 3.1% from its April low of 2.8%— and now investors began to question whether inflation will be trending higher in the near future with now higher tariffs set in after 1st August.
With a lower non farm payroll or job created the last three months, Fed has to pivot to the economy and likely to ease rates. The real challenge will be lower job numbers and higher inflation number in the coming months.
Which side will Fed pivot to?
Recession or Inflation?
10 Year Yield Futures
Ticker: 10Y
Minimum fluctuation:
0.001 Index points (1/10th basis point per annum) = $1.00
Disclaimer:
• What presented here is not a recommendation, please consult your licensed broker.
• Our mission is to create lateral thinking skills for every investor and trader, knowing when to take a calculated risk with market uncertainty and a bolder risk when opportunity arises.
CME Real-time Market Data help identify trading set-ups in real-time and express my market views. If you have futures in your trading portfolio, you can check out on CME Group data plans available that suit your trading needs tradingview.com/cme/
Bitcoin back at 112k: Bullish Illusion or Bearish Truth?1. What happened lately
In my previous BTC analysis, I mentioned that as long as the 110k zone holds, the bullish structure technically remains intact.
On Friday, Powell’s speech lifted the market precisely from that zone, as the possibility of rate cuts injected optimism across risk assets, including crypto.
2. The psychological trap
But here’s the question I keep asking myself: is this genuine strength, or just wishful thinking? I’ve said it many times — trade what you see, not what you hope for . And what the charts are showing right now is not as promising as the initial bounce might suggest.
3. Technical signals
- BTC quickly returned to the 112k support level, erasing the Friday rally.
- Price remains under the trendline that started in April.
- The bounce looks more like a retest of broken levels than a new impulsive leg.
- Structurally, we can even identify a head and shoulders pattern with the neckline around the 110k zone, although not perfectly shaped.
4. Reading between the lines
It’s hard for me to believe that Bitcoin came back to the same support just to give latecomers another easy buying opportunity. More likely, the “rate cut euphoria” was dead cat bounce, and the market is telling us something different than the headlines.
5. Conclusion
At this moment, I remain neutral in my positioning but leaning bearish in my outlook. Optimism is tempting, but discipline requires us to trust the charts, not our hopes.
And... if it looks like a duck, walks like a duck, and quacks like a duck… it’s probably a duck. 🦆

US Dollar: Bearish August. Rate Cuts Likely. Sell USD?Welcome back to the Weekly Forex Forecast for the week of Aug 25 - 29th.
In this video, we will analyze the following FX market: USD Dollar
The USD has been weak since the start of August. It took a huge move down Friday with FED Chairman Powell's dovish take on rate cuts.
So, this market is is not one to take buys in.
However, we are still in correction territory, looking at the Monthly and Weekly candles. Be mindful that the market can find support at current levels, even though it has been bearish for 7+ months. The Swing Low has not been violated as yet.
Be cautious. No buys are justified without a Bullish BOS. Sells are the best best, but keep your head on a swivel!
React and do not predict.
Enjoy!
May profits be upon you.
Leave any questions or comments in the comment section.
I appreciate any feedback from my viewers!
Disclaimer:
I do not provide personal investment advice and I am not a qualified licensed investment advisor.
All information found here, including any ideas, opinions, views, predictions, forecasts, commentaries, suggestions, expressed or implied herein, are for informational, entertainment or educational purposes only and should not be construed as personal investment advice. While the information provided is believed to be accurate, it may include errors or inaccuracies.
I will not and cannot be held liable for any actions you take as a result of anything you read here.
Conduct your own due diligence, or consult a licensed financial advisor or broker before making any and all investment decisions. Any investments, trades, speculations, or decisions made on the basis of any information found on this channel, expressed or implied herein, are committed at your own risk, financial or otherwise.
