AUDUSD surges on hawkish RBA mins! Breakout or double top?AUDUSD is surging towards the 0.67 handle following hawkish RBA minutes that discussed a rate hike in 2026. However, with a potential double top forming and RSI divergence looming, we face a critical decision point: breakout to new 2025 highs or a sharp reversal, or both?
In this video, we analyse the RBA's hawkish stance vs. the Fed's easing path and what that means for the Australian dollar. We then map out the technicals around 0.6710, with a breakout strategy targeting 0.68–0.69 as well as a bearish reversal idea if momentum fails.
Key drivers
Hawkish RBA : Minutes released today show the RBA board discussed raising rates in 2026 to contain inflation, a contrast to the Fed's easing cycle. This divergence is the primary driver lifting AUD.
Double top risk : Price is approaching the 0.6700–0.6710 zone, a major resistance level and a prior high. Failure to break higher could confirm a double top pattern.
RSI divergence : On the daily chart, price is making new highs while the RSI remains below its previous peak (hidden bearish divergence). This warns of waning momentum and a potential pullback, though RIS is not in overbought territory just yet.
Upside targets : A clean daily close above 0.6710 invalidates the divergence and opens the door to 0.6758 (Fib extension), 0.6800 (psychological), and 0.6910 (61.8% projection).
Downside support : If 0.6700/10 sees a rejection, watch for a pullback to 0.6650 and the major support at 0.6594 below 0.6600. Losing this level confirms a deeper correction toward 0.6550.
Are you buying the breakout above 0.6700 or selling the double top? Share your trade plan in the comments and follow for more FX analysis.
This content is not directed to residents of the EU or UK. Any opinions, news, research, analyses, prices or other information contained on this website is provided as general market commentary and does not constitute investment advice. ThinkMarkets will not accept liability for any loss or damage including, without limitation, to any loss of profit which may arise directly or indirectly from use of or reliance on such information.
RBA

AUDUSD moves sideways after the RBA holds rates steady
The RBA turned hawkish after holding the rate at 3.60%. The central bank acknowledged that inflation risks have increased despite three rate cuts since Feb, noting that recovering demand and rising wages are making it more difficult to return inflation to the target.
Governor Bullock emphasized that the RBA remains focused on inflation and signaled that, if price pressures persist, the bank may need to take appropriate action.
With policy divergence widening between the Fed and the RBA, the aussie dollar may continue to appreciate against the US dollar.
AUDUSD slightly broke below the ascending channel's lower bound before consolidating within the range of 0.6620–0.6650. The price remains above bullish EMAs, indicating a potential uptrend extension.
If AUDUSD reenters the ascending channel, the price may retest the following resistance at 0.6650.
Conversely, if AUDUSD breaks below EMA21 and the support at 0.6620, the price may retreat toward the next support at 0.6580.

AUD/CNY: Are Rates Hiding a Deeper Revolution?
The Australian Dollar (AUD) has shown remarkable resilience against the Chinese Yuan (CNY) in late 2025, driven by a complex interplay of monetary steadfastness and strategic trade realignments. Following the Reserve Bank of Australia's (RBA) decision to hold the cash rate at 3.6% a "hawkish hold" signaling persistent inflation concerns, the AUD/CNY pair is reacting not just to interest rate differentials, but to deeper structural shifts in the global economy.
Macroeconomics: The Divergence Trade
The primary driver remains the divergence in monetary policy. The RBA’s decision to maintain rates at 3.6% contrasts sharply with the People’s Bank of China (PBOC), which continues to battle deflationary pressures with liquidity injections.
RBA Stance: With inflation easing but "sticky" in service sectors, the RBA refuses to pivot to cuts, effectively setting a floor for the AUD.
China’s Reality: Despite a surprising 5.7% jump in exports in November 2025, China's domestic demand remains tepid. This pushes the PBOC to keep the Yuan relatively loose to support the export engine, inadvertently strengthening the AUD/CNY cross.
Geopolitics & Geostrategy: The "Fragile Thaw"
The geopolitical landscape has shifted from hostility to a pragmatic "fragile thaw." The removal of the final trade barriers on Australian exports, such as rock lobster, has reopened and improved capital flows. However, the strategic environment remains tense.
Strategic hedging: Australia is balancing its largest trading partner (China) with its primary security partner (the USA).
AUKUS Factor: Defense alliances continue to create underlying friction, ensuring that while trade flows, political trust remains low.
Industry Trends & Science: The Green Steel Revolution
A critical driver for the AUD is the transformation of the iron ore trade. It is no longer just about volume; it is about quality suitable for "green steel."
Science of Decarbonization: Low-grade ore is insufficient for hydrogen-based steelmaking. Australia’s high-grade hematite is becoming a premium scientific input for China’s decarbonization targets.
December 2025 MoU: The recent signing of a Memorandum of Understanding on steel decarbonization between Canberra and Beijing highlights this technological interdependence.
High-Tech & Patent Analysis: Critical Minerals
The narrative has shifted from bulk commodities to strategic tech inputs. Australia is not just shipping dirt; it is supplying the inputs for high-tech dominance.
Zirconium & Lithium: These minerals are essential for nuclear energy, hypersonic missile components, and EV batteries.
Patent Implications: As China advances its high-tech patent portfolio in renewable energy, it becomes increasingly dependent on Australian raw materials that meet specific purity standards. This reliance underpins the AUD's value as a "proxy" for global tech supply chains.
Cyber & Technology: Protecting the Supply Chain
With the integration of AI and automation in mining (e.g., Rio Tinto’s autonomous trains), cyber resilience has become a tier-one priority.
IP Protection: Australian mining tech is proprietary. Protecting the data streams of autonomous logistics from state-sponsored cyber espionage is now a board-level issue.
Export Controls: Tighter export controls on "strategic technologies" ensure that while Australia sells the minerals, it protects the processing IP, adding a premium to the Australian mining sector's valuation.
Leadership & Business Models: The ESG Pivot
Australian corporate leadership has pivoted business models from "dig-and-ship" to "value-driven partnerships."
Culture of Compliance: Management teams are prioritizing ESG (Environmental, Social, and Governance) credentials to meet both Western investor demands and Chinese regulatory requirements for lower-carbon inputs.
Innovation: Companies are investing heavily in on-site beneficiation (processing ore to higher grades), fundamentally changing the value proposition and supporting the currency through higher-margin exports.
Conclusion: A Currency of Complexity
The AUD/CNY increase is not a simple story of interest rates. It is the result of Australia successfully navigating a geopolitical tightrope while upgrading its industrial base to meet the scientific demands of a decarbonizing world. Traders must watch not just the RBA, but the flow of high-tech minerals and the evolving diplomatic dance between Beijing and Canberra.
K ey Takeaway: The AUD is evolving from a "risk-on" commodity currency into a "strategic resource" currency. Trade it with an eye on geopolitical headlines as much as economic data.

Is the Aussie Awakening a Mirage?The Australian Dollar is staging a formidable recovery, driven by a stark divergence in central bank leadership and shifting geopolitical tides. As the pair approaches the critical 0.6600 resistance, we analyze the multi-domain factors fueling this ascent.
Geopolitics & Geostrategy: The Stability Premium
Global capital is currently re-evaluating the "safety" premium. The US grapples with political gridlock and government shutdown threats. Meanwhile, Australia presents a geostrategic anchor in the Asia-Pacific. The AUD is benefiting from a "stability premium" as investors rotate out of the uncertainty plaguing the US Dollar. Furthermore, renewed hopes for European peace deals have buoyed global risk sentiment. This shift disproportionately benefits high-beta currencies like the AUD over the safe-haven USD.
Management & Leadership: Bullock vs. Powell
The divergence in governance between the Reserve Bank of Australia (RBA) and the Federal Reserve drives this trend. RBA Governor Michele Bullock displays assertive leadership, maintaining a hawkish stance to combat sticky inflation. In contrast, the Federal Reserve appears reactive, with markets pricing in a high chance of a December rate cut. This leadership contrast—steadfastness versus capitulation is steering capital flows toward the AUD.
Industry Trends & Innovation: The Infrastructure Boom
A hidden driver of the AUD’s resilience is a surge in high-tech infrastructure. Q3 GDP data revealed that while household consumption slowed, private investment surged 2.9%. This growth relies heavily on machinery, equipment, and renewable energy projects. This is not just a mining story anymore; it is an infrastructure evolution. Tangible capital expenditure in technology sectors provides a structural floor for the currency that speculative flows cannot match.
Macroeconomics: The Two-Speed Economy
Australia currently exhibits a classic "two-speed" economy. The consumer sector softens under the weight of cost-of-living pressures, yet the business sector aggressively expands capacity. The 0.4% GDP growth missed forecasts, yet the currency rallied. The reason is simple: sticky inflation forces the RBA to keep rates higher for longer. In a world where the US cuts rates, Australia’s high-yield status acts as a powerful magnet.
Business Models: Intellectual Property of Policy
Metaphorically, the RBA holds the "patent" on credible inflation targeting in 2025. Other central banks pivot prematurely, but the RBA’s refusal to cut rates preserves the integrity of their monetary policy. This adherence to mandate over market pressure creates a predictable business environment for foreign investors. It distinguishes the AUD as a currency of yield and integrity in a volatile G10 landscape.
Technical Analysis: The Battle Lines
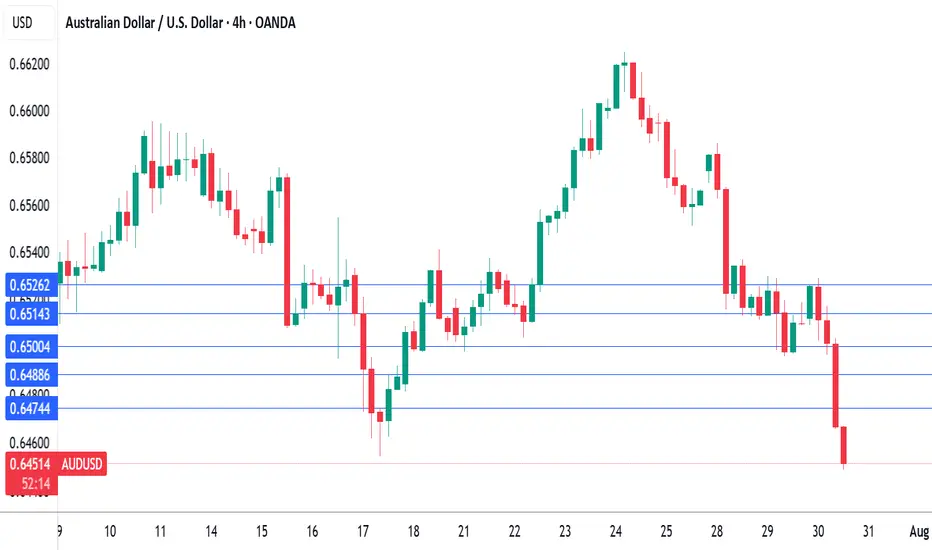
The AUD/USD has executed a V-shaped recovery, bouncing from key support. The pair is now confronting the 2022 trendline at 0.6592/98.
* Bullish Case: A weekly close above 0.6598 invalidates the bearish trend. This opens the door to 0.6651 * and 0.6723 .
* Bearish Case: Failure here triggers a potential "Head and Shoulders" pattern. This targets a retest of 0.6453 .
* Algorithmic Insight: High-frequency traders likely target this specific trendline collision. Expect volatility as human conviction battles automated resistance.
Final Verdict: The fundamental backdrop favors the bulls due to the RBA/Fed policy divergence. However, the technical barrier at 0.6600 is formidable. Traders must watch for a confirmed breakout before chasing this rally further.

Hot CPI Kills Hopes of an RBA CutAustralia's Q3 inflation figures have just dropped, and all surprised to the upside. Not only does this kill hopes of a cut next week — and likely for the rest of the year — but it also suggests the RBA may have already reached the terminal rate of this cutting cycle. I take a quick look at the figures, AUD/USD, and the ASX 200.
Matt Simpson, Market Analyst at City Index and Forex.com.

XAUAUD has more upside potentialGold prices extended gains amid escalating tariff tensions between the US and China, after China sanctioned shipping and the US President affirmed the commitment to maintaining high tariffs on Chinese goods.
Meanwhile, the US government shutdown may introduce additional uncertainty regarding the timeliness of monetary policy in addressing the recently weakening labor market. The postponement of the Non-farm Payrolls (NFP) report raises further concern, as the Fed requires more data to determine its primary focus between the labor market and inflation—its dual mandate—which are currently diverging. Elevated inflation, driven by recent trade policies, requires the Fed to evaluate whether the price increases are transitory or if they will become prolonged and spread to sectors beyond tariff-sensitive goods.
Markets are currently pricing in two additional rate cuts this year but remain uncertain about the outlook for next year, with some Fed officials signaling a cautious stance. Should the labor market continue to deteriorate while inflation remains elevated, the US economy could face stagnation, creating a favorable environment for gold.
In Australia, recent labor data has increased economic uncertainty. The unemployment rate for Sep rose to a four-year high of 4.5% from 4.3% in the previous month, driven by a decrease in job openings and an increase in job seekers concerned about future income prospects. The weakening labor market has lifted market expectations for an RBA rate cut in Nov to over 70% from a previous reading of 40%, weighing on the Australian dollar.
From a technical perspective, XAUAUD is trading within an upward range with expanding EMAs (21,78), indicating strong bullish momentum, though it may face pressure from profit-taking. A breakout above the Fibonacci Extension 361.8% at 6588 could see the price target the Fibonacci Extension 423.6% at 6866. Conversely, a failure to breach the 6588 level could result in a decline to test the support at 6140.
By Van Ha Trinh, Financial Market Strategist at Exness

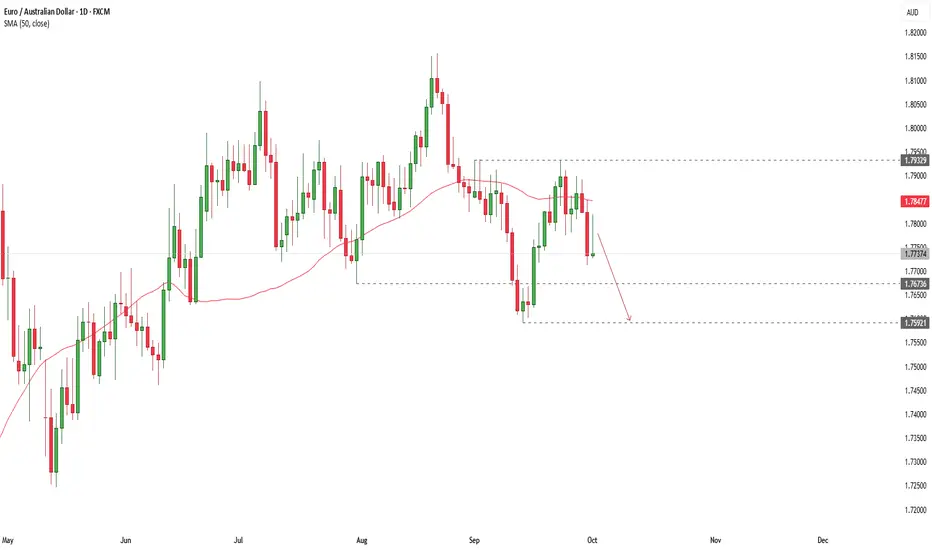
RBA September 2025: Hawkish Tilt vs August - Shorted EURAUDNow that we have the 30 Sept 2025 RBA statement, here’s a side-by-side comparison with the prior (August) statement, highlighting the specific new remarks, data changes, and tone shifts that matter for markets in the short term.
Key Differences: September vs August
Inflation
August: Inflation had eased into the 2–3% band, with underlying momentum lower, helped by rebates and easing pressures.
September: “The decline in underlying inflation has slowed… recent data suggest Q3 inflation may be higher than expected.”
🔹 New: Clearer warning that disinflation is stalling, with upside surprise risk. This is a hawkish tilt, raising doubt about how quickly the RBA will cut again.
Domestic demand & growth
August: Growth outlook was subdued, public demand dominant, consumption weak, risks tilted to downside.
September: “Private demand is recovering… private consumption is picking up as real household incomes rise… housing market is strengthening.”
🔹 New: Stronger domestic recovery narrative. This is a shift away from a purely dovish, weak-growth picture, suggesting easing might not need to be as aggressive.
Labor market
August: Labor conditions softening somewhat, unemployment ~4.3%, some easing in demand.
September: “Labor market conditions broadly steady… unemployment unchanged at 4.2%, underutilization low… wages growth has eased, but productivity weak and unit labor costs high.”
🔹 New: Balanced message — employment growth slowed, but overall labor market remains tight. The mention of unit labor costs high is a hawkish insertion, as it points to sticky wage-price dynamics.
Global risks
August: Emphasized uncertainty, trade headwinds, geopolitical risks, downside to global demand.
September: “More clarity on US tariffs — extreme outcomes avoided, but still adverse effect expected… geopolitical risks remain.”
🔹 New: Slightly more optimistic (less extreme trade risks), but still cautious. Market read: less urgent downside risk, neutral for AUD.
Policy stance / guidance
August: Dovish, emphasized “data dependency,” readiness to act, conditional forward guidance.
September: “Signs that demand is recovering, inflation may be persistent in some areas, labor market stable… appropriate to remain cautious… policy well placed to respond if needed.”
🔹 New: Stronger caution against rushing into more cuts. Less dovish than before, reinforcing a wait-and-see bias.
Tone shift: Compared to August, the September statement is less dovish. It highlights stronger domestic demand, slower disinflation, and sticky unit labor costs.
Implication: This reduces near-term probability of another immediate cut. Markets may pare back November cut expectations slightly.
AUD reaction: Near term (this week and next), AUD likely supported on dips, especially if global risk sentiment doesn’t collapse. AUD currency crosses may see AUD outperformance, while AUDUSD may remain also supported but also more dependent on USD drivers.
Unless we see a major surprise from U.S. Jobs data I will remain short with minimum target at 1.7593
If you have any questions don't hesitate to drop them in the comments below.
RBA's Bullock says inflation under control, Aussie steadyRBA Governor Bullock testified before a parliamentary committee on Monday. Bullock said that inflation was in a "very good position" as higher interest rates had curbed demand. Still, she warned that there inflation risks remained on "both sides".
Bullock was less positive about the geopolitical environment, warning that the significant change in the global trading system which had created massive uncertainty. The Reserve Bank was particularly concerned about the impact of US tariffs on China, Australia's largest trading partner.
Bullock warned that the financial markets had not priced in the risks of the tariffs, which could affect financial stability if the the domstic economy was significantly affected by the tariffs.
The RBA is expected to hold the cash rate at 3.6% at next week's meeting, after lowering rates by a quarter-point in August. The markets have priced in a 10% likelihood of a rate cut at the upcoming meeting, with an 86% likelihood of a cut in November.
There are no US economic releases today but investors will be keeping a close eye on Fedspeak, with five FOMC members scheduled to deliver public remarks. New Fed Governor Miran, who voted for a 50-bp cut at the September 17 meeting, is expected to give a detailed explanation of his view in today's speech.
At last week's meeting, the Fed signaled that more rate cuts were coming and the markets have priced in an October cut at 90%, according to CME's FedWatch. The Fed appears to have shifted to a more dovish stance after maintaining rates since December 2024 until lowering rates last week.
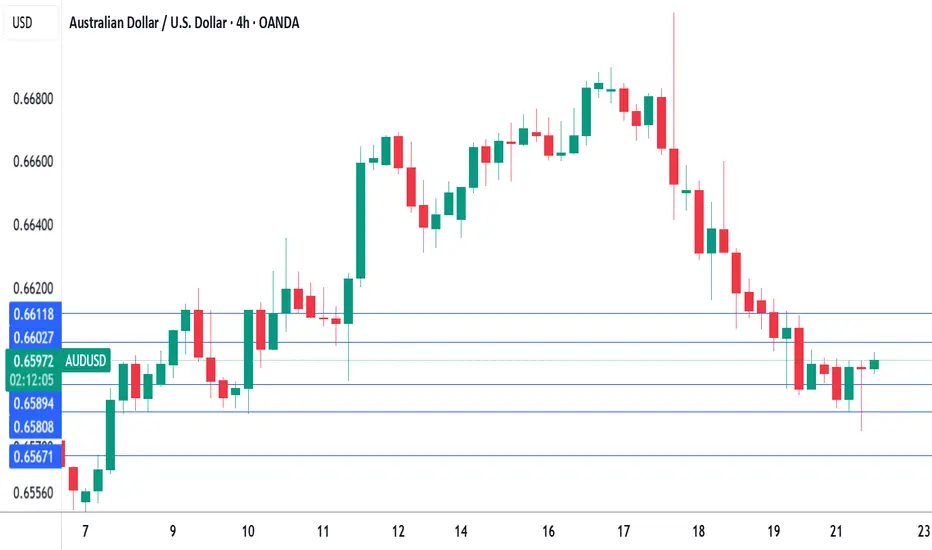
AUDUSD tested support at 0.6589 and 0.6580 earlier. Next, there is support at 0.6567
There is resistance at 0.6602 and 0.6611
Will AUDUSD Continue To Gain On The Theme of a Fed Cut?Fundamental approach:
- AUDUSD edged higher this week amid a softer US dollar. Aug US CPI came in slightly hot but reinforced expectations for a Fed rate cut. RBA policy remained steady following Aug’s cut and a data‑dependent stance.
- US dollar moves were driven by Aug inflation at 0.4% MoM and 2.9% YoY, and a labor market picture softened by benchmark revisions, keeping markets positioned for a Sep Fed easing, which weighed on the greenback.
- Australian policy settings stayed unchanged after the Aug RBA cut to 3.60%, and officials reiterated data dependence, limiting AUD-specific surprises. Risk sentiment improved after the CPI release, adding modest support to pro‑cyclical currencies.
- AUDUSD could gain if the Fed delivers a dovish cut and US data cools further. Next week’s Fed decision and any RBA communications on the release schedule are the key catalysts to watch.
Technical approach:
- AUDUSD broke the ley level at around 0.6600 and rose higher. The price is well above both diverging EMAs, indicating a bullish structure.
- If AUDUSD continues to rise, it may retest the resistance at around 0.6700.
- On the contrary, struggling to close above 0.6700 may prompt a correction to restest the support at 0.6600.
Analysis by: Dat Tong, Senior Financial Markets Strategist at Exness

Technical Analysis Report for the AUS200 (ASX 200)# AUS200 Technical Analysis: Comprehensive Multi-Timeframe Trading Strategy
Executive Summary
Current Price: 8943.0 (August 30, 2025, 12:54 PM UTC+4)
Market Sentiment: Cautiously Bullish with September Seasonality Concerns
Primary Trend: Uptrend with potential consolidation phase
The AUS200 (ASX 200) continues to demonstrate resilience near record highs, with the index climbing 2.48% over the past month and up 10.89% year-over-year. However, technical analysis suggests we're entering the "September Swoon" period, historically the worst performing month for equities.
Market Context & Fundamentals
Economic Backdrop
The Australian market operates within a supportive monetary environment with the RBA recently cutting the cash rate by 25 basis points to 3.60%. After years of steep hikes, the central bank began lowering rates in 2025, with three cuts implemented so far. This accommodative policy stance provides underlying support for equity valuations.
Key Fundamental Drivers
Monetary Policy: Inflation within the 2-3% target range with unemployment remaining low despite slight increases
Economic Outlook: Moderate growth expectations with global uncertainty remaining elevated
Sectoral Rotation: Energy and resources maintaining relative strength
Technical Analysis Framework
Japanese Candlestick Analysis
Weekly Pattern: Doji formation suggesting indecision at current levels
Daily Pattern: Small-bodied candles with extended upper shadows indicate selling pressure at highs
Intraday Patterns: Hammer and shooting star formations prevalent in 1H and 4H timeframes
Elliott Wave Analysis
Primary Count: Wave 5 of larger degree impulse potentially nearing completion
Alternative Count: Extended Wave 3 with further upside potential to 9200-9300
Critical Levels: Wave 4 low at 8750 provides key support structure
Harmonic Patterns
Active Pattern: Potential AB=CD pattern completion near 8950-9000 zone
Fibonacci Confluence: 61.8% retracement of major swing aligns with current resistance
PRZ (Potential Reversal Zone): 8920-8980 represents high-probability turning point
Wyckoff Analysis
Phase Assessment: Late accumulation/early markup phase
Volume Analysis: Decreasing volume on recent advances suggests distribution characteristics
Composite Operator: Large player activity evident in 8900-9000 range
W.D. Gann Analysis
# Time Theory Application
Critical Time Windows:
- September 3-6: High volatility period based on seasonal Gann squares
- September 23: Autumn equinox - significant time cycle
- October 7-14: 90-degree time cycle from previous major low
# Square of 9 Analysis
Current Position: 8943 sits at 299.05° on the wheel
Next Resistance: 9025 (300°) and 9216 (304°)
Support Levels: 8836 (297°) and 8649 (294°)
# Price and Time Squaring
Square of Current Price: √8943 = 94.57
Next square: 95² = 9025 (key resistance)
Previous square: 94² = 8836 (support level)
Ichimoku Kinko Hyo Analysis
Tenkan-sen (9): 8932 (neutral to slightly bullish)
Kijun-sen (26): 8895 (bullish above this level)
Senkou Span A: 8913 (current cloud top)
Senkou Span B: 8847 (cloud bottom support)
Assessment: Price above cloud with bullish bias, but approaching cloud resistance
Multi-Timeframe Technical Indicators
5-Minute Chart (Scalping Focus)
RSI(14): 58.2 - Neutral with slight bullish bias
VWAP: 8938 - Price trading above, confirming intraday strength
Bollinger Bands: Upper band at 8965, suggesting potential resistance
Moving Averages: EMA(20) > EMA(50) maintaining bullish structure
15-Minute Chart (Scalping Focus)
MACD: Bullish crossover pending, histogram improving
Stochastic: 62.8 in neutral zone with upward momentum
Volume Profile: High volume node at 8920-8930 zone
1-Hour Chart (Day Trading)
RSI(14): 61.5 approaching overbought threshold
VWAP: 8925 providing dynamic support
ADX: 28.4 indicating moderate trend strength
Support: 8910, 8885, 8850
Resistance: 8955, 8975, 9000
4-Hour Chart (Swing Trading)
RSI(14): 65.8 in overbought territory
MACD: Positive but showing divergence
Bollinger Bands: Price at upper band, expansion phase
Key Levels: Support at 8870, Resistance at 8980-9000
Daily Chart (Position Trading)
RSI(14): 68.2 overbought but not extreme
Moving Averages: All major MAs aligned bullishly
Volume: Below-average, concerning for sustainability
Pattern: Rising wedge formation suggesting potential correction
Weekly Chart (Long-term View)
RSI(14): 72.1 significantly overbought
MACD: Positive but momentum slowing
Trend: Strong uptrend since October 2024 low
Resistance: 9000-9100 zone represents major overhead supply
Support and Resistance Analysis
Primary Support Levels
1. 8910-8920: Immediate support zone with volume confluence
2. 8870-8885: Previous resistance turned support, multiple touches
3. 8840-8850: 20-day EMA and psychological level
4. 8800-8815: 50-day EMA and structural support
5. 8750-8765: Key weekly support and Elliott Wave 4 low
Primary Resistance Levels
1. 8955-8965: Immediate resistance with Gann and Fibonacci confluence
2. 8980-9000: Major psychological level and distribution zone
3. 9025-9040: Square of 9 resistance and measured move target
4. 9080-9100: Long-term resistance zone and potential wave completion
5. 9200-9250: Extended target based on harmonic pattern completion
Weekly Trading Strategy (September 2-6, 2025)
Monday, September 2, 2025
Market Outlook: Post-weekend gap potential, focus on 8920-8950 range
Strategy: Range trading with breakout preparation
Intraday Levels:
Long Entry: 8920-8925 with stop at 8905
Target 1: 8945
Target 2: 8960
Short Entry: 8965-8970 with stop at 8980
Target 1: 8940
Target 2: 8920
Swing Setup: Monitor for breakout above 8970 for continuation to 9000
Tuesday, September 3, 2025
Market Outlook: Gann time cycle activation, increased volatility expected
Strategy: Trend following with tight risk management
Intraday Levels:
Long Entry: 8930-8935 (if holding above 8920)
Target 1: 8955
Target 2: 8975
Short Entry: 8975-8985 with stop at 9000
Target 1: 8950
Target 2: 8925
Key Events: Watch for reversal patterns near 8980-9000 zone
Wednesday, September 4, 2025
Market Outlook: Mid-week consolidation expected, range-bound trading
Strategy: Scalping opportunities within established range
Intraday Levels:
Range Bottom: 8920-8930
Range Top: 8970-8980
Breakout Levels: Above 8985 (bullish) / Below 8915 (bearish)
Scalp Long: 8925-8930, Target: 8950-8955
Scalp Short: 8970-8975, Target: 8940-8945
Thursday, September 5, 2025
Market Outlook: Potential breakout day, monitor volume for confirmation
Strategy: Breakout trading with momentum confirmation
Breakout Scenarios:
Bullish Breakout: Above 8985 targets 9015-9025
Bearish Breakdown: Below 8915 targets 8885-8870
Volume Requirement: 1.5x average for valid breakout
Intraday Management:
Stop Loss: 15-20 points for scalps, 30-35 points for swings
Position Sizing: Reduce size by 25% given increased volatility
Friday, September 6, 2025
Market Outlook: Weekly close positioning, potential profit-taking
Strategy: End-of-week profit-taking and position adjustments
Weekly Close Targets:
Bullish Scenario: Close above 8960 sets up next week rally
Neutral Scenario: Close 8920-8960 maintains range
Bearish Scenario: Close below 8920 suggests correction beginning
Day Trading Focus:
Morning: Trend continuation from Thursday
Afternoon: Range trading and profit-taking
Risk Management Framework
Position Sizing
Scalping (5M-15M): 0.5-1% risk per trade
Day Trading (1H-4H): 1-1.5% risk per trade
Swing Trading (Daily): 2-2.5% risk per trade
Stop Loss Guidelines
5M Charts: 8-12 points maximum
15M Charts: 12-18 points maximum
1H Charts: 20-30 points maximum
4H Charts: 35-50 points maximum
Daily Charts: 60-100 points maximum
Profit Taking Strategy
Target 1: 1:1 Risk/Reward (50% position close)
Target 2: 1:2 Risk/Reward (30% position close)
Target 3: 1:3 Risk/Reward (20% position close)
Trailing Stop: Implement after Target 1 achievement
Geopolitical and Market Risk Factors
Domestic Considerations
RBA Policy: Economic outlook remains "uncertain" with potential for policy reversals if downside risks materialize
Employment Data: Rising unemployment to 4.3% may influence future policy decisions
Seasonal Patterns: September historically weak for Australian equities
International Factors
US Market Correlation: Strong correlation with S&P 500 performance
China Economic Data: Resource sector sensitivity to Chinese growth metrics
Currency Impact: AUD strength/weakness affecting export competitiveness
Commodity Prices: Iron ore and gold price movements critical for index performance
Event Risk Calendar
September 3: RBA Meeting Minutes release
September 5: US Non-Farm Payrolls (strong correlation impact)
September 17: RBA Policy Decision (potential further rate cut)
September 24: Chinese PMI data release
Sector Rotation Analysis
Outperforming Sectors
1. Energy: Benefiting from geopolitical tensions and supply constraints
2. Financials: Rate cut cycle creating yield curve steepening opportunities
3. Resources: China stimulus hopes and infrastructure demand
Underperforming Sectors
1. Technology: Higher rates historically impacting growth valuations
2. REITs: Competition from rising dividend yields in other sectors
3. Consumer Discretionary: Economic uncertainty dampening spending
Trading Psychology and Market Sentiment
Sentiment Indicators
Put/Call Ratio: 0.85 (slightly bearish)
VIX Equivalent: Elevated but not extreme levels
Insider Trading: Moderate selling activity at current levels
Psychological Levels
9000: Major psychological resistance
8800: Key psychological support
8500: Crisis level support (low probability scenario)
Advanced Trading Setups
Harmonic Trading Opportunities
1. Bullish Bat Pattern: Completion at 8880-8900 zone
2. Bearish Gartley: Potential formation at 9020-9050 levels
3. AB=CD Pattern: Active completion zone 8950-8980
Gann-Based Setups
1. Square of 9 Trades: Long at 297° (8836), Short at 300° (9025)
2. Time Cycle Trades: Reversal zones at September 3-6 window
3. Angle Confirmation: 1x1 angle from August low providing dynamic support
Wyckoff Accumulation/Distribution
Current Phase: Late accumulation (Phase E potential)
Volume Characteristics: Decreasing volume on advances (concerning)
Composite Operator: Evidence of large player distribution above 8950
Technology Integration
Algorithmic Considerations
High-Frequency Impact: Increased volatility during 9:30-10:30 and 14:30-15:30 windows
Order Flow Analysis: Large block transactions evident at 8920 and 8970 levels
Market Microstructure: Bid-ask spreads widening above 8960
Recommended Tools
1. TradingView: Chart analysis and alert systems
2. Market Profile: Volume distribution analysis
3. Order Flow Software: Real-time institutional activity tracking
Conclusion and Weekly Outlook
The AUS200 stands at a critical juncture, trading near historical highs while facing seasonal headwinds and technical exhaustion signals. The combination of supportive monetary policy and strong year-to-date performance provides underlying bullish bias, but elevated RSI readings across multiple timeframes warrant cautious optimism.
Key Themes for September:
1. Range Trading: 8920-8980 likely to contain price action initially
2. Breakout Preparation: Monitor volume for sustained moves beyond range
3. Seasonal Weakness: Historical September underperformance requires defensive positioning
4. Policy Support: RBA accommodation providing floor for significant declines
Recommended Approach:
- Favor range trading over directional bias initially
- Reduce position sizes given elevated volatility expectations
- Focus on high-probability setups with multiple confluence factors
- Maintain disciplined risk management throughout September
The technical analysis suggests a market in transition, where traditional support and resistance levels will be tested against changing fundamental backdrops. Traders should remain flexible and prepared for both continuation and reversal scenarios as the market navigates this critical period.
---
*This analysis incorporates multiple technical methodologies and should be used in conjunction with proper risk management. Market conditions can change rapidly, and all trading decisions should be based on current market information and individual risk tolerance.*

Australian CPI expected to jump, Aussie steadyThe Australian dollar is in negative territory on Wednesday. In the European session, AUD/IUSD is trading at 0.6468, down 0.40% on the day.
Australia's CPI for July surprised on the upside, jumping to 2.8% y/y. This followed a 1.9% gain in June and was above the market estimate of 2.3%. The spike in inflation, the highest level since July 2024, was driven by a sharp increase in electricity prices due to the end of government electricity rebates for many households. The trimmed mean, a key gauge of core CPI, rose to 2.7% in July from 2.1% in June.
The surprise jump in inflation has dampened expectations for a September rate cut. The money markets have reduced the probability of a rate cut to 22%, down from 30% before the inflation release.
Despite the hot inflation report, the Reserve Bank is expected to continue its easing cycle, with a 61% probability of a cut in November. The central bank remains very concerned about inflation but is also focused on employment, with the labor market showing signs of weakening.
The minutes of the RBA's August meeting said that upcoming rate decisions would depend on the data. The RBA meets next on September 19 and there are three key releases in September prior to the meeting - inflation, GDP and employment. The RBA has surprised the markets before and if these upcoming releases show a drop in economic activity or inflation, the RBA could respond with a rate cut next month.
The nasty feud between the Federal Reserve and Donald Trump has taken another twist, as the President said he had removed Fed Governor Lisa Cook due over charges that she made false statements on mortgage applications. The Fed says that Trump does not have authority to fire Cook. This latest spat further undermines the credibility of the US and could hurt the US dollar.
Australian CPI To Keep The RBA Cautious On RatesAustralia's monthly headline inflation metrics were all above expectations. While the basing effect and likely one-off electricity costs are a factor, it doesn't explain everything. I look at some of the CPI report's internals and outline what I think this means for AUD/USD.
Matt Simpson, Market Analyst at Forex.com and City Index

RBA lowers rates, Aussie dips lower, US CPI expected to riseThe Australian dollar is lower on Tuesday. In the European session, AUD/USD is trading at 0.6494, down 0.29% on the day.
The Reserve Bank of Australia lowered the cash rate by a quarter-point on Tuesday in a unanimous decision, bringing the cash rate to 3.60%. This is the lowest level since April 2023 and today's cut was the third this year.
This time around the RBA didn't shock the markets, unlike the July meeting when the RBA held rates and said it needed to see additional inflation data before lowering rates.
The rate statement began by noting that inflation has "fallen substantially" since 2022 and that inflation had fallen back within the target band of 2%-3% in the second quarter.
The Board noted that headline inflation was at 2.1% and trimmed mean (a key core CPI gauge) was at 2.7%. The Board said that underlying inflation is expected to continue to ease to the midpoint of the target band and the cash rate should continue to follow a "gradual easing path".
This dovish tune in the statement was balanced out by concerns that uncertainty remains in both the global economy and at home. The Board said it would remain cautious and would remain focused on price stabililty and employment.
At a post-meeting press conference, Governor Bullock said that the growth and inflation forecasts support further rate cuts but "there is still a lot of uncertainty" and future rate decisions would be data-dependent.
US inflation expected to rise to 2.8%
The US releases the July inflation report later today. Inflation is expected to nudge higher to 2.8% y/y, up from 2.7% y/y in June. This would mark a third straight acceleration and the highest inflation level since February. Core CPI is also expected to accelerate to 3.0%, up from 2.9%
Monthly, CPI is projected to ease to 0.2% from 0.3%. Core CPI is projected to rise to 0.3% from 0.2%.
Today's inflation data could shift market expectations for the September Fed meeting but the decision will very likely be rate cut, with a current likelihood of 84%, according to FedWatch's CME.

RBA Cut by 25bp: Where From Here?The Reserve Bank of Australia (RBA) finally delivered the 25bp cut I anticipated in July. I take a quick look at how they have updated the economic forecasts that matter, and how Aussie markets reacted.
Matt Simpson, Market Analyst at City Index and Forex.com

RBA poised to lower rates, Australian dollar in holding patternThe Australian dollar is coming off a strong week, gaining almost 1% against the US dollar. In Monday's European session, AUD/USD is almost unchanged at 0.6521.
The Reserve Bank of Australia is virtually certain to lower rates at Tuesday's meeting. This would be the third cut of 2025 and would lower the cash rate to 3.60%, its lowest level since April 2023. This indicates a gradual, cautious approach to lowering rates.
The RBA had a trick up its sleeve in July, when it opted to hold rates. The markets had widely expected a rate cut but the RBA said that it wanted to see additional inflation data before delivering a rate cut.
Inflation has been cooling, as CPI for the second quarter nudged down to 2.1% y/y, down from 2.4% in Q1. This strongly supports the case for a rate cut as CPI has fallen close to the lower band of the RBA's 2%-3% target. Core inflation has also been easing lower. As well, the labor market is showing signs of cooling and the central bank wants to avoid a sharp deterioration in employment data.
With today's move practically a given, investors will be looking for hints about further cuts. Governor Bullock has sounded cautious, noting that inflation remains sticky and there is continuing uncertainty over US tariffs.
Australian goods face a low 10% US tariff, which is not expected to have a significant impact on the economy. However, US tariffs on China, which is Australia's largest trading partner, could weigh on economic growth.
In the US, it's a very light calendar with no tier-1 events. On Tuesday, the US releases CPI for July, which is expected to tick up to 2.8% from 2.7% in June.
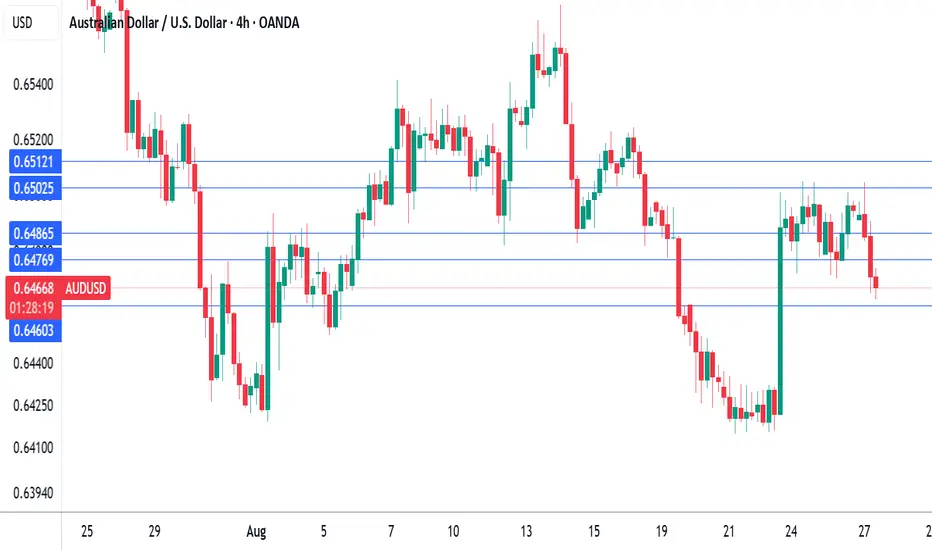
AUD/USD is testing support at 0.6414. Below, there is support at 0.6506
There is resistance at 0.6529 and 0.6536
AUDUSD: Rate Cut Tuesday + Price At A Daily -FVG! Time To Sell?Welcome back to the Weekly Forex Forecast for the week of Aug 11 - 15
In this video, we will analyze the following FX market: AUDUSD
AUDUSD has been difficult to trade, as it chops its slow grind upwards. Then last, although the week's trading range was small, the Weekly candle closed as a bearish Inside Bar. This, as price made contact with a -FVG! The scenario could be laying the ground work for a new bearish leg to form.
Couple the above with an interest rate cut coming Tuesday for the AUD, and August being a historically bad month for the aussie, things could get real interesting for sellers next week.
Enjoy!
May profits be upon you.
Leave any questions or comments in the comment section.
I appreciate any feedback from my viewers!
Like and/or subscribe if you want more accurate analysis.
Thank you so much!
Disclaimer:
I do not provide personal investment advice and I am not a qualified licensed investment advisor.
All information found here, including any ideas, opinions, views, predictions, forecasts, commentaries, suggestions, expressed or implied herein, are for informational, entertainment or educational purposes only and should not be construed as personal investment advice. While the information provided is believed to be accurate, it may include errors or inaccuracies.
I will not and cannot be held liable for any actions you take as a result of anything you read here.
Conduct your own due diligence, or consult a licensed financial advisor or broker before making any and all investment decisions. Any investments, trades, speculations, or decisions made on the basis of any information found on this channel, expressed or implied herein, are committed at your own risk, financial or otherwise.

Australia inflation gauge hits 20-month high, Aussie gains grounThe Australian dollar has extended its gains on Monday. In the North American session, AUD/USD is trading at 0.6483 up 0.22% on the day. The US dollar made inroads last week against all the major currencies except the yen and gained 1.5% against the Australian dollar.
Australia's Melbourne Institute inflation guage soared 0.9% m/m in July, up sharply from 0.1% in June and marking the highest rise since Dec. 2023. The MI gauge, which provides a monthly guide to consumer inflation (official CPI is published quarterly), will no doubt raise concerns at the Reserve Bank of Australia, which has been cautious about cutting rates due to inflation worries.
Last week, CPI for the second quarter eased to 1.9%, down from 2.2% in Q1 and just below the central bank's target of 2%-3%. This cements a rate cut at the Aug. 12 meeting, after the RBA shocked the markets last month when it held rates. The markets had widely priced in a rate cut but the RBA defended its non-move, saying it wanted to see additional inflation data.
The week ended with a softer-than-expected US employment report. Nonfarm payrolls for July rose by only 73 thousand, missing the market estimate of 110 thousand. Adding to the bad news, the June and May reports were both revised sharply lower, down by a combined 258 thousand. The unemployment rate ticked higher to 4.2%, up from 4.1%.
The weak July reading and the downward revisions indicate that the labor market may be cooling more quickly than initially anticipated. The weak numbers support the case for the Fed to lower interest rates at the next rate meeting in September. The likelihood of a cut has climbed to 75%, compared to 63% on Thursday.
The soft jobs report should serve as a wake-up call regarding the effect of US tariffs on the economy, as the employment picture is worse than previously thought.

Australian inflation lower than forecast, Fed up nextThe Australian dollar is showing limited movement. In the European session, AUD/USD is trading at 0.6500, down 0.15% on the day.
Australia's inflation rate for the second quarter came in lower than expected. Headline CPI dropped to 2.1% y/y, down from 2.4% in the prior two quarters and falling to its lowest level since Q1 2021. This was just below the market estimate of 2.2%. Quarterly, CPI rose 0.7% in Q2, down from 0.9% in Q1 and below the market estimate of 0.8%.
Services inflation continued to decline and fell to 3.3% from 3.7%. The drop in CPI was driven by a sharp drop in automotive fuel costs. The RBA's key gauge for core CPI, the trimmed mean, slowed to 2.7% from 2.9%, matching the market forecast. This was the lowest level since Q4 2021.
The positive inflation report is a reassuring sign that inflation is under control and should cement a rate cut at the Aug. 12 meeting. The Reserve Bank of Australia stunned the markets earlier this month when it held rates, as a quarter-point cut had been all but certain. Bank policymakers said at that meeting that they wanted to wait for more inflation data to make sure that inflation was contained and today's inflation report should reassure even the hawkish members that a rate cut is the right move at the August meeting.
The Federal Reserve meets today and is widely expected to maintain the benchmark rate for a fifth straight meeting. Investors will be looking for clues regarding the September meeting, as the markets have priced in a rate cut at 63%, according to CME's FedWatch.
Surely the RBA Must Cut Rates Now?The RBA defied expectations of a cut in July, despite soft trimmed mean inflation figures in the monthly CPI report. The quarterly figures have now dropped, which I suspect leaves little wriggle room to hold at 2.85% in August. I 6ake a look at the quarterly and monthly inflation prints that matter, then wrap up on AUD/USD.
Matt Simpson, Market Analyst at City Index and Forex.com

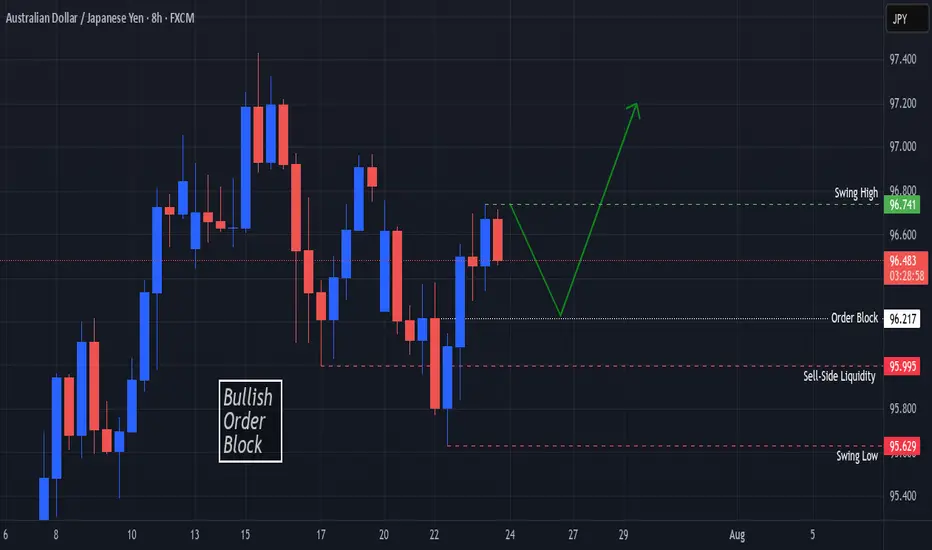
AUDJPY Bullish Order Block In SightOANDA:AUDJPY Price finds Support at the Swing Low @ 95.629 and creates a Swing High @ 96.741!
Based on the ICT Method, the Swing Low broke Sell-Side Liquidity @ 95.995 and opened up a Bullish Order Block Opportunity @ 96.217!
Price is currently working down from 96.49 at the time of publishing but once Price visits the Order Block, this could deliver Long Opportunities!!
AUD/JPY: Capitalizing on the RBA-BoJ Monetary Policy GapThis analysis outlines a compelling short opportunity in AUD/JPY, driven by a powerful confluence of fundamental and technical factors. The trade is strategically positioned ahead of a key catalyst that could unlock significant downside potential.
1️⃣ The Core Thesis: A Clear Policy Divergence
The primary driver behind this trade is the stark and widening gap in monetary policy between the Reserve Bank of Australia (RBA) and the Bank of Japan (BoJ). The RBA is signaling a clear dovish pivot amid a weakening labor market, making an interest rate cut imminent. Conversely, the BoJ is in a tightening phase, creating a fundamental headwind for the AUD relative to the JPY. This divergence underpins the strategic bearish bias.
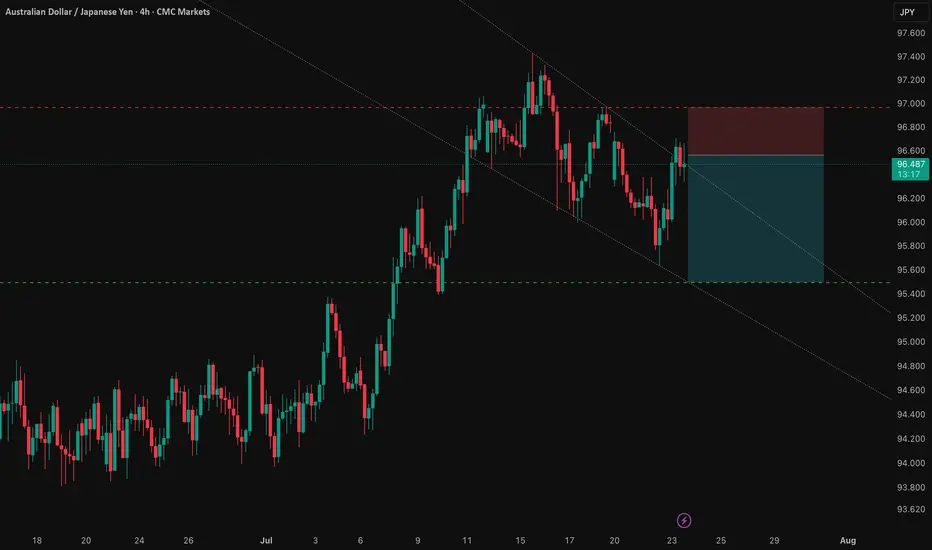
2️⃣ The Confirmation: Technical Alignment
This fundamental view is supported by a clear technical picture. The pair is in a well-defined downtrend and is currently testing a critical support level. This alignment of fundamental and technical factors presents a clear short opportunity, with the entry positioned for a breakdown below this key juncture.
3️⃣ The Catalyst: The RBA Bulletin
The immediate catalyst for this trade is the upcoming RBA Bulletin on July 24, 2025. Any dovish language from the RBA concerning Australia's economic outlook will likely reinforce expectations for a rate cut and accelerate the downward move in AUD/JPY.
The Trade Setup ✅
Here is the recommended trade setup:
📉 Trade: SHORT AUD/JPY
👉 Entry: 96.56200
⛔️ Stop Loss: 96.96386
🎯 Take Profit: 95.49900
🧠 Risk/Reward Ratio: 2.65
This setup offers a compelling risk-reward profile, capitalizing on a clear and powerful macroeconomic theme. The trade is designed to perform should the expected catalyst confirm the underlying bearish fundamentals.
Australia faces a dilemma between inflation and labor slowdown
The RBA, in its latest meeting minutes, emphasized that the recent rate hold reflects a cautious and gradual approach toward achieving its inflation target. While the central bank noted the need for further data to confirm a decline in inflation, some Board members flagged rising unemployment as a signal of potential labor market softening. Bloomberg added that Australia’s export-driven economy remains vulnerable to tariff-related uncertainties, while private demand growth remains sluggish.
AUDUSD extended its uptrend after testing the low at 0.6455, reaching as high as 0.6560. Both EMAs narrow the gap, indicating a potential shift toward bullish momentum. If AUDUSD holds above both EMAs, the price could gain upward momentum toward the high at 0.6595. Conversely, if AUDUSD breaks below the support at 0.6540, the price may retreat toward 0.6510.

Australian dollar eyes China GDPThe Australian dollar has edged lower on Monday. In the North American session, AUD/USD is trading at 0.6555, down 0.32% on the day. The Aussie took advantage of US dollar weakness last week as it touched a high of 0.6593, its highest level since November 2024.
China's economy is expected to have grown by 5.1% in the second quarter, after back-to-back quarters of gains of 5.4%. The government's annual growth target is around 5.0%, and policymakers won't complain if this target is exceeded for a third consecutive quarter.
China's exports were up 5.8% y/y in June, above the consensus of 5.0% and well above the May gain of 4.8%. The jump in exports was driven by a trade truce with the US that lowered tariffs on Chinese goods from 145% to 55%. Still, the economic picture is uncertain as the tariff truce ends in August.
China will also release industrial production and retail sales for June, with the markets forecasting weaker numbers. Industrial production, which has been decelerating in recent months, is expected to ease to 5.6% from 5.8%, while retail sales are expected to fall to 5.6%, down from 6 .4% in May, which was the strongest level since December 2023.
Australia releases Westpac Consumer Sentiment on Tuesday, with a forecast of a 0.4% gain for July . This follows a 0.4% gain in June. Consumers remain cautious, despite the Reserve Bank of Australia's rate cut in May and lower inflation.
The RBA shocked the markets last week when it maintained the cash rate at 3.85%, as all signs appeared to point to a quarter-point cut. The RBA meets next on August 12.
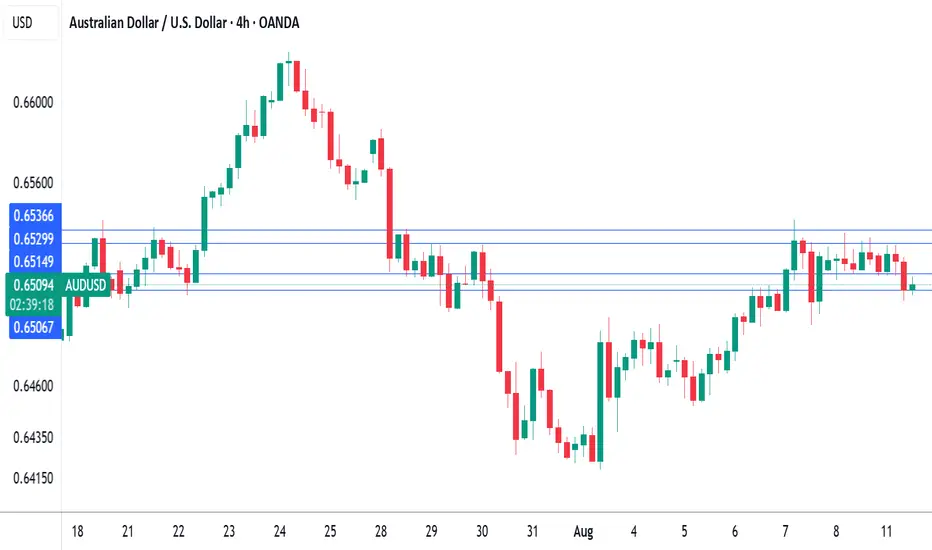
AUD/USD is testing support at 0.6562. Below, there is support at 0.6550
There is resistance at 0.6570 and 0.6582
