Elliott Wave Analysis: Crypto Market Nearing Strong ResistanceHello Crypto traders and investors!
We have seen a bigger recovery in the Crypto market, but mostly due to BTC and ETH, while other ALTcoins remain quite slow and weak. The main reason is BTC.dominance which is kicking back in.
Now that cryptocurrencies are in the mixed recovery, some stronger, some weaker, it's important to keep an eye on Crypto Total Market Cap chart. As you can see, Crypto market dropped with five waves from the all-time highs, which is first leg (A) of a three-wave correction. Currently it's approaching important June highs resistance within a three-wave A-B-C corrective recovery for wave (B) that can stop around 50%-61,8% Fibo. retracement, from where we should be aware of another decline for wave (C).
All that being said, as long as Crypto market cap is trading below or around 2.0T, watch out for another sell-off that can push the price back to June lows.
It's not about being right or wrong. This is normal. The point is not to lose the money, when you are wrong. That's why confirmation are very important.
In this case, if Crypto market cap starts dropping below channel support line and 1.5T, then we can easily confirm that bears are back in the game.
Be humble and trade smart!
If you like what we do, then please like and share our idea!
Disclosure: Please be informed that information we provide is NOT a trading recommendation or investment advice. All of our work is for educational purposes only.
Resistance_level

ULTA looking to make new all time highs!ULTA (Ulta Beauty, Inc) is testing resistance around the $355 area that dates back to mid 2019.
Fundamentally,
* It's undervalued with a PEG of 0.77
* Its earnings per share is expected to grow over the coming year.
Technically,
* General up trend
* Beta > 1 (following the general market trend)
* Broke above the resistance of $315 that dates back to 2017 and retested it as support
* It's approaching and testing resistance that dates back to 2019 and is looking to break through
Final thoughts:
* This is a good long term hold as the company is generally doing really well.
* It's currently undervalued, meaning it's actually worth more than the current price.
* Now would be a good time to get in if you're looking to hold this for the long term.
* If you're looking for a discount, look for buying opportunities around the $340 area
* If the price closes below $340 then look for buying opportunities around the $330 area.
Alternatively, if you like to buy high and sell higher, you can look for the price to make a weekly close above $355.36.

cad/jpy good short position CAD JPY is facing a bearish momentum on higher time frames
look for bearish confirmation on lower time frames and enter short with your own money management
always remember that patience is the key

BTCUSD finally is reaching main resistance zone and it can dumpOn daily time frame we can see every thing is clear and main resistance zone remains valid as we mentioned on previous analysis too:
Notice: if and only if price break this red zone we will look for targets like 50K.

GBPJPY ANALYSIS (sell)The price is failing to is finding resistance at the upper line of the ascending channel and is failing to create new highs.
In addition to that the price is also creating a head and shoulder top reversal pattern which when combined with the ascending channel setup
gives as a reason to consider for short trades. We set our pending orders below the current support line expecting the price to come there
and get us into the market. Our entry and exists are as indicated on the chart. We know what we are doing and we do what the market is doing. This is more than an institutional analysis.Invest wisely. Thank you for following NewJerusalemForex on Tradingview.


LTC/USD resistence zoneNow we are in resistence zone. Its probably go down at least around point of control by volume profile. ( 143$ +-)
Then we can go back to resistance zone.

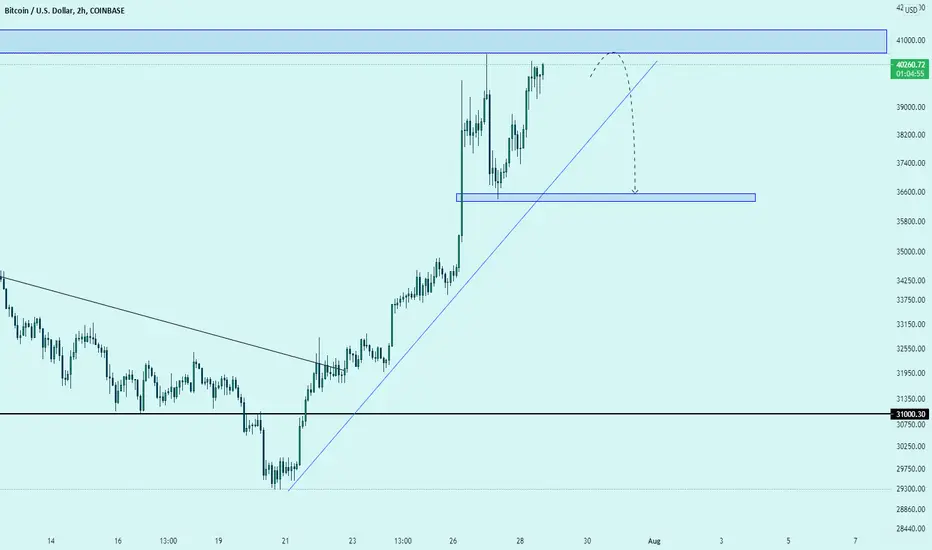
Wait for sell signal short-term with BTC at 41000Structure: Downtrend.
Strong Resistance at 41000 and appear small down move to 36600.
Wait for second chance to sell at 41000.
-------------------------------------------------------------------------
Wish you all have a good trading day!
DXCM is testing all time highs!I last spoke about DXCM when it just broke the $423.40 range and said it would take weeks to reach and challenge the all time highs.
Fast forward 3 weeks and here we are.
Trade idea:
* Look for buying opportunities in the $423.40 to $430 area
OR
* Wait for another weekly close above $456.23

Is LKQ ready to break the Inverse Head and Shoulders pattern?With earnings coming up later this week, July 29th 2021, it's likely that LKQ may break and confirm the inverse head and shoulders pattern it has been forming since May of this year.
A daily break and close above $51.52 would confirm that the price wants to go higher and the target for this pattern would be around the $56.92 area.
Trade idea:
* Wait for a daily break and close above $51.52 before entering

CHRUSDT is testing Daily resistance 🦐CHRUSDT is testing Daily resistance after the price bounced on the weekly support. IF the price will have a breakout, According to Plancton's strategy (check our Academy ), we can set a nice order
–––––
Follow the Shrimp 🦐
Keep in mind.
🟣 Purple structure -> Monthly structure.
🔴 Red structure -> Weekly structure.
🔵 Blue structure -> Daily structure.
🟡 Yellow structure -> 4h structure.
⚫️ Black structure -> <4h structure.

Sell NZDUSD FOR 90 pips?We are seeing this pair follow the trend like clock work. We are either looking for a touch of the white trend line to enter another trade or a break of the maroon trendline. This Is a pair I’m already in. It was overbought and it failed to break resistance. This also perfectly touched the trend line and had a lot of bearish momentum. This will be a 90 pip win if this goes down in our favor.
Use proper risk management and do your own due diligence.

Zenser Tech.Cup and handle breakout
Looks attractive.
Only for educational purposes.
Trade at your own risk.

AMD looking to end year long consolidationAMD is looking to end its year long consolidation and look to new horizons.
Thoughts:
* Looking at the weekly or even monthly time frames you can see it's in a clear up trend
* It'll have to brake and close above $94.28 before it can attempt to break through its all-time-highs.
* Very high trading volume likely to push the price higher from here.
Trade idea:
* Judging by the price-action it seems like this may come back to retest the $87.40 area.
* Look for buying opportunities around the $87.40 area.
OR
* Wait for a weekly confirmation (break and close) above $94.28

BNB/USDTBINANCE:BNBUSDT
BNB has broken its price channel and is falling
It is done with a high slope and height, which shows
The power of sellers in the market is relatively greater than that of buyers
And you see the price on the Fibonacci level of 1.414 once supported
It has become small and that is one of the important levels for support
But if it breaks, we will see a heavy fall again and for
In order for the price to be able to enter the uptrend, we must first draw the resistance
Break and stabilize above the 304 price line

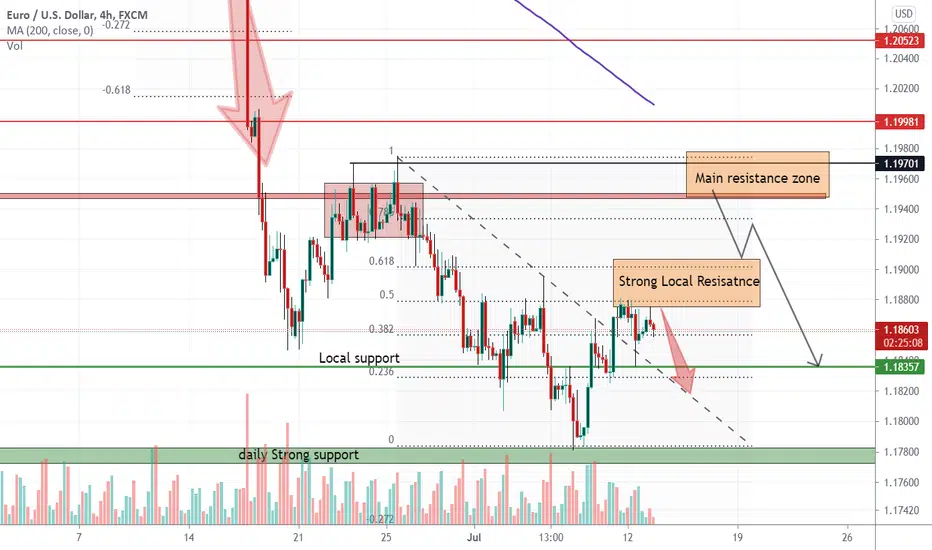
EURUSD Strong Resistance zones are ahead once again After previous successful long that we had, now price is hitting our resistance zones and targets on the previous chart :
so we are looking for opening some short positions in best place available now :
The first resistance zone that is strong once too is now 0.5% and 0.61% of the Fibonacci and the second one is the daily local resistance zone
that both marked on the chart with orange zones.
Targets and supports ahead :
A. 1.1820
B. 1.1780
DISCLAIMER: ((trade based on your own decision ))
<>
FAST trying to make new all-time-highsFAST is trying to break through and close above its recent all-time-high of $54.31.
Good news is that it's holding its previous all-time-high of $51.89 as support.
With buying pressure slowing down it may come back down to retest the $52.50 to $53.10 area as support before making another attempt at breaking and closing above $54.31
Final thoughts
* Strong up trending stock
* Expected to have earnings-per-share growth over the coming year
* Great long term hold as it pays dividends
Trade Idea
* Look for buying opportunities around the $52.50 to $53.10 area
OR
* Wait for a confirm break and close above $54.30

XMRUSDT Might Be at the beginning of an Uptrend @monero
Welcome back Traders, Investors, and Community!
Hi Traders, XMRUSDT has broken above the major Resistance, however the market is ranging now and I guess we would have a retracement at around 199.27 before we start a new uptrend. The price also may go back all the way down to retest the Resistance before it goes up.
⬆️Buy now or Buy at 199.27
⭕️SL @ 182.99
✅TP1 @ 222.66
✅TP2 @ 244.05
✅TP3 @ 274.92
We will have more FREE forecasts in TradingView soon
❤️ Your Support is really appreciated!❤️
Have a Profitable Day

ETHEREUM/USDT AT RESISTANCE AREA CURRENTLY ETHEREUM IS AT RESISTANCE AREA IF IT WILL BREAK HER RESISTANCE SO IT WLL GO UPWARD AND IF CANT SO DOWN.
HOPE YOU ALL ARE FINE.

25.06.2021 - Is Oil gonna break?Crude Oil has been testing the 73.40 resistance level since yesterday. Since the inventory numbers are showing demand beating supply, we still expect the price to rise, unless OPEC decides to intervene with announcements of the type "supply increase". Breaking the resistance level should push the price back to 74 USD per barrel.

BTCUSD, double ema on volume. Bullish rally started at the price of 33220, heavy volume came at that point, and
it could be strong support, now price is near Resistance 34830, which served as
a strong resistance historically, so sort setup could possibility at this point.
Here using double EMA indicator on volume, could provide indication to end of
trend,where 14 period EMA on 5 min time frame chart crossed 200 EMA same period.
Sort setup possible at Resistance level.
!Strong close above 34830 should be bullish move.
Technical- Based on Support/Resistance:
- Strong Suport: 33220
- Strong Resistance: 34830
! Here I'm trying to understand double EMA indicator on volume chart, looking for more content.
Image-

SHORT BITCOINYou can open a short position on bitcoin now,
Targets will be : 33500 - 33300- 32700 -32000 31800.
Stoploss will be : 34900 or 35200 depends on your risk management.
NOTE - THIS IS NOT AN FINANCIAL ADVICE, ALWAYS TRADE AT YOUR OWN RISK.

EURJPY - Structure Trade(20Jun2021)Do you remember that last week I've mentioned in my previous post titled, "EURJPY - Trendline" that the Bearish Shark won't form up and you can look for a shorting opportunity on the Trendline for a shorting opportunity, that opportunity alone brings you a 285pips(more than 2,850USD/lot) of net profit, and this is a spin-out trading idea from the Weekly Chart's Bearish Shark Pattern. Imagine how much you would earn if you have engaged in the trade base on the Weekly Chart?
I'm not all keen on a counter-trend trade on this trading setup but if you must, a break and close above the trendline is needed before considering a buying opportunity.
I will wait to short this trade at 132.67-132.88(red box) for a trend trading opportunity.
