How to Trade Bullish DivergenceAt some point in your trading career, you will hear the term "Divergence Trading". Divergence simply means when the price and indicator are telling the trader two different things. It can be an effective addition to your trading strategy, especially if already using indicators like RSI or MACD to find overbought and oversold levels but should not be replied on by itself and requires practice to get it right.
There are two types of Divergence you want to be familiar with: Regular bullish and bearish divergence and Hidden bullish and bearish divergence. In this educational tutorial, I will cover Bullish Divergence. You should note that the appearance of divergence doesn't happen 100% of the time, but when it does, you can use it for additional confluence (extra confirmation) for entering trades.
Bullish Divergence Overview:
A bullish divergence occurs when prices fall to a new low while an oscillator fails to reach a new low. This situation demonstrates that bears are losing power, and that bulls are ready to control the market again—often a bullish divergence marks the end of a downtrend. Notice in this example of GBPCAD, the price was in a downtrend and eventually came to a low at 5494 and rejected the area. The price shows a decline, while the RSI shows the oscillator moving higher. This is an example of regular bullish divergence, as it signaled a potential trend reversal.
How to Draw Bullish Divergence
You want to draw lines on successive tops and bottoms. Connect the tops and bottoms only, and keep your eyes on the price. If you draw a line connecting two lows on price, you MUST draw a line connecting two lows on the indicator. They have to match! Divergence only exists if the SLOPE of the line connecting the indicator tops/bottoms DIFFERS from the SLOPE of the line connecting the price tops/bottoms.
Popular Indicators to Use When Identifying Divergence
You can use indicators such as RSI, MACD, CCI, or Stochastic to trade divergence. Your selection in one of these indicators will depend on personal preference. I personally prefer the RSI at a 7 period.
If you spot divergence but the price has already reversed and moved in one direction for some time, the divergence should be considered played out.
You missed the boat this time. All you can do now is wait for another swing high/low to form and start your divergence search over.
What is your favorite way to trade Divergence? Let me know in the comments!
Happy Trading! :) - Brian & Kenya, BK FOREX ACADEMY
Reversalpattern

Reversal VS retracement *BACKTEST*Simply * Back Testing *
in the image I tried to put into simplest terms how to differentiate a Reversal Patter vs retracement patterns and Tried to add some context to the topic. This is not financial advise.
Another EX:

How To : Momentum Shifts ( Key Set Ups)
Hi Traders! Lets review 3 Trade SetUp For Key Momentum Shifts:
For the past 28 years, I have been using three simple trades setups, that I'll explain in the video, to be selective in my trades and to identify key momentum shifts in the market. I hope these setups will be useful to you as well.
High Frequency Traders and Professional Traders will often run retail trader stops by blowing through key support and resistance levels like round numbers only to reverse shortly afterwards. We must protect ourselves from these tactics and be careful not to chase a move or get stopped out.
Recognizing and patiently waiting for one of these trade set up will help especially if you combined or recognize them with a chart formations like a double tops or head and shoulder pattern.
Trade Setup 1: Cross above a key resistance, recross below = shift of momentum. The same setup can be used with a cross below a key support level.
Trade Setup 2: Cross above a key resistance, recross below and a retest of the resistance with a Lower Higher = shift of momentum. This is my preferred setup.
Trade Setup 3: 2 touches to a key resistance or 2 touches to a key support and entering on the 3rd touch for a 66% probability of successful trade.
I hope these setup are helpful, whether you trade or invest, using key momentum shifts with support and resistance lines.
Hope it helps
Take care
Marc

Beware False Breakouts! How To Spot Them...Investors should use basic Technical Analysis for powerful decision making. I see it as a challenge to demonstrate how useful knowledge of one simple pattern can be to identify price reversals. Recognizing this pattern and acting on it will save much money and headache!
Both traders and investors need to be on guard for false breakout reversals. Seeing this pattern in action can provide an excellent profit target, entry point, or prevent major drawdown!
In this video I look at examples in the Silver ETF AMEX:SLV , Spotify stock NYSE:SPOT , and Forex Euro/Dollar pair FX:EURUSD for false breakouts and what follows.
I am excited to make this video for my viewers and for Best of Us Investing!

Wanna identify reversals? This video shows how I do it :)The time is going to be coming soon when the market is going to go back to a bull market. But what if you could identify how to find those reversals yourself? In this video I go over how I use TA to find VERY important reversal and breakout zones. Enjoy

The Power of DojiA Doji is created when the open and close for a price are virtually the same. Doji tend to look like a cross or plus sign and have small or nonexistent bodies. From an auction theory perspective, Doji represent indecision on the side of both buyers and sellers. Everyone is equally matched, so the price goes nowhere; buyers and sellers are in a standoff.
When it comes in a downtrend it act as a reversal pattern so we know that the bears power is weak, and bulls start to take control thus the price will go up and the trend will be up , when it comes in an uptrend the bull power is weak , bears starts to take control and price will eventually go down . But in technical analysis you cant enter a trade only from one sign so you should know you Support and Resistance area, draw your trend lines, use some indicators, and when you see the Doji know you know its the perfect time to execute the trade.

Reversal Patterns I put in your hands now the most important patterns that occur on the chart,, save the image with you and search for previous patterns and learn how to extract them from the chart

How to Use A perfect Reversal Chart pattern ?We have a perfect Head And shoulders as a Strong Reversal Chart pattern
To find a best Entry pont we need to wait after Re Test Neckline of H&S
TP = Distance (between Point A and Point B ) = Distance Between Point C ans Point D)

Market Structure Simplified It is easy to get confused with overflowing information about market structure in the trading world.
To simplify things we have come up with a way of analysing market structure simply by marking each high or low.
In this particular example, you can see that higher lows were being created all the way down the bearish trend, so we knew that it was a seller's market UNTIL we got our break of structure .
When the BOS became apparent, we began to shift our attention to the possibility of reversals and used our magic tool, the Fibonacci.
This technique can be used in any trend, try it for yourselves!
Please, support this post with a like and comment!

What Does the Inverted Hammer Candlestick Pattern Mean? Hello Traders!
Have you ever wondered when will a strong trend end? Do you struggle to spot candlestick patterns that potentially signal when the bulls or bears might take over?
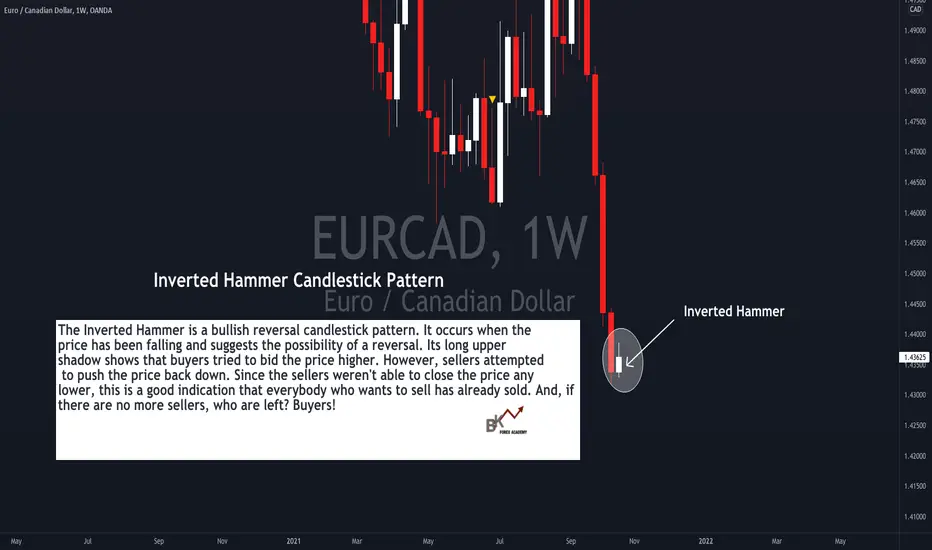
Take a look at this example of EUR/CAD and let's see how the trade plays out! :)
About the Inverted Hammer Candlestick Pattern and Why It Forms:
The Inverted Hammer is a bullish reversal candlestick pattern. It occurs when the price has been falling and suggests the possibility of a reversal. Its long upper
shadow shows that buyers tried to bid the price higher. However, sellers attempted to push the price back down. Since the sellers weren't able to close the price any
lower, this is a good indication that everybody who wants to sell has already sold. And, if there are no more sellers, who are left? Buyers!
And just an important observation, the Inverted Hammer has a small real body, and has a large upper shadow with a small or no lower shadow (also known as "wick").
Would you like to receive more "live charting" tutorials like this?? Comment below and let us know! :)
Happy Trading!
Patterns of possible market correction or reversal 😎Trend reversal or correction chart patterns announce a reversal of the current trend on the observed chart. The output of the figure is made, theoretically, in the opposite direction to the movement that precedes the formation of the pattern. In an uptrend, a reversal pattern indicates a bearish move. On the contrary, in a downtrend, it announces an upward movement.
It works in all temporalities but, the longer the temporality of the candles, the better the pattern will do and the more effective

Candlestick Chart Part 2 : ReversalsHello everyone, as we all know the market action discounts everything :)
_________________________________Make sure to Like and Follow if you like the idea_________________________________
Today's video will be about the Candlestick Chart : Reversal Patterns.
So lets start by talking about the different types of Patterns :
Bullish Reversal Patterns
Bearish Reversal Patterns
And they are divided into 3 groups :
Weak Patterns
Reliable Patterns
Strong Patterns
We Start with the Weak Reversals :
1) Dragonfly Pattern :
A dragonfly doji candlestick is a candlestick pattern with the open, close, and high prices of an asset at the same level. A dragonfly doji pattern does not appear constantly. It is used as a technical indicator that signals a potential reversal of the asset’s price.
2) Hammer & Hanging Man Patterns :
The Hammer is a bullish reversal pattern that forms during a downtrend. It is named because the market is hammering out a bottom.
When the price is falling, hammers signal that the bottom is near and the price will start rising again.
The long lower shadow indicates that sellers pushed prices lower, but buyers were able to overcome this selling pressure and closed near the open.
The Hanging Man is a bearish reversal pattern that can also mark a top or strong resistance level.
When the price is rising, the formation of a Hanging Man indicates that sellers are beginning to outnumber buyers.
The long lower shadow shows that sellers pushed prices lower during the session.
Buyers were able to push the price back up some but only near the open.
3) Inverted Hammer & Shooting Star Patterns :
The Inverted Hammer occurs when the price has been falling suggests the possibility of a reversal. Its long upper shadow shows that buyers tried to bid the price higher.
However, sellers saw what the buyers were doing, said "No!" and attempted to push the price back down.
The Shooting Star is a bearish reversal pattern that looks identical to the inverted hammer but occurs when the price has been rising.
Its shape indicates that the price opened at its low, rallied, but pulled back to the bottom.
4) Dark Cloud Pattern :
A 2-candle pattern. The first candle is bullish and has a long body. The second candlestick should open significantly above the first one’s closing level and close below 50% of the first candlestick’s body. The sell signal is moderately strong.
5) Piercing Pattern :
A 2-candle pattern. The first candlestick is long and bearish. The second candlestick opens with a gap down, below the closing level of the first one. It’s a big bullish candlestick, which closes above the 50% of the first candle’s body. Both bodies should be long enough.
6) Upside Gap Three Method :
The upside gap three methods candlestick pattern is a bearish continuation pattern that only occurs during an uptrend. It consists of three candles. The first two candles are long and white in the direction of the prevailing trend. The second black candle creates an upside gap. The third candle fills the gap between the first and the second candle.
7) Downside Gap Three Method :
The downside gap three methods candlestick pattern appears during a downtrend and consists of three candles. The first two candles have a gap down between them while the third candle covers the gap between the first two. The gap between the first two candles simply gets filled.
8) Bearish Harami Pattern :
A 2-candle pattern. The body of the second candle is completely contained within the body of the first one and has the opposite color.
9) Bullish Herami Pattern :
A 2-candle pattern. The body of the second candle is completely contained within the body of the first one and has the opposite color.
Now Lets Talk about the Reliable Reversals :
1) Bullish Engulfing Pattern :
A 2-candle pattern appears at the end of the downtrend. The first candlestick is bearish. The second candle should open below the low of the first candlestick low and close above its high.
2) Bearish Engulfing Pattern :
A 2-candle pattern. The first candlestick is bullish. The second candlestick is bearish and should open above the first candlestick’s high and close below its low.
3) Tower Top Pattern :
The tower top is a reversal pattern that occurs at high price levels. Typically one or more long bullish candlesticks are followed by a few smaller real body candlesticks and then the pattern is completed with one or more large bearish candlesticks.
4) Tower Bottom Pattern :
The tower bottom is a reversal pattern that occurs at low price levels. There is one or more long bearish candlesticks followed by a few smaller body candlesticks and then concluded with one or more large bullish candlesticks.
5) Bullish Abandoned Baby Pattern :
The bullish abandoned baby is a pattern that appears at the end of a downtrend and signals reversal to an uptrend. Simply put, it signals an end of the selling pressure of the bears and return of the bulls in the market.
This pattern consists of three candlesticks: the first candle has a black (or red) big body, the second is a small and bearish candle – or a Doji, and the third is white (or green) candle.
6) Bearish Abandoned Baby Pattern :
The bearish abandoned baby is a reversal pattern that forms during an uptrend. It is characterized by three candles, where the first candle is long bodied and white/green.
The second candle is a Doji that gaps above the close of the first bar in the series. The third candle opens below the close of the second bar and is long bodied and black/red.
7) Dumpling Top Pattern :
A dumpling top occurs when small real body candlesticks slowly rise and then move in a neutral to downward direction. The dumpling top pattern is complete when there is a bearish candlestick that gaps down from the other candlesticks.
8) Fry Pan Bottom Pattern :
The opposite of the dumpling top is the fry pan bottom pattern. The fry pan bottom occurs when small real body candlesticks slowly move downward and then move in a neutral to upward direction. The fry pan bottom pattern is complete when a bullish candlestick gaps up from the rest of the candlesticks.
9) Bullish Belt Hold Pattern :
A bullish belt hold shows up in downtrends. The pattern can be recognized by one long, full-bodied candlestick that is bullish and opens at a new recent low. The bullish belt hold candle is expected to have a flat or nearly flat bottom. The top has a small shadow, relative to the length of the body.
10) Bearish Belt Hold Pattern :
The bearish belt hold is the complete opposite and it comes up in uptrends. To detect it, look for a long full-bodied, bearish candlestick that stands out at the top of an uptrend because it will get to a new recent high and it should be noticeably longer than the other candles.
11) Tweezer Top Pattern :
The Tweezer Top pattern is a bearish reversal candlestick pattern that is formed at the end of an uptrend.
It consists of two candlesticks, the first one being bullish and the second one being bearish candlestick.
Both the tweezer candlestick make almost or the same high.
12) Tweezers Bottom Pattern :
The Tweezer Bottom candlestick pattern is a bullish reversal candlestick pattern that is formed at the end of the downtrend.
It consists of two candlesticks, the first one being bearish and the second one being bullish candlestick.
Both the candlesticks make almost or the same low.
And Last but not least The Strong Reversal Patterns :
1) Three White Soldiers Pattern :
A 3-candle pattern. There’s a series of 3 bullish candles with long bodies. Each candle should open within the previous body, better above its middle. Each candle closes at a new high, near its maximum. The reliability of this pattern is very high, but still, a confirmation in the form of a white candlestick with a higher close or a gap-up is suggested.
2) Three Black Crows Pattern :
A 3-candlestick pattern. There’s a series of 3 bearish candles with long bodies. Each candle opens within the body of the previous one, better below its middle. Each candle closes at a new low, near its minimum. The reliability of this pattern is very high, but still, a confirmation in the form of a bearish candlestick with a lower close or a gap-down is suggested.
3) Morning Star Pattern :
A 3-candle pattern. After a long bearish candle, there’s a bearish gap down. The bears are in control, but they don’t achieve much. The second candle is quite small and its color is not important, although it’s better if it’s bullish. The third bullish candle opens with a gap up and fills the previous bearish gap. This candle is often longer than the first one.
4) Evening Star Pattern :
A 3-candle pattern. After a long bullish candlestick, there’s a bullish gap up. The bulls are in control, but they don’t achieve much. The second candlestick is quite small and its color is not important. The third bearish candle opens with a gap down and fills the previous bullish gap. This candle is often longer than the first one.
5) Bullish Three Line Strike Pattern :
A bullish three-line strike is made up of four candles. Of these, the first three are bullish, while the last is bearish. It is made up of three strong bullish candles that progressively end higher followed by a final strike candle. The strike candlestick is bearish and begins at or higher than the third candle but closes at least lower than the open of the first candle.
6) Bearish Three Line Strike Pattern :
A bearish three-line strike is a four candle continuation pattern that comes up in a bearish trend. The first three candles are bearish, while the last candle is positive and ends above the highest close of the previous three candles.
I Do wanna mention General Reversal Patterns :
Three Mountains is the same as Triple Top Pattern
Three Rivers is the same as Inverted Triple Top Pattern
Buddha Top is the same as Head and Shoulders Pattern
Inverted Buddha is the Same as Inverted Head and Shoulders Pattern
I hope that I was able to help you understand Reversal Patterns in Candlestick Charts better and if you have any more questions don't hesitate to ask.
Hit that like if you found this helpful and check out my other video about the Moving Average, Stochastic oscillator, The Dow Jones Theory, How To Trade Breakouts, The RSI , The MACD , The Bollinger Bands , The Different Types Of Trading Strategies, Candlestick Charts Part 1 links will be bellow

RANGING MARKET STRUCTUREFX:EURAUD
This is the Old Chart of EurAud, this the example of ranging market, it happened from june to october 2020
ranging market usually find on transition between different trend structure. There are 3 reversal pattern failed before the market change the trend.
you must be extra careful in this type of market structure. and this structure can be last for months

Learning Reversal Timing'sThe Importance of Timing
8AM - London Open
This is where impulsive traders get caught in lures.
Traders tend to get pulled in a direction.
9AM-11AM - Reversal Timing
This is the only time of the day we are usually interested in.
Once the initial lures of the London session are out of the way we begin to see reversals for the rest of the day.

2 Types of Chart Pattern2 Types of Chart Pattern are Continuation Pattern and Reversal Pattern as show in the chart.
Continuation Pattern
1. Symmetrical Triangle
2. Triangle
Reversal Pattern
1. Ending Diagonal
2. Expanding Diagonal (Broadening)
3. Channel
For best practices, draw channel and then adjust the 2nd line to confirm either triangle or diagonal.
Example Up trend :
Market Up Trend, draw channel (Bullish / Up trend) by starting draw support trendline as 1st line.
For 2nd line, draw resistance trendline as channel.
Adjust 2nd line to become triangle or diagonal if applicable.
Example Down trend :
Market Down Trend, draw channel (Bearish / Down trend) by starting draw support trendline as 1st line.
For 2nd line, draw resistance trendline as channel.
Adjust 2nd line to become triangle or diagonal if applicable.
Sebagai latihan yang baik, lukis Channel terlebih dahulu kemudian ubah garis kedua untuk dapatkan garis sama ada triangle atau diagonal.
Contoh Up Trend :
Market Up Trend, lukis channel (Bullish / Up trend) dengan melukis support trendline as garis nombor 1.
Untuk garis nombor 2, lukis resistance trendline sebagai channel.
Ubah garis nombor 2 untuk jadi triangle atau diagonal jika sesuai.
Contoh Down Trend :
Market Down Trend, lukis channel (Bearish / Down trend) dengan melukis resistance trendline as garis nombor 1.
Untuk garis nombor 2, lukis support trendline sebagai channel.
Ubah garis nombor 2 untuk jadi triangle atau diagonal jika sesuai.

EDUCATION - Rising & Falling Wedges - Reversal PatternsWhat is an ascending/descending correction?
The most common reversal pattern is the rising and falling wedge, which typically occurs at the end of a trend. The pattern consists of two trendiness which contract price leading to an apex and then a breakout appears.
Rising Wedge – Bearish Reversal
The ascending reversal pattern is the rising wedge which consists of higher highs and higher lows whilst losing momentum to the upside. Price contracts and eventually has a bearish break.
Falling Wedge – Bullish Reversal
The falling wedge reversal pattern occurs at the end bear run and indicates that price is ready to reverse. Again, price contracts and then eventually breaks out upwards.
There are 2 types of ways we can trade wedge patterns; Risky Entry & Safe Entry. See below for the pros and cons for both and how to enter them
__________________________________________________________________
Risk Entry:
The reason why it is called a risk entry is because we haven't got many confirmations apart from the third touch of the trendline (as indicated in the chart above). Price may have the potential to go past the trendline for a deeper correction before moving up hence why this is called a risk entry. Whereas for the safe entry, the confirmation would be the break of the wedge.
How to trade using Risk Entry:
Wait for price to bounce off the trendline and then enter with stops below/above the correction depending on whether it’s a rising wedge or falling wedge.
One of the advantages of doing a risk entry is that we can have small stop loss and have a great risk:reward ratio. Also, we can gain an entry at the start of the move and have massive gains!
Safe Entry:
Safe entry requires more than one confluence and requires confirmation. One of the confirmations of the safe entry is the third touch bounce and then another confirmation is when price breaks the correction which confirms that the structure has changed and that we are in a reversal.
How to trade using Safe Entry:
For a safe entry, enter when price has broken the correction with stops above/below the correction. Please note that with this entry method, the stoploss will be greater.
The disadvantage to using a safe entry is that we require a bigger stop loss which makes the risk:reward ratio not as great as the risk entry. However, the probability of the trade succeeding is higher.
RISING WEDGE EXAMPLES
RISK ENTRY
SAFE ENTRY
FALLING WEDGE EXAMPLES
RISK ENTRY
SAFE ENTRY

SPOTTING EARLY TREND REVERSAL | EURUSD
Hey traders,
As you know, I am very bearish biased on EURUSD.
On a daily, the price respected a major key level and also broke a rising wedge pattern to the downside.
On intraday time frames, with classic price action rules, we can easily spot a trend reversal :
The price was trading in a bullish trend .
The uptrend was confirmed by a sequence of higher highs and higher lows .
1.2267 is a local structure high .
After a retracement to a new higher low the price set a lower high (a very important bearish clue).
Then the price violates a previous higher low level to the downside setting a new lower low .
With a sequence of two lower lows and lower high, we can confirm a bullish trend violation and initiation of a new bearish trend on 8H chart.
Now we are waiting for the completion of a retracement leg in a zone between current spot prices and the level of a previous lower high
and a consequent bearish continuation.
❤️ Please, support this idea with a like and comment! ❤️
⬇️ Subscribe to my social networks! ⬇️

Engage- Reversal Pattern -2 Extreme Reversal setupThe first Video on Education series - Engage - The Trade Setup
The first candlestick pattern that I will discuss is the wick reversal setup, which is a pattern that can spotlight some of the best reversal opportunities in the market.
studied from Book Secrets of a Pivot Boss: Revealing Proven Methods for Profiting in the Market
www.amazon.in
Happy learning.
( Education purpose for all )

Engage- Reversal Pattern -1 Wick ReversalThe first Video on Education series - Engage - The Trade Setup
The first candlestick pattern that I will discuss is the wick reversal setup, which is a pattern that can spotlight some of the best reversal opportunities in the market.
studied from Book Secrets of a Pivot Boss: Revealing Proven Methods for Profiting in the Market
www.amazon.in
Happy learning.
( Education purpose for all )

Educational: AB=CD pattern w/ BTC exampleOne fairly easy and useful pattern for determining reversals is the AB=CD pattern.
The pattern simply looks for two rising or falling legs up or down respectively. Then one simply measures the retracement level from point B followed by the projection from C (luckily tradingview has a tool to assist with this). If these values equal a 0.618 or 0.786 retracement followed by a 1.272 or 1.618 projection respectively, the pattern is likely to indicate a reversal of the current trend. For example, above we can clearly see the pattern almost perfectly matched the required levels of 0.618 and 1.272.
However, no pattern is guaranteed, so it is always recommended to seek out confirmation. As we can see in the above example, there is bearish reversal divergence that can be seen on both RSI and MACD (dotted green lines), whereby price is rising while oscillators are falling, indicating an even greater likelihood for a reversal.
Upon confirmation of a reversal, one can then target Fibonacci retracement levels as key points of interest as can be seen above.
A nice part about this pattern is how simple it is to spot and draw out particularly with tools available on tradingview.
Hopefully you are able to use this pattern as another useful tool in your arsenal!

All candlestick patterns for Trading : Bearish reversal patternsHello everyone 😃
In this article we present Most useful bearish reversal patterns of candlesticks and How to trade with them. ( Sorry for my irregular chart 🤦♂️ I'm not good in drawing 😁 )
📊 What is Candlestick charts ?
Candlestick charts are a type of financial chart for tracking the movement of securities. They have their origins in the centuries-old Japanese rice trade and have made their way into modern day price charting. Some investors find them more visually appealing than the standard bar charts and the price actions easier to interpret.
Candlesticks are so named because the rectangular shape and lines on either end resemble a candle with wicks. Each candlestick usually represents one day’s worth of price data about a stock. Over time, the candlesticks group into recognizable patterns that investors can use to make buying and selling decisions.
📍 Bearish reversal candlestick patterns : Bearish reversal candlestick patterns can form with one or more candlesticks; most require bearish confirmation. The actual reversal indicates that selling pressure overwhelmed buying pressure for one or more days, but it remains unclear whether or not sustained selling or lack of buyers will continue to push prices lower. Without confirmation, many of these patterns would be considered neutral and merely indicate a potential resistance level at best. Bearish confirmation means further downside follow through, such as a gap down, long black candlestick or high volume decline. Because candlestick patterns are short-term and usually effective for 1-2 weeks, bearish confirmation should come within 1-3 days.
To be considered a bearish reversal , there should be an existing uptrend to reverse. It does not have to be a major uptrend, but should be up for the short term or at least over the last few days. A dark cloud cover after a sharp decline or near new lows is unlikely to be a valid bearish reversal pattern. Bearish reversal patterns within a downtrend would simply confirm existing selling pressure and could be considered continuation patterns.
There are many methods available to determine the trend. An uptrend can be established using moving averages, peak/trough analysis or trend lines. A security could be deemed in an uptrend based on one or more of the following :
- The security is trading above its 20-day exponential moving average (EMA).
- Each reaction peak and trough is higher than the previous.
- The security is trading above a trend line.
🈺 Now let's talk about patterns that we provided on chart.. !
- Hanging man : The hanging man is characterized by a small "body" on top of a long lower shadow. The shadow underneath should be at least twice the length of the body.
📚 The hanging man represents a potential reversal in an uptrend. While selling an asset solely based on a hanging man pattern is a risky proposition, many believe it's a key piece of evidence that market sentiment is beginning to turn. The strength in the uptrend is no longer there.
- Gravestone DOJI : A gravestone DOJI is a bearish reversal candlestick pattern that is formed when the open, low, and closing prices are all near each other with a long upper shadow.
📚 A gravestone DOJI is a bearish pattern that suggests a reversal followed by a downtrend in the price action.
📌 A gravestone pattern can be used as a sign to take profits on a bullish position or enter a bearish trade.
- Bearish kicker : This pattern is characterized by a sharp reversal in price over the span of two candlesticks.
📚 Traders use kicker patterns to determine which group of market participants is in control of the direction.
📌 The pattern points to a strong change in investors' attitudes towards a security that typically follows the release of valuable information about a company, industry, or economy.
- Shooting stars : A shooting star is a bearish candlestick with a long upper shadow, little or no lower shadow, and a small real body near the low of the day.
📚 A shooting star occurs after an advance and indicates the price could start falling.
The formation is bearish because the price tried to rise significantly during the day, but then the sellers took over and pushed the price back down toward the open.
- Bearish spinning top : A spinning top is a candlestick pattern that has a short real body that's vertically centered between long upper and lower shadows.
📚 The real body should be small, showing little difference between the open and close prices.
📌 Since buyers and sellers both pushed the price, but couldn't maintain it, the pattern shows indecision and that more sideways movement could follow.
- Bearish engulfing : A bearish engulfing pattern is a technical chart pattern that signals lower prices to come. The pattern consists of an up (white or green) candlestick followed by a large down (black or red) candlestick that eclipses or "engulfs" the smaller up candle.
📚 A bearish engulfing pattern can occur anywhere, but it is more significant if it occurs after a price advance. This could be an uptrend or a pullback to the upside with a larger downtrend.
🔴 The pattern can be important because it shows sellers have overtaken the buyers and are pushing the price more aggressively down (down candle) than the buyers were able to push it up (up candle).
- Bearish harami : A bearish harami is a two bar Japanese candlestick pattern that suggests prices may soon reverse to the downside. The pattern consists of a long white candle followed by a small black candle. The opening and closing prices of the second candle must be contained within the body of the first candle. An uptrend precedes the formation of a bearish harami.
📚 A bearish harami is a candlestick chart indicator for reversal in a bull price movement.
📌 Traders can use technical indicators, such as the relative strength index (RSI) and the stochastic oscillator with a bearish harami to increase the chance of a successful trade.
- Dark cloud cover : Both candles should be relatively large, showing strong participation by traders and investors. When the pattern occurs with small candles it is typically less significant.
📚 Dark Cloud Cover is a candlestick pattern that shows a shift in momentum to the downside following a price rise.
The pattern is composed of a bearish candle that opens above but then closes below the midpoint of the prior bullish candle.
📌 Traders typically see if the candle following the bearish candle also shows declining prices. A further price decline following the bearish candle is called confirmation.
- Evening star : An evening star is a stock-price chart pattern used by technical analysts to detect when a trend is about to reverse. It is a bearish candlestick pattern consisting of three candles: a large white candlestick, a small-bodied candle, and a red candle.
📚 Evening star patterns are associated with the top of a price uptrend, signifying that the uptrend is nearing its end.
- Evening DOJI star : The Evening DOJI Star is a bearish reversal pattern, being very similar to the Evening Star. The only difference is that the Evening Doji Star needs to have a doji candle (except the Four-Price Doji) on the second line. The DOJI candle (second line) should not be preceded by or followed by a price gap.
📚 The pattern, as every other candlestick pattern, should be confirmed on the next candles by breaking out of the support zone or a trendline. If the occurrence is confirmed, then its third line may act as a resistance area. It also happens, however, that the pattern is merely a short pause prior further price increases.
- Bearish abandoned baby : A bearish abandoned baby is a specialized candlestick pattern consisting of three candles, one with rising prices, a second with holding prices, and a third with falling prices. Technical analysts expect that this pattern signals at least a short-term reversal in a currently upward trending price.
📚 This is a rare pattern that has a fairly strong track record for forecasting a short-term downward trend.
The key item of the pattern is the middle day, which should have a gap in front of it and following it, and which should close the session with price unchanged.
- Three black crows : The black crow pattern consists of three consecutive long-bodied candlesticks that have opened within the real body of the previous candle and closed lower than the previous candle.
📚 Three black crows is a bearish candlestick pattern used to predict the reversal of a current uptrend.
Traders use it alongside other technical indicators such as the relative strength index (RSI).
- Tweezer top : A tweezers topping pattern occurs when the highs of two candlesticks occur at almost exactly the same level following an advance.
📚 Tweezers are more meaningful as part of other trends, especially pullbacks.
- Three inside down : The three inside down pattern is a bearish reversal pattern composed of a large up candle, a smaller down candle contained within the prior candle, and then another down candle that closes below the close of the second candle.
📚 The down version of the pattern is bearish. It shows the price move higher is ending and the price is starting to move lower. Here are the characteristics of the pattern.
- Three outside down : The three outside down describe a pair of three-candle reversal patterns that appear on candlestick charts. The pattern requires three candles to form in a specific sequence, showing that the current trend has lost momentum and might signal a reversal of an existing trend.
📚 The first candle marks the beginning of the end for the prevailing trend as the second candle engulfs the first candle. The third candle marks an acceleration of the reversal.
- Advance block : Advance block is the name given to a candlestick trading pattern. The pattern is a three-candle bearish setup that is considered to be a reversal pattern—a suggestion that price action is about to change from what had been an upward trend to a downward trend in relatively short time frames.
📚 An advance block is a three-period candlestick pattern considered to forecast a reversal.
The pattern's success at predicting reversal is barely above random.
- Bearish stick sandwich : One candlestick pattern is the stick sandwich because it resembles a sandwich when plotted on a price chart - they will have the middle candlestick oppositely colored vs. the candlesticks on either side of it, both of which will have a larger trading range than the middle candlestick.
📚 These patterns may indicate either bullish or bearish trends, and so should be used in conjunction with other methods or signals
- Matching high : The first line of the pattern appears as a long line whereas the second one can be either long or short. Both candle lines need to close at the same level. Additionally, the opening of the second candle need to be higher than the opening of the previous candle.
📚 The Matching High is built of two MARUBOZO candles having white bodies. In other words, it can be a White MARUBOZO or a Closing White MARUBOZO.
- Bearish breakaway : The bearish breakaway is a formation of five candlesticks where the first is always bullish and the last is always bearish. The middle candlesticks will be rising and can be either bearish or bullish, but will usually be bullish.
📚 A bearish breakaway is a chart formation that can appear in a rising market when the price starts to pull or break away gradually to the downside.
- Bearish Tri-Star : Tri-Star patterns form when three consecutive DOJI candlesticks appear at the end of a prolonged trend.
📚 A Tri-Star pattern near a significant support or resistance level increases the probability of a successful trade.
- MARUBOZO : The black MARUBOZO is simply a long black (down, or red on the charts below) candle, with little to no upper or lower shadows. The pattern shows that sellers controlled the trading day from open to close, and is therefore a bearish pattern.
📚 How to avoid false MARUBOZO signals and setting stop-loss :
If bearish, take a short when price falls below;
Place a stop above candlestick.
🔴 NOTES :
- There are many bearish reversal patterns that we only present most useful patterns for trading !
- Most of them have 2 definition and direction ( Bearish and Bullish ) and we only present bearish reversal patterns !
- For better result in your trading, You need to confirm patterns through trend lines , momentum, oscillators, or volume indicators.
⏰ Best timeframes to work with candlestick patterns :
Traders usually use Monthly, Weekly, Daily, 4-Hour, Hourly, 15-Minute and even 1-Minute timeframes.
Ideally, traders pick the main timeframe they are interested in and then choose a longer and a shorter timeframe to complement the main one .
The longer timeframes typically contain fewer and more reliable signals. The shorter timeframes usually contain more signals with less accuracy.
There are several types of traders, and they have different trading styles.
📍 We will provide more contents for candlestick patterns in next weeks !
So stay tuned and support us with your LIKES, COMMENTS and FOLLOWINGS...
Have a great moments.
@Helical_Trades

Day trade reversal setup using Hull MA - over shoot!Hello, Traders around the globe,
Here is a reversal pattern of the Hull Moving Average.
Stage #1: You want to see an acceleration of momentum = the blue crosses have spaces inside them.
This stage is important because if you are doing day trade, you want to be sure that you are in a volatile environment.
You don't want to be where the market is choppy with zero range! .
This stage gives you the "flag" that the stock has a potential day trade opportunity.
The probability of you guessing the exact day that the stock will explode is low, that is why you wait for it to explode and trade the intraday reversal...
Stage #1 EXTRA: Now you know how to detect momentum opportunities, and can go into a lower timeframe and trade the continuation of the acceleration of momentum move... but this is for another post.
Stage #2: You want to see the Hull ma go above the price action = the OVERSHOOT!
Once you see that the Hull is crossing the price that means that momentum is running low ---> reversal is coming... (stage #1 made sure we are volatile, now we want to be sure we are overextended and momentum dries out!)
When the HULL moves above the highest high of the move, OVERSHOOT PHENOMENA, it means that the price got really overextended.
The HULL MA is trying to decrease lag, so it "anticipates" the direction, it gives chance for the price to correct to the right direction. If a strong move happens, the HULL expects it to continue, so it will rise above the high of the price movement, "hopeful" that the price movement will continue in its same momentum and force. since it doesn't... overshoot happens, and a reversal is likely to follow through.
Stage #3: You want the slope of the Hull ma to change direction, then you look for your personal reversal setup.
Overextended can become even more overextended, so it is better to be a little late, and be right, than trying many times to catch the TOP and be discouraged, which will make you miss the move!
Ideally, you want the HULL to be SYNCED :) If the HULL is SYNCED that means that it gives the best representation of the price action.
It is hard to sync the moving average every time, the market is changing...
It is easier to be able to recognize when it is synced and when it is not ===> That way, you know when you have better odds of it being accurate.

HOW TO SPOT A TREND REVERSAL?7 signs of a trend reversal
I will describe it in more detail in the next few posts.
As soon as I have some free time.
Dear followers, the best "Thank you" will be your likes and comments!
Before to trade my ideas make your own analysis.
Thanks for your support!
