Market Regime Analyzer — Understanding Consolidation Regimes
Markets don’t always trend. Much of the time, price oscillates within a range where mean reversion dominates and breakout strategies underperform.
This example illustrates how the Market Regime Analyzer identifies a Consolidation Regime and how price behavior aligns with that classification.
What the chart is showing:
Price rotates within a defined range without sustained directional expansion
Breakouts repeatedly fail or fade back into the range
Volatility remains contained and directional follow-through is limited
This behavior matches the indicator’s Consolidation Regime classification.
Indicator interpretation:
The oscillator fluctuates around a mean-reversion reference level
Oscillations around this level define the regime’s behavior
Volume pressure remains muted, reinforcing range-bound conditions
Transition probabilities strongly favor continued consolidation
Important:
The Market Regime Analyzer is not a trade signal. It is designed for regime awareness and strategy selection.
How this should influence decision-making? When a consolidation regime is active:
Trend-following strategies lose edge
Mean-reversion and range-based approaches perform better
Risk should be reduced on breakout attempts
Patience becomes a position
Understanding when not to force trades is a competitive advantage.
Indicator used:
Market Regime Analyzer
This indicator is designed to help traders align execution with market conditions, not predict direction.
Riskmangement

ETHUSD CRACK! Wave 3 Warning!🚨When it rains, it pours. We’re seeing concurrent breakdowns across multiple asset classes, consistent with the risks I’ve been flagging for some time.
ETH is at stage 5️⃣ Panic / Liquidity Event, more on this later.
ETH is now down -47% from ATH, after Wave 1 down.
ETH has been trading below the Death Cross X countertrend Wave 2, flagging out "Deeking"(Honey ticking)
Now it is Cracking the Flag. (Like many other asset classes)
🚩 Warning us that Wave 3 down is coming!
1️⃣ Early Drop (-5% to -10%) — Denial Phase
2️⃣ Correction Phase (-10% to -20%) — Reassurance Phase
3️⃣ Official Bear Market (-20%) — Commitment Trap
4️⃣ Deep Decline (-30%) — Moral Pressure Phase
5️⃣ Panic / Liquidity Event (-40% to -50%) — Narrative Flip
6️⃣ Late Stage / Bear Rally — False Hope
At Stage 5️⃣ Panic, you will hear these phrases.
“This was a black swan”
“No one could’ve predicted this”
“It’s different this time — but markets adapt”
“Valuations are now attractive”
“Big Money won’t allow a collapse”
📌 Translation: The damage is done. Rewrite history.
I need to make another post to get you all ready for what is to come, so you don't get suckered like I did when I was first starting out.
I paid the price, so you don't have to.
#FAFO
If you enjoy the work:
👉 Drop a solid comment
Let’s push it to 6,000 and keep building a community grounded in raw truth, not hype.

SOLUSD KEY AREASolana is entering a danger zone after double-topping while also forming a head-and-shoulders structure.
That combination matters.
The chart has already cracked once. That’s your warning shot.
If you’re not in SOL yet and you’re bullish:
This is the only area where a long makes sense—with a clearly defined stop. No stop, no trade.
If you’re bearish and looking to short:
Don’t front-run it. Wait for the next crack and trade against this level once it fails.
If you already own SOL and are inhaling hopium:
You do not want to see this level break. If it does, downside can accelerate fast.
Lastly, why are Cryptos down -50% and the $ down -10% +?
This is where discipline matters.
Don’t FAFO.
If you enjoy the work: 👉 Drop a solid comment. Let’s push it to 6,000 and keep building a community grounded in raw truth, not hype.

Not Every Trade Will Happen — Discipline Comes FirstSometimes the market gives us a setup… but the conditions we need never appear.
Price may reach a zone that looks promising, show a small reaction, and then move away.
For me, that first touch is information, not a trade.
I wait for confirmation — absorption, commitment, and proper structure on lower timeframes.
This approach means:
-watching price move without me,
-missing what might look like a “perfect” trade,
-staying flat while others are active.
And that’s okay.
Activity is not the same as progress.
By waiting for confirmation, I trade less — but with intention.
Risk stays defined, decisions remain clean, and outcomes become repeatable.
Not trading is not hesitation.
It’s discipline.
And discipline is part of the system.
>If you want to see how I analyze setups in real time and share my thought process on each move, hit follow and join the journey.

When Institutions Dump: What Retail Traders Must Remember?When Institutions Dump and Volatility Explodes: What Retail Traders Must Remember?
“Not every market condition is meant to be traded.”
Gold dropping from 5600 to 4700 in just two trading sessions
is not normal price action.
This is not retail-driven movement.
This is institutional liquidation.
And in such phases, most retail losses don’t come from bad analysis —
they come from being present when they shouldn’t be.
What Happens During Institutional Sell-Offs
When institutions unload positions:
• Volatility expands abnormally
• Spreads widen
• Stops get skipped or slipped
• Levels lose respect
• Momentum becomes violent
This is not a technical environment.
It’s a risk environment.
The market is not offering opportunity.
It is testing survival.
Why Retail Traders Get Hurt
Retail traders lose money in these phases because of:
• FOMO after large candles
• Oversized positions
• Trading without context
• Assuming “it can’t go further”
• Treating chaos like structure
Extreme volatility creates the illusion of opportunity.
In reality, it removes control.
Two Valid Choices for Retail Traders
There is no shame in either.
1. Stay Away Completely
If you don’t trade volatility professionally:
• Staying flat is a winning decision
• Protecting capital is the priority
• Waiting for structure to normalize is discipline
No trade is better than a forced trade.
2. Trade Smaller, Not Smarter
If you do participate:
• Reduce position size significantly
• Accept wider stops or don’t trade
• Avoid revenge and “catching bottoms”
• Trade only at higher-timeframe levels
• Expect slippage and imperfect execution
Risk management matters more than accuracy.
What to Avoid at All Costs
• Chasing big candles
• Trading emotionally charged news
• Assuming mean reversion
• Increasing size to “recover”
• Confusing volatility with edge
This is how accounts get wiped — not slowly, but suddenly.
The Professional Mindset in Extreme Markets
Professionals ask one question:
“Is this market tradable for my style?”
Retail traders ask:
“How can I profit from this move?”
That difference decides survival.
Capital saved during chaos
is capital available when clarity returns.
📘 Shared by @ChartIsMirror
In extreme volatility, do you step aside — or feel the urge to jump in?
Comment honestly. Awareness matters more than activity.

ORCL - From Erections Come CorrectionsORCL is a textbook example of a setup I call: “From Erections Come Corrections.”
1. It also shows why log charts lie to you on the way down.
When you’re evaluating downside risk, remember: every stock is always 100% away from zero.
A linear chart makes the real danger obvious. I don’t even need to measure this one — the drop is roughly 50% staring you in the face.
2. Look at the speed of that drop.
If you’re one of those heroes trying to squeeze an extra 3% at the top and end up wearing a -50% drawdown because you had no exit plan… that’s not bad luck — that’s greed and negligence teaming up to hand you a bag of sh*t.
3. But if you actually respected risk, took profits, and GTFO/STFO with cash in hand?
Now you get to walk back in as a well-refined gentleman or lady, gracefully to start building a position at at a “500% discount,” as Trump would say.
4. Notice anything magical on my chart?0
No algos. No secret indicators. No fairy-tale narratives. Not even candlesticks. Just plain vanilla price action.
That’s proper charting. Keep it simple.
You chose to play this game, so at least play it right.
Lastly, if the market tanks here, ORCL will just keep tanking as well. BUT! you will be getting in with a 50% discount already. That, my friends, is the difference.
THANK YOU for getting me to 5,000 followers! 🙏🔥
Let’s keep climbing.
If you enjoy the work:
👉 Drop a solid comment
Let’s push it to 6,000 and keep building a community grounded in truth, not hype.

NAS100 QQQ CRACKING! AGAIN!NASDAQ has been CRACKING everywhere, structure after structure. Now it's forming a major double top.
What we need to see now is lower lows and highs in a commanding way. If it continues this back-filling, then I would call this a High base for more upside.
This is a simple, low-risk, short setup. Trading it against previous highs. (even if it breaks a bit above it) with a lot of downside potential!
This is the cost of doing business the right way. Be willing to take the small hits until you get PAID! WELL!
So I would forget about this trade if I were planning to jump in and out. I would hold it, giving time to PAY ME!
If you enjoy the work:
👉 Drop a solid comment
Let’s push it to 6,000 and keep building a community grounded in raw truth, not hype.

XAUUSD — Strong Rally, Zero Permission Regime Invalid No TradeGold pushed aggressively higher today.
Momentum looks clean.
Breakouts look tempting.
Retail traders chase this move.
RegimeWorks does nothing.
Because price movement is not permission.
Top-down check:
• London session → CLOSED
• NY session → CLOSED
• 4H regime → INVALID
• Regime detail → Overextended
• Reversal permitted → NO
• Result → WAIT
When higher timeframe structure is stretched and sessions are closed, expectancy collapses.
This is exactly where most losses happen:
• chasing late trends
• trading outside liquidity
• forcing reversals into strength
Our system blocks all three automatically.
No setup = no trade.
Discipline is not about finding entries.
It’s about filtering bad environments.
Today gold moved.
We didn’t.
That’s correct behavior.
— RegimeWorks

The "Grinding" Bull—High Noise, Low EfficiencyUnlike the smooth Gold rally, Silver is struggling. The Neural Brain identifies a trend that is moving up but fighting heavy resistance every step of the way.
1. THE PHYSICS: Efficiency Score (0.05)
Status: Critical Inefficiency
The Data: For every $1 the price gains, it travels $20 in total path ($0.91 Net Move vs. $18.05 Total Noise).
The Meaning: The market is "churning." Buyers and sellers are in a violent tug-of-war. The price isn't gliding; it's clawing its way up.
2. THE MIND: Conviction (LOSING)
Status: Repelling Risk
Conviction: LOSING. The AI sees the chaotic volatility and determines the probability of a clean move is dropping.
Mode: FLAT (REPELLING). The system is mathematically rejecting new entries because the "Micro Action" is too messy.
3. THE STRATEGY: "HOLDING (Ignoring Noise)"
Status: Sit on Your Hands
Macro: Strong Bullish (Trend is up).
Micro: Noisy/Chop (Price action is messy).
Action: HOLD. The trend hasn't broken, so don't sell—but the "cost" of movement is too high to buy more. Wait for the Efficiency Score to recover (>0.30) before adding size.

USDJPY — No Trade Today | Regime Invalid = Capital PreservationToday is a textbook example of why permission > prediction.
My system didn’t place a single trade — by design.
Here’s what the regime framework detected:
• 4H trend bias → invalid (no directional edge)
• Volatility → expanding (unstable conditions)
• Both engines → BLOCKED
• Result → Flat
When volatility expands without structure, continuation and mean-reversion both degrade.
That’s the exact environment where most traders get chopped.
So instead of forcing setups…
The system does nothing.
No signal is a decision.
Flat is a position.
Capital preserved > random trades.
What would unlock trades?
For continuation (E1):
• 4H EMA alignment
• slope agreement
• volatility expansion with structure
For reversal (E3):
• contraction first
• then controlled extremes
Until then → no permission → no trade.
Most losses don’t come from bad entries.
They come from trading when there is no statistical edge.
Today the correct trade was discipline.
Regime first. Always.
— RegimeWorks
FUSIONMARKETS:USDJPY

USDCAD Simple SetupUnder the new leadership of Mark Carney, Canada is positioning itself intelligently for the next phase of global economic stress. Carney isn’t a politician learning economics on the fly—he’s a former Governor of the Bank of England who has already managed crises at the highest level. That matters when capital gets selective, and policy mistakes get punished.
Canada is also moving in the right external direction, deepening trade and industrial ties with the EU and China, particularly in energy and EV supply chains. At the same time, the U.S. is moving the opposite way—more isolationist, more confrontational, and less predictable under Trump, politically, militarily, and economically. Relative positioning matters in FX. Policy divergence plus capital flows make this pair structurally vulnerable to the downside—exactly what the chart is already signaling.
Lastly, CAD is a commodity trade as a little bonus. ;)
Counting is not political, so don't try to make it so.
If you enjoy the work:
👉 Drop a solid comment
Let’s push it to 6,000 and keep building a community grounded in raw truth, not hype.

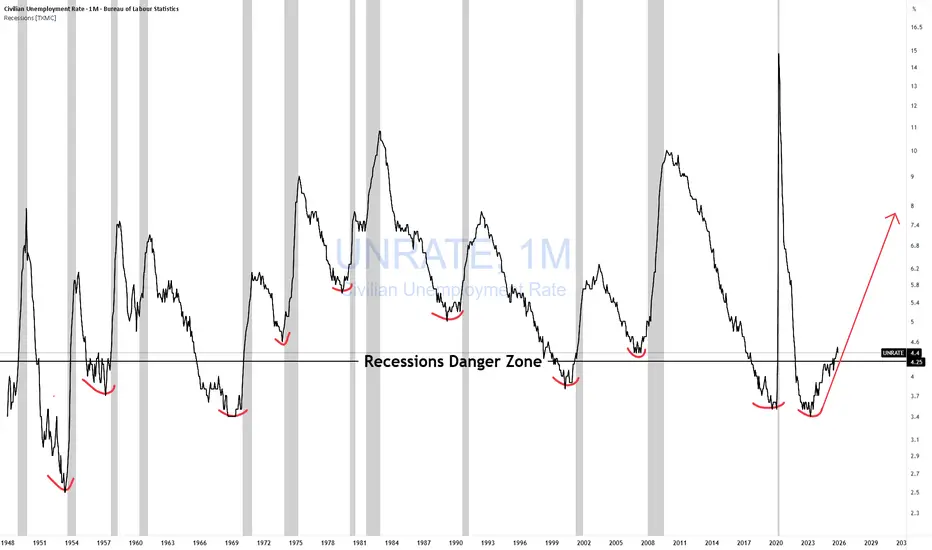
Unemployment Rate Danger Zone🚨 The Unemployment Inflection Point Investors Ignore
This chart isn’t about high unemployment.
It’s about the turn.
Across post-war history, U.S. recessions don’t start when unemployment is elevated. They start when unemployment:
• bottoms
• stops improving
• begins to rise from a low base
Those red markers indicate the same pattern has been repeating for over 70+ years.
Why the inflection matters
Unemployment is a lagging indicator — but its rate of change isn’t.
When unemployment turns up:
• Hiring freezes appear first
• margins compress next
• credit demand weakens
• earnings expectations lag reality
By the time job losses are obvious, markets have already repriced.
The current setup
Unemployment remains historically low — precisely when investors feel safest.
But the trend has turned.
That’s the danger zone.
Markets don’t break when conditions look bad.
They break when they stop getting better.
Investor takeaway
This isn’t a timing tool.
It’s a risk-regime signal.
Historically, this inflection has preceded:
• higher volatility
• weaker earnings
• tighter financial conditions
Low unemployment = low risk.
Watch the direction. Not the level.
If you enjoy the work:
👉 Drop a solid comment
Let’s push it to 6,000 and keep building a community grounded in raw truth, not hype.
Profits Rising, Credit Failing = CRASH!The Private Sector Isn’t Leveraging for Growth — So Why Are You Buying?
This chart cuts straight to the engine of the bull run in the stock market.
The blue line represents commercial and industrial loans relative to the money supply — a proxy for productive private-sector credit creation.
When it rises, businesses borrow to expand.
When it falls, they don’t.
Right now, "They Don't" it’s falling.
What history shows
A rollover in business credit efficiency precedes every recession:
Not GDP.
Not jobs.
Not inflation.
Credit moves first.
The structural issue
Each recovery now requires:
More money
More leverage
For less productive growth
That’s the law of diminishing returns to credit — and the long-term trend is down.
Why 2020 didn’t fix this
The post-COVID spike was emergency borrowing, not expansion. Once it passed, credit efficiency collapsed to new lows and never recovered.
That’s the tell:
The private sector isn’t willing to leverage for growth.
Why policy can’t save it
The Fed can cut rates and add reserves.
It can’t create profitable opportunities.
When ROI falls, borrowing stops — regardless of policy.
Bottom line
Expansions don’t end when rates rise.
They end when businesses stop borrowing productively.
If the private sector won’t leverage for growth,
Ask yourself what you’re buying.
#FAFO GTFO & STFO!
If you enjoy the work:
👉 Drop a solid comment
Let’s push it to 6,000 and keep building a community grounded in raw truth, not hype.

XAUUSD — Regime Valid, NY Open, No Reversal Permission (Waiting)FUSIONMARKETS:XAUUSD
Context, not signals.
Gold is currently in a valid higher-timeframe regime, but despite NY being open, reversal conditions are NOT permitted at this time.
What the framework is saying
HTF Regime: ✅ Valid
London Session: ❌ Closed
NY Session: ✅ Open
Reversal Permission: ❌ No
Outcome: Waiting
This means:
Trend structure is still intact
No confirmed regime weakness
No stretched conditions aligned with a sweep/rejection model
In other words: there is no permission to fade this move yet.
Why no trade here
Reversal engines in RegimeWorks only activate when:
Trend continuation weakens
Price is not stretched
Session context supports liquidity-driven reversals
None of those conditions are fully met right now.
Key takeaway
Not trading is a decision.
If the regime has not broken, there is nothing to “anticipate.”
Patience here protects capital and keeps the system aligned with its rules.
RegimeWorks philosophy:
Entries are temporary opinions. Regime is permanent law.

The Investment Hierarchy: Focus On What Truly MattersThe Investment Hierarchy is my personal approach to investing in the market, and I want to share it with you today.
Many investors/traders mistakenly prioritize technical analysis, but that should actually come last.
The foundation of successful investing is trading psychology (patience and emotions), risk management, and fundamental analysis. These are what truly determine success.
🤔 Most people lose money investing… How do you avoid becoming one?
Without solid risk management, even the best technical analysis is useless. Poor risk strategies lead to big losses, which impatience and emotional trading make even worse.
Over 90% of short-term traders lose money. But long-term investors who focus on fundamental analysis significantly increase their profitability.
That's what my Investment Hierarchy is about: making decisions based on psychology, risk management, fundamental analysis, and technical analysis—in that order.
Master these, and you'll become a winning investor.
Henrique Centieiro Investment Hierarchy
😀😖 Patience and Emotions:
Be patient and aggressive only when it's time
Never revenge trade—stick to your strategy
Don't follow the crowd (if everyone won, everyone would be rich)
Keep emotions in check - don't trust your gut
Protect your emotional capital with a strategy that lets you sleep at night
Invest in businesses, don't trade them
⚠️ Risk Management:
Follow trends early, never bet against them
Longer time horizons = lower risk
Use position sizing as your best stop-loss
Diversify across at least 15 different investments
Understand risk/reward ratios and prioritize asymmetric bets
Rebalance and take profits regularly
🧑🏻💻 Fundamental Analysis:
Build a standardized research framework
Analyze quantitative factors
Research qualitative factors
Know the difference between price and value-invest in undervalued assets
📈 Technical Analysis:
Use TA as a supplementary tool only
Apply momentum indicators and moving averages to spot good entry/exit points
Understand market cycles through patterns and indicators
🧠 Conclusion
The Investment Hierarchy prioritizes psychology, risk management, and fundamentals before technical analysis.
Jumping straight to charts ignores market complexity. Real success comes from multiple factors, not just historical data.
This approach empowers you to make informed decisions, minimize losses, and optimize long-term gains.
Build your ship of knowledge to weather the storms! 🌊⛵🏝️

“I Was Right” in Trading Has Two Parts, Ego Only Understands OneI’ve written before about the ego trap in trading — how many traders care more about being right than being profitable.
But today, let’s be brutally honest.
Most traders don’t lose money because they lack knowledge.
They lose because they’re addicted to one sentence: “I was right.”
Not “I executed well.”
Not “I managed risk.”
Not “I took profit like a professional.”
Just: “I was right.”
And the most dangerous part is this:
They can lose money…
and still feel successful…
because the chart eventually moved in the direction they predicted.
But trading is not a debate.
Trading is not a prediction contest.
Trading is not an ego competition.
Trading is a performance business.
And if you want brutal clarity, here it is:
✅ “I was right” has TWO components.
And if you only have one of them… you were not right.
The “I Was Right” addiction (and why it destroys traders)
- Being “right” feels good.
- It feeds the ego.
- It gives you the illusion of control.
- It makes you feel smarter than the market.
That’s why traders love saying things like:
- “I called it!”
- “I told you!”
- “Look at price now!”
- “My target got hit!”
But markets don’t reward ego.
Markets reward survival + execution.
So let’s define what “I was right” actually means.
Component #1: The market must move the way you said it would (in the correct order)
This is the part most traders misunderstand.
Because they think being right means: “My target was hit.”
But that’s not what being right means in trading.
Real example (Gold Monday)
Let’s say your Monday analysis looked like this:
“Gold will fill the weekend gap first, and then it will rally to 4850.”
Clean plan.
Clean logic.
Two-step scenario.
Now imagine what actually happens:
- The gap never gets filled
- Price rallies directly
- Gold reaches 4850
And suddenly, people say:
✅ “See? I was right!”
No! You weren’t!
If the entry never happened, you weren’t right
Let’s be brutally clear:
If your plan was gap fill first, and the gap was never filled… then your analysis was wrong.
Even if gold went up.
Even if it went to your target.
Because trading is not about what eventually happens.
Trading is about the path you traded.
Your scenario had a sequence:
- Gap fill
- Rally to 4850
If step 1 fails, the trade idea fails.
The market didn’t follow your plan.
It only coincidentally touched your number.
And coincidence is not skill.
Why this matters (the arguments ego traders hate)
1) A target being hit is meaningless if no trade was triggered
A trade is not a prediction.
A trade is a sequence:
s etup → trigger → entry → execution → exit
If your entry condition never happened, your trade never existed in real life.
So price reaching 4850 doesn’t prove you were right.
It proves only one thing:
Price can hit levels without respecting your logic.
2) You can’t claim correctness without the entry
This is where ego starts cheating.
Instead of saying: “My entry condition failed.”
Ego traders say: “The target was hit, so I was right.”
That’s not analysis.
That’s self-defense.
A forecast without an executable entry is not a trade plan.
It’s a story.
3) If the order of events is wrong, the thesis is wrong
When you say “gap fill first,” you’re implying structure:
- price must retrace
- liquidity must be taken
- imbalance must be resolved
- the market should behave in a specific way
If that doesn’t happen… your read was incorrect.
Price hitting your final level doesn’t fix your thesis.
It only hides the mistake.
4 ) The worst part: it creates fake confidence
And fake confidence is lethal.
Because next time, the trader starts thinking:
“Even if my entry doesn’t happen, my targets are still correct.”
So they begin to:
- chase price
- force entries
- ignore invalidation
- move stops
- overleverage
And that’s how the “I was right” mindset quietly becomes account suicide.
Component #2: Your trade must survive the move (otherwise you were never right)
Now we reach the part that destroys accounts.
Because trading is not forecasting.
- It’s not “October target ideas.”
- It’s not being a chart prophet.
Trading is execution under risk.
And here’s the truth:
✅ The market can move in your direction
❌ and you can still be completely wrong
How?
Because if you didn’t manage risk properly… the market can wipe you out before it proves your target “right.”
Real example: “Gold will reach 4850 said on October” (and you still weren’t right)
Let’s use a real situation.
Imagine it’s October.
Gold is trading around 4300.
And you post confidently:
“Gold will go to 4850.”
Eventually, gold does reach 4850.
And you instantly say:
✅ “I was right!”
But here’s what you ignore — the part that matters:
Before reaching 4850, gold dropped nearly 5000 pips in 6 days
Now let’s speak like adults.
If price moved against you almost 5000 pips in a week… and you were trading margin (not holding physical gold long-term)… then you did “experience volatility.”
Also you experienced something far worse:
✅ you got margin called
✅ you got liquidated
✅ you lost the account
So no — you were not right.
Even if the chart later touched your magical number.
Because trading is not a screenshot.
It’s survival.
The question professionals ask (and ego traders avoid)
When someone says: “Gold will reach 4850”
A professional doesn’t say: “Wow, what a target!”
A professional asks:
- Where is the entry?
- Where is the invalidation?
- Where is the stop loss?
- What’s the position size?
- What’s the maximum tolerated drawdown?
- Can the account survive the path?
Because if you didn’t define the risk… you didn’t make a trading plan.
You made a wish.
And wishes don’t protect accounts.
The difference between analysts and traders
This is where many people get confused.
Analysts want to be correct.
Traders want to get paid.
And you can’t get paid if you treat risk as an optional detail.
That’s why so many people win debates and lose money.
They keep saying:
- “I called it”
- “I was right”
- “check the chart now”
But their account is dead.
And the market does not pay for predictions.
It pays for execution.
The ego trap: “being right” becomes more important than making money
This is the psychological disease behind most retail trading failure.
The ego loves being right because it protects identity.
It allows you to lose money while still feeling smart.
It turns trading into an emotional game where the goal is not profit…
The goal is not being wrong.
But the market doesn’t care about your ego.
There are no grades for “good idea.”
There is no prize for “almost correct.”
There is no trophy for “eventually it happened.”
Only one thing matters:
✅ Did you make money with controlled risk?
If not…
you weren’t right.
The ONLY rule: Right means right in execution, not right in theory
Here’s the rule that destroys the “I was right” addiction:
A prediction is not correctness.
Correctness is profitability with survival.
So yes — “I was right” has two parts:
1) The market moved exactly as expected (including the sequence)
and…
2) Your execution survived the path
Miss either one?
You weren’t right.
You were lucky.
Or reckless.
Or both.
Final message: Stop trying to be right — start trying to be profitable
You don’t need to win against the market or arguments with others.
You need to work with the market.
You don’t need perfect forecasts.
You need:
- clear invalidation levels
- realistic timing
- risk control
- the ability to survive
Because a trader who survives can always come back.
But a trader who blows up while being “right”… will never trade the next opportunity.
And that is the most expensive form of correctness.
The market doesn’t reward conviction and hypothetical targets reached
It rewards execution.
Best Regards!
Mihai Iacob

NFLX & NVDA = Hagia Sophia WARNING!🚨 WARNING! NVDA is the next NFLX
I first started warning about NFLX in the summer. You can see the formation setups step by step here. From H&S to the Hagia Sophia (rounding top) with a tower (head test)
The only time you will see such a pattern is at tops!
The H&S never failed. instead it head tested, which ended up being extreme. (Not uncommon in a raging, euphoric, bubbalicious market.)
What is most important about the Hagia Sophia pattern is that it signals that we are in the endgame stages of the move.
It's time to GTFO & STFO!
When exactly you GTFO is not as relevant as actually GTFO! You always need an exit strategy. Otherwise, you will ride it all the way back down, right into losses.
Shorting it on the other hand is differnet animal. This is the time to start picking your battles. Dipping your toe in the water, ready to take losses until it fails.
In this case, there were 3 key areas (CRACKS) to short. Two out of the 3 would have gotten you huge gains IF you understood the pattern.
NVDA looks the same today as NFLX looked back in the summer.
If you are long - GTFO RUN with Profits & STFO!
If you want to short wait for the next key area to CRACK!
Lastly, I bet you are wondering if NFLX is done going down? Answer is NO!
NFLX is now at 4️⃣ Deep Decline (-30%) — Moral Pressure Phase
“Buy when there’s blood in the streets”
“This is how generational wealth is made”
“The smart money is buying”
“Be greedy when others are fearful”
“This is once-in-a-decade”
📌 Translation: We need new buyers to absorb forced selling.
#FAFO
If you enjoy the work:
👉 Drop a solid comment
Let’s push it to 6,000 and keep building a community grounded in raw truth, not hype.

BTC Gold - BKC Charting ExampleBare Knuckle Charting BKC is something I developed (And still developing) over the years.
I will use this chart to give you a crash course in BKC.
Here is the original post I made back in March to follow along. )
So, BKC, let's start with:
1. Always start with a plain chart.
2. 99.9% of the time, look for 3 waves plus a hook.
3. Count 4 points (2 top and 2 bottom) connecting with a line. Price can NEVER violate price. EVER! so it must be the highest or lowest points in that particular wave.
4. A structure will reveal itself pointing in a direction up, down sideways.
-Sideways means continuation of the previous trend.
-Up/Down structure means a reversal structure is coming.
5. Now you can clearly identify key areas of the structure. What I call "CRACK!" A break in momentum.
6. A CRACK can collapse or give you early warning signs.
7. Once a crack has revealed itself at key areas, don't be fooled by the subsequent price action. This is where most get F up. They don't see what you see. A CRACK & weak buying barely trying to hold the trendline that will ultimately CRACK again and more likely than not collapse with them holding a bag of schitt! Mesmerized with the overall trend and more specifically mesmerized by the most recent trend after the CRACK (they don't see) that moved in their favor.
These people can't see past their noses. Completely unaware of what is actually happening. The best part is when they show you a chart, they just draw lines randomly violating price (CRACKS) and concluding that the chart is bullish or bearish, and telling you how it is. HAHAHAHA! SMH!
8. Because you can all see past your noses using BKC. This will help you in so many ways that you can't even imagine! Why?
- You won't take random trades anywhere in the chart! You will wait for key areas to get involved. This alone will dramatically cut down on the # of needle trades you make, which at best are 50/50 happenstance results that you then give meaning to. Basically, gambling with the illusion of analysis.
-Next, you completely remove the subjectivity and cute stories that produce the illusion of "analysis."
THIS IS IMPORTANT! With BKC you extract information FROM the data. Not applying your vague hunches and feelings TO THE DATA! That's the difference between Real & Illusion of analysis.
- Continuing on. With BKC, you have a much more holistic understanding of price and what investors' emotions are. It's all right there in the chart. People talking with their money. Not their mouth!
- Once you see charts properly and understand what they are actually telling you, Waves - hooks - Structures - key Areas - Strengths -Weaknesses - CRACKS etc... you can't UNSEE IT! It's impossible!
- Your actual trade or investment positioning and size drastically improve. You understand that a single CRACK may just be a warning, as such, you don't run out and bet the farm and have it blow up in your face! That alone will greatly improve win win-loss ratio and help prevent blown-out accounts or massive losses. You can't be a trader investor if you are losing your ars beyond the typical cost of doing business draw downs. That is just so basic!
- Most importantly, you will finally STOP! this maddening going for 2, 3, 4% "targets"! Then on to the next big guess and keep repeating until you blow yourself out! I know I used to do it! Now with BKC you will go for mammoth moves 30, 50, 75, 100% plus moves! Bc you see the holistic view. Not the hiccups of random simple price movement, thinking you did something.
- With BKC, Small losses are viewed as informational. Schitt didn't do what it was supposed to do. It went back into structure strongly, so I am out! Simple. Who cares? If I repeat this 10 times in the end, I will be profitable. Even if 9 weren't! WHAT? Yes! Because when you go for the big moves, that is actually possible as crazy as it sounds. But you will never experience that unless you actually learn how to do it. That's what BKC is for. You will never learn how to do it if you keep going for silly 2-3% piker moves! 100% GUARANTEED! You must stop wasting your time & fooling yourself with randomness and then trying to apply meaning to it.
This is not by any means an inferential! You all share your stuff and approaches, scripts, bots, and mostly the same old tired candlesticks, moving averages, FIBS, and targets etc.. which is why you can all speak the same language and understand each other, but fail to produce real, meaningful results.
BKC is a completely different approach as far as I know. It does not give you a fish, it teaches you HOW to fish! For BIG ONES!
I will keep posting examples here as I have been, but now you should have a bit more clarity as to how and why I post what I post. Follow along and see the difference in real time. No hindsight crystal ball nonsensical bullschitt.
As for this chart with a H&S at a top Look for a pop then a drop! Should this H&S break, it will be ugly for the Crypto Bros.!
The proof is in the pudding! ;)
THANK YOU for getting me to 5,000 followers! 🙏🔥
Let’s keep climbing.
If you enjoy the work:
👉 Boost
👉 Follow
👉 Drop a solid comment
Let’s push it to 6,000 and keep building a community grounded in truth, not hype.

USDJPY M15 Bullish Liquidity Reversal Setup📝 Description
After a sharp sell-off and sell-side liquidity sweep, FX:USDJPY price has entered a reactive phase. Early signs of a short-term bullish reversal are visible on the M15 timeframe.
________________________________________
📈 Signal / Analysis
Primary Bias: Bullish while price holds above the M15 liquidity low
Preferred Setup:
• Entry: 157.700
• Stop Loss: Below 157.561
• TP1: 157.920
• TP2: 158.043
• TP3: 158.210 (BPR / higher liquidity)
________________________________________
🎯 ICT & SMC Notes
• Sell-side liquidity fully swept on M15
• Strong displacement candle from demand
• Price reclaimed internal range low
________________________________________
📌 Summary
As long as price remains above the recent demand zone, the dominant scenario is a bullish continuation toward overhead BPR and liquidity pools. A break below the recent low weakens this setup.
________________________________________
📰 Fundamental Notes / Sentiment
Following recent trade-related rhetoric and policy uncertainty, USD momentum has weakened, increasing volatility risk. While a buy scenario remains valid on structure, current headlines argue for stricter risk management, as sudden shifts in sentiment can trigger sharp pullbacks before continuation.
________________________________________
⚠️ Risk Disclosure
Trading involves substantial risk and may result in capital loss. This analysis is for educational purposes only and does not constitute financial advice. Always apply proper risk management, predefined stop-loss levels, and disciplined position sizing aligned with your trading plan.

TSLA Remains A Dead TradeDouble top, Rising wedge failure with a minor Crack followed by two major CRACKS!
For four years now, people have been chasing narratives rather than value. "Pilot testing" makes no difference. It's all baked in and then some. Don't lose your money chasing narratives.
As I have been warning for a long time now.
If narratives mattered more than price, this wouldn’t look like this.
Look for the previous low to break.
THANK YOU for getting me to 5,000 followers! 🙏🔥
Let’s keep climbing.
If you enjoy the work:
👉 Drop a solid comment
Let’s push it to 6,000 and keep building a community grounded in truth, not hype.

XAUUSD — The Easiest Trade Today Was Doing NothingFUSIONMARKETS:XAUUSD
Look at the panel — the decision was already made:
NY Behavior: CLOSED
Regime: INVALID
Outcome: No Trade
No indicators to interpret.
No lower-timeframe hunting.
Just one rule:
If the session is closed, the market has not invited you.
Most losses come from trading outside permission.
Today was not a “missed move” — it was a correct skip.
Discipline isn’t dramatic.
It’s boring, repeatable, and visible on the chart.
RegimeWorks Reading
London Behavior: closed
NY Behavior: closed
Permission layer: inactive
Outcome: No Trade
Edge = knowing when to do nothing.
— RegimeWorks
Follow for daily permission checks, not daily predictions.

The Art of the Exit: Mastering the "Wise Cut"Hello Friends, Welcom to RK_Chaarts,
Today we are going to understand that what is The Art of the Exit: Why "Cutting Losses" is Your Most Important Skill.
Let’s be real: nobody likes losing money. It stings. But if you’re going to survive in these markets, you have to get comfortable with being wrong.
In trading, a loss is just a business expense. The goal isn’t to avoid them entirely (that’s impossible); the goal is to keep them small enough that they don't take you out of the game.
Here is how to manage your exits without losing your mind—or your account:
1. Your Stop-Loss is Non-Negotiable
Think of a stop-loss as your "insurance policy." You should know exactly where you’re getting out before you ever hit the buy button. By setting a hard exit point, you take the decision-making out of your hands when emotions are running high.
2. Stick to the Script
We’ve all been there: price hits your stop, and you think, "Maybe if I just give it a few more pips, it’ll bounce." Don't do it. That’s how a small, manageable loss turns into a portfolio-killer. Trust your plan, not your gut.
3. Lock in Gains with Trailing Stops
If a trade is moving in your favor, don’t be greedy. Use a trailing stop to follow the price up (or down). This lets you stay in the trend while ensuring that even if the market reverses, you still walk away with a profit.
4. Don't Bet the House
The "Golden Rule" is simple: never risk more than you can afford to lose on a single trade. Most pros only risk 1-2% of their account per setup. This way, even a string of five losses is just a minor setback, not a disaster.
5. Keep an Eye on the Bigger Picture
Markets don't move in a vacuum. High-impact news or economic shifts can wreck a perfectly good technical setup. Stay informed, check the calendar, and be ready to step aside if the environment gets too chaotic.
6. "Hope" is Not a Strategy
Holding onto a losing position and praying for a miracle is the fastest way to blow an account. Cut the dead weight early. There will always be another setup tomorrow. Protect your capital so you can live to trade it.
7. Pay for Your Education
Every time you take a loss, you’ve essentially paid a "tuition fee" to the market. Don't waste it. Review the trade: Did you follow your rules? Was the entry off? Use those mistakes to sharpen your edge for the next one.
The Bottom Line
Trading isn't about being right; it's about math and discipline. If you can keep your losses small and your winners big, the math will eventually work in your favor.
Stop trying to be "right" and start being "profitable."
How do you handle a losing streak? Drop a comment below 👇
I am not Sebi registered analyst.
My studies are for educational purpose only.
Please Consult your financial advisor before trading or investing.
I am not responsible for any kinds of your profits and your losses.
Most investors treat trading as a hobby because they have a full-time job doing something else.
However, If you treat trading like a business, it will pay you like a business.
If you treat like a hobby, hobbies don't pay, they cost you...!
Hope this post is helpful to community
Thanks
RK💕
Disclaimer and Risk Warning.
The analysis and discussion provided on in.tradingview.com is intended for educational purposes only and should not be relied upon for trading decisions. RK_Chaarts is not an investment adviser and the information provided here should not be taken as professional investment advice. Before buying or selling any investments, securities, or precious metals, it is recommended that you conduct your own due diligence. RK_Chaarts does not share in your profits and will not take responsibility for any losses you may incur. So Please Consult your financial advisor before trading or investing.

What RegimeWorks Means – And Why I Often Don’t TradeMost traders start with entries.
I start with permission.
RegimeWorks is not a signal method – it is a decision filter built on three questions:
Is the market currently behaving in a defined regime?
Is the active session appropriate for participation?
Is today’s quality high enough to justify risk?
If any answer is “no” → the correct trade is to do nothing.
That is why many of my ideas show no-trade outcomes.
Not because the market is “bad,” but because discipline is part of edge.
Good trading is not about finding reasons to click buy or sell.
It is about filtering conditions where behavior and liquidity disagree.
If this page looks boring, that is intentional.
Professional process usually is.
What you will NOT find here
• No signals
• No hindsight entries
• No prediction contests
• No hype
What you WILL find
• Context before action
• Session awareness
• Risk-first thinking
• One behavior at a time
The indicator shown on my charts is a framework tool only – it defines when to be cautious before when to participate.
