Evoqua Water Technologies Corp. the ultimate commodity
Cash in on the worlds most treasured commodity
Alert set for break above $22.65 for possible long entry above $22.78
Target price $24.96
Stop loss $21.80
Company profile
Evoqua Water Technologies Corp. is a holding company, which engages in the provision of water treatment solutions. It operates through the Integrated Solutions and Services and Applied Product Technologies business segments. The Integrated Solutions and Services segment focuses on engaging directly with end users. The Applied Product Technologies segment develops product platforms to be sold primarily through third party channels. The company was founded on October 7, 2013 and is headquartered in Pittsburgh, PA.
Search in ideas for "COMMODITY"

Exchanges and commodity marketThe last winter session on domestic stock exchanges will be influenced by the situation on world exchanges and the commodity market. The dynamics of quotations will be mixed, and the Mosbirzhi index will remain within the range of 2900-3000 points.

XAUUSD - O que fazer?Nas últimas semanas vimos o OURO numa grande ALTA. Mas nessa última semana a “coisa” foi um pouco diferente, após sua abertura com um gap com mais de 1.000 pontos no dia 23 e atingindo sua máxima em 1689.56 no dia seguinte, o commodity passou o resto da semana numa acumulação entre as regiões de 1655/1626 e fechando a semana com um rompimento lindo nos mostrando uma possível reversão de tendência.
Vamos ficar atentos nos próximos dias pois a longo prazo a tendência de mantem em ALTA, mesmo o preço nos mostrando intenção de queda com esse rompimento de sexta. O que podemos esperar é a decisão nessa região em que o preço fechou. Caso tenha o rompimento dessa LTA podemos procurar uma venda a curto prazo até o próximo suporte que se encontra em 1548.886 ou levar até aproxima LTA. Cuidado para as operações de venda! Devemos esperar o padrão e sua intenção para então entrarmos de fato na operação, mas caso haja o respeito por essa LTA em que está e que o já buscou um rompimento, podemos buscar aí boas oportunidades de compra seguindo assim a tendência principal que se mantem de ALTA.

CADJPY Reversal Chart Pattern For Sure?!Risk appetite appears to have improved somewhat during the Asian session, and the Loonie has been the strongest among the comdoll bunch.
This is likely because the commodity currency is having some strength after Canadian data and a pickup in crude oil as well. After all, there are speculations that the OPEC could consider an increase in output cuts or at least an extension of their agreement in order to prop prices up.
On the flip side, the LYSH yen is losing ground to risk-on flows while also facing the possibility of a Q4 GDP contraction.
With that, I’m looking at this inverted head and shoulders breakout on CAD/JPY, especially since the pair appears to be making a retest of the broken neckline.
If you think that this reversal is about to gain friction from here, shorting in at market with a stop that’s enough to weather the pair’s average daily volatility 50.3 pips could be a good play.

Gold Battling With Resistance & Support!The behaviour of Gold has been consistent over the past couple of years where we have seen trends
followed by consolidation periods. The most recent breakout of consolidation on the 6th January 2020,
saw price sharply rise to a height of $1.611 but that was short-lived.
Price re-entered the consolidation zone and things were not looking good for Gold as its rival commodity,
Palladium, is soaring to new all-time highs.
Despite moving back into consolidation, the buyers did not give up and have again pushed price back up
and above the resistance level at $1,557. If there is a good amount of momentum built up then we should
see price approach the next resistance level at $1,611.
A breakout there will confirm a continuation to the upside and we should continue to see long-term
growth in the price of Gold.
See below for more information on our trading techniques.
As always, keep it simple, keep it Sublime.

Rally still it is - GOLDAssalamualaikum and Cheers guys !
Simple market view for Gold in Hour 1 timeframe.
As long as price above the invalidation price, we bias buy for this magnificent commodity !
Goodd Luck !


Will currency wars replace commodity wars?In general, Monday began quite peacefully. China has been non-aggressive in its response to Trump who has signed into law a bill that supports pro-democracy protesters in Hong Kong. And it seemed that we were waiting for another boring day.
However, Trump once again showed why we prefer the sale of the dollar for a quite long time. He began the day by accusing Argentina and Brazil of understating their national currencies value to gain a competitive advantage for their products in the US market. In response, the President of the United States raised tariffs on the import of steel and aluminium from these countries.
Well, he continued with the Fed’s traditional accusations of overvaluation of the dollar and called on the Central Bank to weaken monetary policy and the dollar.
Markets took it as signals for sales of the American currency. Moreover, the buyers on the dollar were not happy with the data on the ISM Index in the US manufacturing sector: 48.1 pips with a forecast of 49.2 pips. Recall that an index value below 50 signals a deterioration in business activity in the US manufacturing sector.
Well, returning to Trump and his actions on Monday, in the light of such events, it’s premature to talk about the end of the trade wars. Rather, on the contrary, there is a reason to talk about the transition of trade wars to currency wars with the consequences that maybe even more devastating for the global economy. In general, the future looks rather bleak. In this regard, our recommendations to buy safe-haven assets remain relevant.
Our basic positions for today are: finding points for sales of the dollar, purchases of gold and the Japanese yen, sales of oil and the Russian ruble. We also note that while the period of low volatility continues on the foreign exchange market, it is worthwhile to continue aggressive trading on the intraday basis without obvious preferences, for which you can use watch oscillators.

LET THE MARKET SHOW YOU WHERE TO GONotice the 5 touches of previous resistance marked by the blue arrows. This "strong level" entices people to sell and place their stops just above the level. See how price begins to fall from this level marked at the red arrow? This also draws more sellers into the market; people don't want to miss out; then BOOM! Price breaks the level and wipes out everyone who shorted earlier. The banks know people place stops here. It is great liquidity for them to take then drive price further down. Think of it like this, if you could enter above the level with a sell order you are already getting a better entry price. Currently CHF and JPY are strong as they are safe haven currencies, so it is a good time to short commodity currencies against them. I'm in this trade. Results to follow.

XAUUSD POTENTIAL OUTLOOK (1W CHART) XAUUSD POTENTIAL OUTCOMES
I'M MAKING THIS CHART BY SPECIAL REQUEST AND AFTER LOOKING AT THIS COMMODITY THE CHART IS SHOWING ME TWO POTENTIAL OUTCOMES. RECENTLY XAUUSD BROKE ABOVE RECENT SIGNIFICANT STRUCTURE OF 1350 PRICE ZONE. THERE ARE REALLY TWO THINGS THAT CAN HAPPEN HERE. FIRST OFF WHEN A BREAKOUT ABOVE OR BELOW STRUCTURE OCCURS YOU WANT TO WAIT FOR CONFIRMATION THAT IT'S A TRUE BREAKOUT BEFORE TRADING. THIS WILL ELIMINATE RISK MORE SO BY GIVING A MORE SOUND PROOF REASON BEHIND TAKING A TRADE. A WAY TO TELL IF IT IS A ACTUAL BREAKOUT OR NOT FIRST IS THE POWER OF THE BREAKOUT, THE MOMENTUM AND STRENGTH OF THE BREAKOUT IS VERY CRUCIAL. THIS IS DUE TO THE FACT THAT IF YOU SEE A VERY STRONG BREAK IT SHOWS IT TOOK A LOT OF BUYING/SELLER POWER TO GET THROUGH THAT LEVEL, SHOWING IT'S A SIGNIFICANT LEVEL AND ALSO A SIGNIFICANT BREAK. SECOND, YOU WANT TO WAIT AND SEE HOW THE RE-TEST IS; IF PRICE JUST RUNS RIGHT BACK AFTER THE BREAK THAN IT'S A FAKEOUT, IF PRICE SLOWLY RE-TESTS THE AREA WITH SOME RESTS AND SMALL PULLBACKS IT SHOWS IT WAS A LEGIT BREAK AND WAIT FOR THAT BUYER/SELLER MOMENTUM TO RESUME BEFORE TAKING A TRADE. THIS ALSO GIVES YOU BETTER RISK TO REWARD WITH YOUR SETUPS. YOU WANT TO BUY LOW AND SELL HIGH. THIS IS MY OUTLOOK ON XAUUSD SO NOW WE HAVE TO WAIT AND SEE IF PRICE RUNS RIGHT BACK (FAKEOUT) OR IF PRICE HOLDS, HAS A WEAK SELLER RE-TEST, AND BUYER MOMENTUM AND STRENGTH COMES BACK. HOPE THIS HELPS LETS KEEP AN EYE OUT!
CHEERS!

Gold again!! My Favorite Commodity coming with my Favorite SetupHello Traders! Its Monday now in Indonesia and of course the market is freshly opened today! as soon as i open my PC and saw this, well there is only one way i know that this beautiful gold will go. Soar high to the North!
Here in XAUUSD timeframe H4 we could see a potential bullish trend will arise, with a low and higher low already created, big potential 1426 will become a higher low area with fibo 50% as the supporting support area. we will just need to wait for confirmation from now, which is price breaking 1430 to make a swing low. after that, we will see Gold will rise higher.
also if we see the stochastic oscillator, we could see there is a Hidden Bullish Divergence which helps me confirm my analysis about Gold.
So Good luck for us, and lets ride this commodity together.
Let the Profit be With You

Overall view of XAUUSD or gold - Update of June 24th weekThe commodity has been on a continuous bull since the beginning of June's month, leaving a huge 10,000 pips (10,000 USD per contract or 100.00 per unit) between the actual trading price and the support zone. Odds of a trend resumption decreased but are still high unless we trade below @1400.000.
Possible targets: @1460.000 (+60.00 per unit or 6,000pips) and @1500.000(+100.00 per unit or 10,000 pips).
Advice: Stay bullish and buy at any low point while we don't break down the 1400.000 bottom level.

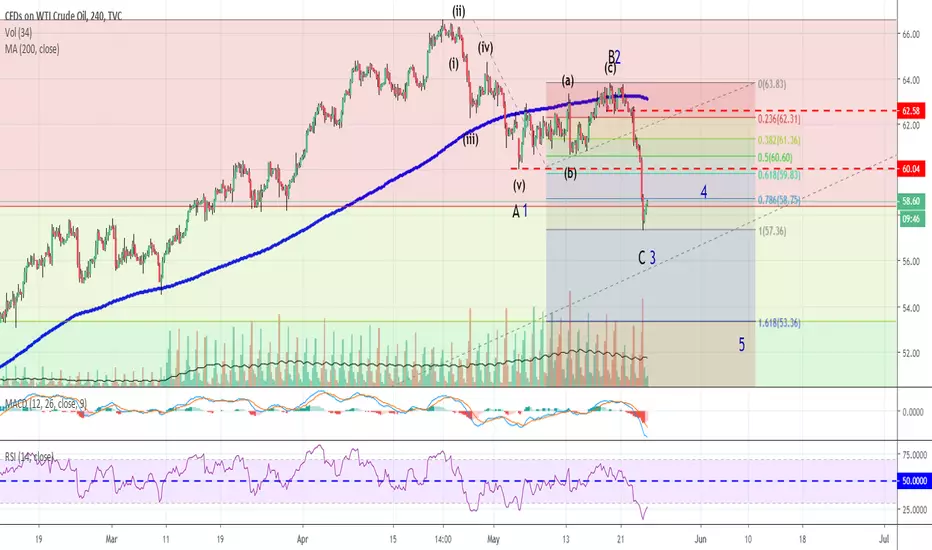
Active Crude Trade and 2 alternate countsHi,
I just thought I would share this trade entered over the past 2 days. I'm not quite sure show it will turn out just yet.
Despite OPEC signalling it will reduce output and international sanctions reducing supply, the chart said down so I entered short. I just wanted to share some thoughts on expectations. Black is the primary (more pessimistic count) and blue is the more optimistic count. After a steep drop we are hanging out for a bit so that I can post and go through best-case / worst-case scenarios
Black: We are in wave C down and either it will go up from (wave C finished) here or only down a bit more after a period of consolidation (in wave iv of wave C).
Blue: We are somewhere in wave 3 down in the 5 wave correction to complete corrective wave A before a rally followed by a deep drop.
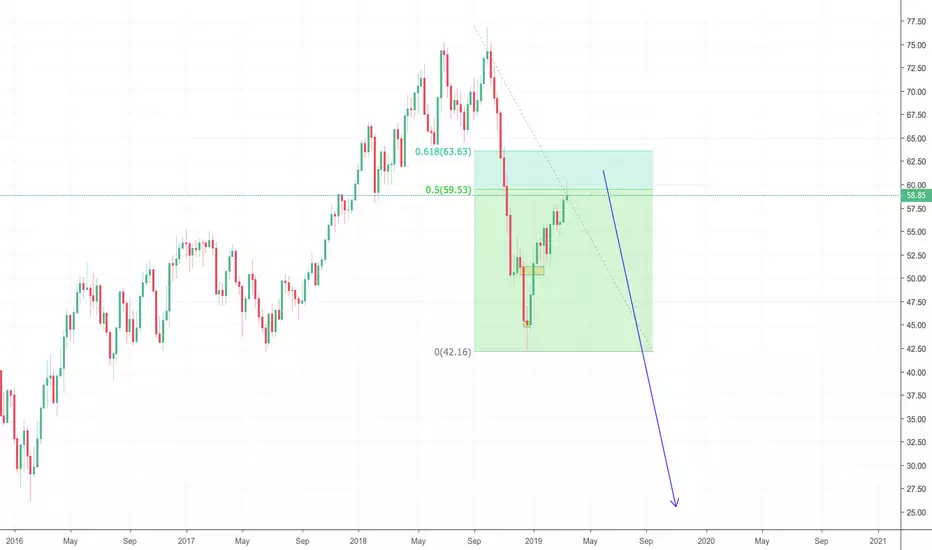
Best-case scenario: As we saw in late September, when the drop starts, it will not be held up for anything and the smaller-scale wave count quickly became unworkable as the price drop blew through all short-term estimates / predictions. My best case scenario is for the price to head directly for sub$32 a barrel to complete a 1:1 extension of a larger degree corrective wave ($77 to $42 Sept to December 2018) to complete the correction. If that happens I would look for exposure to commodity index funds as they tend to be significantly exposed to the energy sector (and the only way to go from there would be up).
As always, the count will end up to be different as events unfolds but I hope it continues down.
Why do I think its going down? I think growing indications of a global slow-down is overcoming the reductions in supply (as happened last year as well).
Buying Commodity Currencies vs JPY ... the Fade DealI am fading the Tweet yesterday as a US-China trade deal is around the corner. I expect the final summit to come in late May. A trade deal will be enough to support the recovery in China and Europe. From a markets perspective, the deal is now mostly priced into Equities giving a very typical “trade the rumour” and “fade the fact” opportunity. Whilst on the FX board, a deal will support commodity currencies notably AUD, NZD, CAD and NOK .

XOM: Consolidating as oil prices rise, watch for pro tradersXOM is in a consolidation as oil commodity prices are rising. This offers incentives for pro traders to enter ahead of any HFT activity. The bottom has some buybacks in the candlestick structure as well. The goal is to generate speculation among the retail crowd.

USOIL POTENTIAL SHORT (WATCH FOR IT) USOIL HAD A VERY SIGNIFICANT DROP IN PRICE IN THIS COMMODITY STARTING IN OCTOBER OF 2018. AS YOU CAN SEE OIL PRICES HAVE BEEN TRYING TO RECOVER BUT HAS BEEN A VERY WEAK ATTEMPT BY THE BUYERS. KEEP AN EYE ON THIS PAIR TO SEE IF THE SELLER MOMENTUM COMES BACK IN, PARTICULARLY AROUND THE 50-60% REST LEVELS. KEEP AN EYE OUT!
REMEMBER TO ALWAYS USE PROPER RISK IN YOUR TRADING. THIS IS ANALYSIS DONE BY MYSELF AND SHOULD BE TRADED AT YOUR OWN DISCRETION. THE SETUPS POSTED ON HERE ARE NOT GUARANTEED TO WIN OR MAKE YOU MONEY.
PLEASE LIKE AND FOLLOW MY PAGE FOR MORE PROFITABLE TRADE SETUPS! CHEERS!
Have a coffeeThe Coffee and the dollar
The price is above a key support zone, between approximately 96.4 and around 95, it fails to recover because exports are in sharp decline as the currencies of the exporting countries are affected by this devaluation against majors like the US dollar, tending to limit sales so as not to lose too much. All of this, has caused exports fall from the country that produces the most (Vietnam) by almost 40% compared to January (customs data published in the session on Friday). So this is a commodity that is particularly affected by the weight of the US dollar: the USD should continue to strengthen during 2019 (especially the second half), it is likely that coffee will continue to remain weak (except for sudden changes in the supply/demand ratio ). Now technically, however, it could be a good entry into this area (97) with a short-term target towards 104. A closure below 95, will ensure that the descent continues until new period lows.

Uranium, A Closer Look at the Commodity PriceA few days ago I put out analysis on the Uranium miner ETF AMEX:URA . This ETF is probably the best way to get involved in the Uranium price action and stay diversified. But I wanted to take a look at the commodity price, as this will be the driver of new and existing mines opening up and miners increasing their profitability. The price can also give insight to whether the public is ready to start demanding Uranium and increase it's use as an energy source.
If you're looking for a more detailed article on Uranium, you can visit AssetGuild.com .
But here on TradingView, we will focus specifically on price.
The price of Uranium has been in a deep depression for 11 years. It safe to say it might be the most hated market in existence. This fact alone is why I'm giving it a closer look. Overall, the price is down 80% since it's highs.
What's worth noting, is that UX1! has broken out of a long existing triangle pattern and is looking like it might be in the process of forming a bottom.
Uranium has been quickly breaking above it's moving averages and holding healthy support on the 100 and 200 MA.
The 100 has now crossed the 200 as well.
We are now making new 2 year highs which is a promising note. The key here is that price holds support around the $26 range and on it's moving averages.
Though volume is still low, this price action may be a signal for interest coming into the Uranium space.
Feels good to be watching things develop at such an early stage.

Iron ore futures contracts have reached two-year highsIron ore futures contracts have reached two-year highs driven by a dam collapse at a Vale mine in Brazil. The work of the mine was suspended, which affects the volume of supply in the market.
Such an accident is difficult to fix in a short time, and the market agrees. We see it in the prices of long term futures contracts.
Since the accident, the rise in the value of futures contracts amounted to
From 18% to 24% on the NYMEX
From 10% to 15% on Dalian Commodity Exchange in US Dollars

XAUUSD POTENTIAL SHORT OPPORTUNITY (1D&4H) XAUUSD POTENTIAL SHORT OPPORTUNITY
I had been long in XAUUSD a few weeks ago after a decent buyer momentum move was shown to the upside on the daily time frame. After letting this momentum play out I was watching this commodity and its price seeing the buyers slowing down on the 1D timeframe chart and noticed that some seller strength was coming in. The market was showing me that the buyers were dying out and that seller interest and momentum was stepping in. After watching a price squeeze (AKA WEDGE PATTERN) on the daily timeframe play out and break to the downside it confirmed my bearish thoughts on this pair. Let's dive into it.
1D CHART:
* on this timeframe price was at market highs and was showing signs it was overextended
* the buyers had been slowing down and seller momentum started to kick in
*there was a break of the squeeze of price action to the downside, market confirming a possible bearish move
*price is overextended and showing it is more likely to make a move to the downside then to the upside
4H CHART:
* use this timeframe to get a more specific glance at what the market is trying to show us
*make sure price holds beneath the wedge on the timeframe so it is not a fakeout
*use this timeframe for good risk/reward setup as well as precise entry and exits
MAKE SURE TO ALWAYS USE PROPER RISK MANAGEMENT WHEN TRADING. NOT EVERY TRADE IS GUARANTEED TO SUCCEED AND IT IS IMPORTANT TO BE PREPARED FOR THE WORST CASE SCENARIO. NEVER RISK MORE THAN 2% OF YOUR WORKING CAPITAL PER TRADE TO PREVENT BLOWING YOUR ACCT. AND BEING ABLE TO TRADE MORE LONG TERM.
CHEERS!

DBC - More Odd Charts - Commodity Drop Underway?Crude oil has been getting absolutely walloped for weeks now, having lost over a third of its value recently. Looking at the chart of USOIL I recently posted, it seems to me we are definitely primed for a bounce. The bounce will ultimately fail, but we’re really, really oversold at this point.
One thing I noticed is that the commodity ETF, symbol DBC, has actually cracked the channel which has been in place for years. Like I said above, I think oil will bounce, but I wouldn’t be surprised to see DBC hit resistance in the form of that now-broken channel.
DBC is the basket of commodities

WTI Crude Oil Daily Chart Analysis 11/8Technical Analysis and Outlook
Crude Oil has at this point moved into completion Oil Dip $61.40 and approached what should be a significant Mean Support $59 (Stage 3), so there is a likelihood that at least a portion of the latest harm might be mitigated with a swift bounce. A decline below $59, though, and we might then find a retracement all the way down closer to $55 (Stage 4) and Major Key Support $49 (Stage 5). (See 'Commodity Market' for full Crude oil Market Commentary).

XAUUSD (GOLD) POTENTIAL LONG OPPORTUNITY GOLD POTENTIAL LONG
After this recent week of market activity the commodity market had displayed a strong buyer interest move on Gold. After looking at the daily timeframe chart you can see that price had been holding around the lows since early August of this year. After some time this last week the market had shown strong buyer interest based on the strength of the buyer breach above the significant levels around 1206. After seeing this strong move made by the buyers it had caught my interest and had allowed me to build a possible trading scenario based on that. ALSO A TIP TO INCREASE BIG PROFITS, when looking for significant structure a HUGE tell sign if its a significant level is the strength of the BREAKOUT. ALSO; how do we know if it's a breakout ? THE STRENGTH OF THE BREAK. I usually don't give such profitable tips for free but these two concepts will really allow you to increase profits and your trading probabilities. So, lets dive into it !
1D Chart:
* on this time frame the buyers displayed a strong break above the multi-month structure level around 1206
*the momentum showed me first off they're interest in this pair, because they created a significant break, as well as its more probable for the next move to be to the upside then to the downside
*watch for a weak pullback on the daily time frame and a hold of a price to confirm the breakout and buyer control
4H Chart:
*on this time frame look for a weak pullback into the multi-month structure level
*look for strong buyer interest again around 1206 to confirm the buyer interest in this pair
1H Chart:
*use this time frame for a good risk/reward ratio
*watch for strong buyer interest also on this pair around 1206
