fbc//@version=5
indicator('⫷⫸ FBC Setup ⫷⫸ ', overlay=true)
// Calculate the conditions for the bullish candlestick setup
isBullishSetup = close > open and open < open and close < close and close > close and low < low and low < open
// Plot a shape and label when the bullish candlestick setup is detected
plotshape(isBullishSetup, color=color.new(#42e9ff, 0), title='Bullish', style=shape.labelup, location=location.belowbar, text='Bullish', textcolor=color.new(#000000, 0))
// Plotting a background color to highlight the pattern
bgcolor(isBullishSetup ? color.new(#4c9baf, 90) : na)
// Calculate the conditions for the descending candlestick setup
isDescendingSetup = open > close and open > open and close > close and close < close and high > high and high > open
// Plot a shape and label when the descending candlestick setup is detected
plotshape(isDescendingSetup, color=color.new(#ff3ea5, 0), title='bearish', style=shape.labeldown, location=location.abovebar, text='bearish', textcolor=color.new(#000000, 0))
// Plotting a background color to highlight the pattern
bgcolor(isDescendingSetup ? color.new(#ff52cb, 90) : na)
Search in ideas for "PLOT"

Box and Squeeze Strategy - Darvas InspiredDescription
The "Combined Box and Squeeze Strategy" is a comprehensive trading script developed for the TradingView platform. It merges two distinct analytical approaches: "The Box Percent Strat" and "Squeeze Box ," offering traders a multifaceted tool for market analysis.
Key Features
Box Percent Strat: This component of the strategy dynamically adjusts trading boxes based on price movements. The top and bottom of the box are recalculated as the market evolves, providing visual cues for significant price levels.
Squeeze Box : Focused on volatility and market squeeze, this part of the strategy utilizes Bollinger Bands and a custom Moving Average calculation. It identifies periods of low volatility (squeeze) and plots high and low squeeze box levels, aiding in the identification of breakout opportunities.
Dynamic Moving Average Calculation: The script includes various options for moving average calculations, such as EMA, SMA, WMA, VWMA, and more. Users can select their preferred type, which is then integrated into both the box calculations and squeeze analysis.
Trading Signals: Entry and exit points are suggested based on the strategy's logic, which combines box breakouts and moving average trends. These signals can be used to inform trading decisions in conjunction with a user's existing strategy.
Visual Plotting: Key levels, including box boundaries and moving averages, are plotted directly on the chart, making the analysis straightforward and visually accessible.
Usage
Ideal for various markets and timeframes.
Can be customized to fit individual trading styles by adjusting input parameters.
Should be used in conjunction with proper risk management strategies.
Disclaimer
This script is provided for educational purposes and should be tested thoroughly in a simulated environment before being applied to live trading. Users should trade based on their discretion and understanding of the financial markets.

BTC overdue for a Correction but Bull Run NOT done yet?Part of my ongoing analysis of Bitcoin movements ( see links below ).
As usual, BTC has gone higher then expected, and will probably drop lower than desired.
But this bull run ha shown a strong structure and a methodical rise with plenty of retests.
We can expect a significant retrace but probably not a crash (famous last words, right?)
The velocity and momentum of the parabolic move suggests a "wave 3".
It is highly likely that our wave 3 is done, or is very close to completion.
If so, we should look for a wave 4 to retrace, and then a wave 5 finish.
Plotted are 3 possible paths, Blue most likely, Green for Bull, Red for Bear.
The EW pathways are mere GUESSES, but the zones are SOLID and will react.
Reactions at each of the support zones should provide clues of the strength.
Some of the zones are quite "tall" in this preliminary plot.
As price moves, I will update fined tuned zones of interest.
Hit "follow" on this idea to receive notifications of updates.
9928 - 10k might have psychological support for a bounce.
9638 - 9711 is the minimum expected retrace target.
9025 - 9105 is essentially Bulls Last Stand, must hold.
.
My previous charts catching every key turn and giving early warnings (click the links below):
9.7k Bounce <= mapped within $10
10k Targetted
9.4k focussed target
8.2k to 10k wave 5
9k barrier Foretold <= Warning in Time
8k ReBag in HiRes
8475 Top Call <= Mapped within $5
Sub 7k Foreseen
Big Picture Fibs <= the 3 Fibs of Life
7800 Dump Warning
7080 Rocket Foreseen <= within 20 cents!
14k target call <=Perfect TP
10k target call
3.1k bottom call <=EXACT 2018 bottom
Of course, I have had total FAILS on some ideas too, not going to pretend.
But all of my plots show PRECISE entries, TIGHT stops, and EXACT targets.
Precision is the way of the Fib. Almost every turn happens at a Fib Line.
.

EUR.USD Shorts hit targets and Longs in play: EU Bounce WatchFollow up to my previous Analysis Plotting the recent bottom (click) .
EU has been cascading downward and we caught most of it.
It hit our targets PERFECTLY and Bounced so we flipped long.
Now expecting an "ABC" style retrace (bounce) for next move.
See some of my other Forex calls below.
I also plot Crypto and some Stocks, check my Profile Page .
Currently in play:
NZD.USD bounce watch
EUR.USD short to long
USD.JPY short to long
Recent Achievements:
NZD.USD bounce Call (massive profit, no drawdown)
EUR.USD bounce plot (found last bottom)
EUR.USD short Call (perfect top, huge profits)
EUR.USD trend Short (the very tip-top a year ago)
USD.CAD short call (perfect entry, huge profits)
GBP.USD scalp zones (pinpoint Entries/targets)
GBP.USD dip Call (just in time, quick 70 pips)
DXY toping call (Upthrust warning just in time)
USD.JPY short to long (recent perfect entries)
AUD.USD trend Short (perfect short a year ago)
XAU.USD top call (exact top pegged)
XAU.USD to $1367? (caught most of the spike)
XAU.USD bounce call (perfect entry, huge profits)
XAU.USD long to short (recent perfect entries)
Silver Bounce scalp (Perfect entry, still in play)
Copper Bounce call (Prefect entry, almost done)
SPX recent top (Fib extensions at work)
Of course, I have had total FAILS on some plots also, not going to pretend.
But my plans offer PRECISE entries, TIGHT stops, and EXACT take profits.
Precision is the way of the Fib. Almost every turn happens at a Fib Line.

BTCUSD hit targets and pulling back: Bitcoin Support ZonesQuick plot to map nearby Support Zones.
BTC completed a 5-wave Impulse move per my last plot.
We might now be painting the requisite ABC correction.
The plotted EW is a guess, but am confident in the zones.
It is possible that the green 3.618 will bounce it.
Also, green 3.236 near blue 1.618 should react well.
Most likely is a retrace to around wave 4 end point.
11.4k bounce would the most Bullish scenario.
11.1k test should be the most Likely scenario.
10.9k test would be the lowest Acceptable bull.
Part of my ongoing Bitcoin analysis (click):
12k Impulse map
12k arget call
14k > 10k retrace
14k target call <=Perfect
10k target call <=6 wks ago
8.4k > 5.4k retrace
9.0k > 7.5k retrace
7.5k bounce Call <=Perfect
10k path laid out
10k final Leg
3.1k bottom call (caught the EXACT bottom)
Of course, I have had total FAILS on some ideas too, not going to pretend.
But all of my plots show PRECISE entries, TIGHT stops, and EXACT targets.
Precision is the way of the Fib. Almost every turn happens at a Fib Line.
.

XAUUSD retrace UPDATE: Gold to retest 1400 nowUpdate to my ongoing analysis of Gold (see links below).
So we topped exactly at a strong resistance zone previously plotted.
After hitting the top we saw immediate profit taking, but no bears.
Until late in US session when Fed Govs clarified rate cut possibilities.
The downward momentum was already in place when the news came out.
That news caused an immediate dip, auto-rally bounce, and now resuming.
Lets see how much premium was based on a 50 bps rate cut. (now 25 bps).
1411 might still cause a stall or small bounce.
1405 looks highly likely to be reached soon.
1400 retest is probable and would make sense.
Previous Gold Analysis:
$1439 top call
$1332 bounce
$1320 top Call
$1270 bounce
$1280 break
$1380 Targeted <= 4 mos ago
See some of my other Forex calls below.
I also plot Crypto and some Stocks, check my Profile Page .
EUR.USD long call (scalp that ran hard)
USD.CAD top Call (warning just in time)
EUR.USD top Call (perfect top, still in play)
GBP.USD dip Call (just in time, quick 70 pips)
Silver Bounce scalp (Perfect entry, still in play)
DXY topping call (Upthrust warning just in time)
SPX recent top (Fib extensions at work)
XAU.USD long to short (recent perfect entries)
USD.JPY short to long (recent perfect entries)
EUR.USD long term Short (the very tippy-top a year ago)
AUD.USD long term Short (almost at a long term target now)
Of course, I have had total FAILS on some plots also, not going to pretend.
But my plans offer PRECISE entries, TIGHT stops, and EXACT take profits.
Precision is the way of the Fib. Almost every turn happens at a Fib Line.

Bitcoin buy and sell patternsUsing 4hr timeframe on Bitcoin using Swinger script. The price is steady during the green plots and falling during the red plots. Good time to buy during the green plots of indicator, sell when it becomes red on plot.

Bitcoin Trends: Identifying Bullish and Bearish Signal.Hello Trading View Community,
From soaring to record highs to suddenly dropping over 10%, Bitcoin (BTC) has been full of surprises. Today, let's dive into this rollercoaster ride, exploring the twists and turns of Bitcoin's recent price movements and what might lie ahead.
Bear Divergence in RSI and Price Action 📉
Our journey starts with a notable bear divergence on BTC's daily chart. Here's the scene: Bitcoin prices reaching for the stars while the RSI, our trusty sidekick, decides it's not quite ready to leave the ground. This divergence signals a potential cooldown or reversal on the horizon, suggesting the latest rally might need to catch its breath.
What Does the Trend Say? 🔄
Rewind to October, when our trend-finding indicator flashed a bright Long signal, setting the stage for the rally that led to January's highs. This beacon was a trader's dream, but like all dreams, a wakeup call—marked by today's shift, as spotted by our dot plotter—suggests a moment of pause or a plot twist in Bitcoin's saga.
Plotting the Dots... 📍
Our dot plotter, straightforward yet insightful, has begun signaling a change in momentum, suggesting the party might be winding down. It's like the DJ switching from high-energy beats to a slow jam, hinting it's time to pay attention to the changing vibes.
EMA's to the Rescue? 🛡️
Zooming into the EMAs, we see Bitcoin comfortably above our 21 EMA (the one in pink), keeping the bullish spirit alive. However, it's a delicate balance; staying above this line could mean this is just another one of Bitcoin's famed quick corrections.
Wrapping It Up... 🎬
Considering the bear divergence in RSI and the signals from our custom indicators, a bit of caution could go a long way. The journey since October has been lucrative for those who followed the Long signals, but the road ahead seems uncertain. The convergence of our analysis suggests it might be time to brace for a potential short-term shift.
For enthusiasts hoping to see Bitcoin's ascent resume, the key is to stay vigilant with the charts in the coming days, with a keen eye on the weekly close. This current dip may very well be one of Bitcoin's classic corrections that prelude a continued upward trajectory. Yet, caution remains the word of the day.
As we navigate this uncertain terrain, the descent of Bitcoin will have us closely monitoring for a close below the 21 EMA, signaling a potential shift in strategy. A new Short signal could then emerge as our beacon, guiding our next moves in this ever-evolving saga of Bitcoin trading.
Thank you for joining me on this analysis. If you've found it helpful or entertaining, a "Like" or "Follow" would be much appreciated.
Trade wisely, and remember, these insights are here to aid your journey, not dictate it. These are just ideas, not trading advise...

Time to forecast the quick run upIn addition to wave theory I have developed a line theory of sorts. I draw lines based on only two points to judge support, resistance, or potential trends. I personally do not call things a trend until 3 occurrences are observed so marking these lines based on two points are not a trend. I draw the following:
Red lines = Beginning of wave 1 to top of wave 2 generally contains entire impulsive wave.
Green lines = End of wave 3 of 1 to end of wave 5 of 1 generally gets end of wave 5 of 3.
Yellow lines = Beginning of corrective wave (A1) to end of wave C3 generally gets end of corrective wave (C5).
Blue lines = End of Micro 2 to end of Macro 2 or 4 confirms end to macro impulse.
White lines = End of wave 2 to end of wave 4, break beyond confirms impulse is over.
I have remained in the camp of still being in Intermediate wave 5 down for at least a few more weeks, but some of the Line Theory above along with Elliott Wave Theory has me thinking otherwise. There are two main reasons I believe Cycle wave A has likely ended.
1 - Some Elliott Wave (EW) theorists hold that Wave 4 cannot go into the same realm of Wave 1 which has now occurred as of Friday. Intermediate wave 1 ended with a bottom of 3886.75. While this level remained a solid resistance, it was broken on Friday and Intermediate wave 4 is now above it. While this is a principal or rule of EW theory to some, I have seen these broken multiple times in my studies that otherwise kept waves intact and I do not give strong consideration on its own.
2 - Two major breaks with my light blue lines. Minor 2 inside of Intermediate 1 to Intermediate 2 was broke on October 25. This would confirm the current impulse has ended. Second, the light blue lines from a micro 2 to a macro 2 or macro 4 are always downward when that is the direction of the trend Minor 2 inside of Intermediate 3 to the current position (assuming end of Intermediate 4) is nearly flat while barely downward in the moment. This is stemming from the Minor 2 top at 3907.07 to the current top of 3905.42. Monday will likely tip this line upward.
Here is the chart of my old theory with the two violations. If we are still in Cycle A and Intermediate wave 4, we have retraced 65.93% of Intermediate wave 3’s movement which puts this into the final quartile based on historical data.
New Theory - Cycle B
The only two things I do not like about this theory is that Intermediate wave 5 inside of Primary 5 would have been quite short at only 6 days. Granted this tied the all-time minimum length so its not impossible. Secondly, my early top estimates are around 4600, however, our recent gains have us moving so fast that we could hit that mark well ahead of schedule. Granted we will swing up in Primary wave A, down in B and then back up to our final top during wave C.
I plotted out the full length of the bear market back on July 4th ( ). At that time I forecasted the length to be around 813 from start to finish which would place the bottom around March 2025. I also plotted the bottom in October this year and next major top in the summer of 2023. On August 20th, I broke down what a bear market over 813 trading days would look like based on historical wave lengths and relationships ( ). Cycle wave A is was estimated to last around 25% of the length of Supercycle wave 2. This would place Cycle wave A ending around October 18th. As of now, the bottom was October 13th, which is only 3 trading days earlier than estimated. This implies the bear market bottom remains on track for around March 2025 for now. If we are in Cycle wave B now, this would mean the market is in Sub-Millennial wave 1, Grand SuperCycle 5, SuperCycle 2, Cycle wave B and most likely Primary A, Intermediate 1, Minor wave 4. The full short reference to this point is 152BA14. Total stats for Cycle wave A had it begin at 4818.62 on January 4, 2022. It ended 195 trading days later at 3491.58. By October 13, 2022, the market had dropped 1327.04 from top to bottom which was a loss of 27.54%.
Projection for Cycle wave B: Gain 1108.42 points over 190 days.
LENGTH: Based on waves ending in 152B, the models weakly forecast the full length of Cycle B to last 29, 39, 65, 143 or 223 days in length. 142 days is near early summer estimates around May 10, 2023 while 223 days lines up with the late summer 2023 estimate near September 5. Based on waves ending in 52B, the same lengths are possible with the addition of 117, 146, and 165 days. The most model agreement is 195 days which would tie the length of Cycle A and end around July 26, 2023. Lastly, waves ending in 2B provide strongest model agreement at 98 days (March 23, 2023) followed by 195 days again. Waves ending in 52B tend to comprise 21-27% of the wave they reside inside. If the overall larger wave is around 810 days (new target based on Cycle wave A length), 21% could make Cycle wave B 170 days long while 27% is 218 days. Even though waves ending in 152B rarely last the same length or longer than the wave A that precedes them, I will place the estimate at 190 days for now.
GAIN: Based on waves ending in 152B, the first quartile of movement retracement of wave A is at 51.30% while the median retracement is 71.43% and third quartile is 72.07%. Wave B has retraced 113.17% of wave A before which would present new all-time highs for the index if that occurred here. Waves ending in 52B have a first quartile retracement of 67.02%, median at 81.39% and third quartile of 94.28%. Lastly, waves ending in 2B have a reduced first quartile at 58.61%, median at 76.51% and third quartile of 88.81%.
FORECAST: For now, I am projecting a top around 4600 by mid to late July 2023. This would be a gain of 1,108.42 points, or 31.75% off the bottom, in nearly 190 days. Based on these projections I am plotting Primary wave A and wave B at the following locations.
PRIMARY WAVE A tends to contribute 12.5 – 61.93% to the length of the overall wave it resides inside. With an overall projection at 190 days, this could make Primary wave A 22 – 117 days long. The first quartile is 23.77%, median is 35.19%, and third quartile is 52.91%. That equates to day lengths of 45, 67, and 100 respectively. Wave As in generally account for around 25% of the waves the reside in. We will bump the estimated length to around 50 days which aligns with the final trading day before Christmas. The movement tends to contribute 24-156% of the overall move with the first quartile at 49.86%, median at 73.33% and third quartile at 89.84%. These find levels could place the next market top in 2022 at 3756.60 (already past), 4044.29, 4304.38, 4487.44, and 5223.26. At the breakneck pace the market has travelled in two weeks, a top around 4375-4430 is most likely.
PRIMARY WAVE B tends to contribute 8 - 50% to the length of the overall wave it resides inside. The potential lengths based on the minimum, quartiles, and maximum would be 15, 24, 41, 60 and 95 days long. Additional datapoints can provide more numbers when considering the historical relationships between waves A and B. Wave A tends to be at least twice the length of wave B pitting the potential median length of this wave B near 22 days long. When considering the first quartile relationship wave B could be longer at 66 days. There is a Federal Reserve meeting at the beginning of February which would be approximately 25 days into wave B and another in late March at 59 days into wave B. We will plot the bottom of B at the latter meeting for now as the Federal Reserve should be able to see some inflation improvement from the 2022 rate hikes and the legislative agenda of a new Congress. Wave B’s movement is likely to make up 18-45% of the larger wave which would take it to roughly today’s trading prices. Coincidently, in March 2023 this would be around the market’s current resistance line. The line that began at the beginning of the bear market with the second point at the end Primary wave 2 is roughly the same as the line from the end of Primary wave 2 and Primary wave 4. These have been resistance lines for the market thus far, but once we break above them, they are likely to become new support levels. This would see wave B lose about 600 points or 13% over 59 days in the first quarter of 2023.
These dates and levels will change as more data comes in from Primary wave A and line theory is plotted as well.
The final set of projections will be the intermediate waves inside of Primary wave A.
Wave 1 could last 5-10-13 days based on the quartiles and it is currently at 11 days. I project it to currently be in the final leg of Minor wave 5 with the Federal Reserve likely being the top and end of Intermediate wave 1 at 14 days long. The quartiles could deliver Intermediate wave 1 gains of 280-336-677 points. So far we have gained 413.84 which is above the median and we are not done yet. 677 points is possible placing the top around 4168 which is another 200 points up over 3 days. However, my line theory could place the top around 4030 which is just over 100 points from Friday’s close. Early guess is folks believe the Fed is taking a breather while my analysis is telling me they are about to do something unexpected set to temporarily shock markets.
Wave 2 could last 1-4-5-8-17 days based on minimum-quartiles-maximum. The ratio of wave 1 length to wave 2 narrows the field to 2-5-11 days long. I will plot it around 5-6 days for now. The market could be looking at a drop of 172-220-358 based on the quartiles for movement inside of the larger wave while movement based on 1:2 ratios points at quartiles of 295-367-452. I will plot around a 330 drop for now. This places the bottom the day after election day. The market will likely rejoice if there is guaranteed gridlock in Washington. This is a perfect place to begin an expansive wave 3 rally.
The data gets looser the more estimated variables deeper we get so I won’t get too specific yet. Based on contribution to larger wave, wave 3 could last 8-14-19-22-27 days. Based on relationship to wave 1 it could last 7-16-23-35 days and based on it relationship to wave 2 it could last 9-33 days. I will plot it around 17 days for now. CPI release would be 23 days deep so that is something to consider as well. The gain could take us up near 4300.
Wave 4 could see a drop down toward 4100 over 5 days before wave 5 finishes out Primary A before Christmas.
Ultimately the run up will not be close to sustainable which will finally force everything down where it belongs. The billionaires stating the economy is not in a good position will be correct soon, but lets enjoy the run up while we can.

Mostafa//@version=3
//
study("yek scalper", overlay=true,shorttitle="yek scalper")
//
// Reference:
//
// === INPUTS ===
//
ShowPAC = input(true, title="Show wave")
ShowBarColor = input(true, title="Show Coloured GRaB Candles")
ShowTrendIndi = input(false, title="Show Trend Indicator")
PACLen = input(50,minval=2,title="EMA ")
src = input(close,title="Source for Wave centre EMA")
// --- CONSTANTS ---
DodgerBlue = #1E90FF
// === /INPUTS ===
// Constants colours that include fully non-transparent option.
green100 = #008000FF
lime100 = #00FF00FF
red100 = #FF0000FF
blue100 = #0000FFFF
aqua100 = #00FFFFFF
darkred100 = #8B0000FF
// === SERIES SETUP ===
// Price action channel (Wave)
pacLo = ema(low, PACLen)
pacHi = ema(high, PACLen)
// === /SERIES ===
// === PLOTTING ===
//
// If selected, Plot the Wave Channel based on EMA high,low and close
L=plot(ShowPAC ?pacLo:na, color=black, linewidth=1, title="up",transp=20)
H=plot(ShowPAC ?pacHi:na, color=black, linewidth=1, title="down",transp=20)
fill(L,H, color=gray,transp=92,title="Fill Channel")
// Colour bars according to the close position relative to the PAC selected.
bColour = close>=open? close>=pacHi? green : close<=pacLo? darkred100 : yellow : close>=pacHi? green100 : close<=pacLo? darkred100 : yellow
barcolor(ShowBarColor?bColour:na, title = "Bar Colours")
// Show trend direction indication on the bottom
wcolor = high>pacHi and low>pacHi? lime : low

Pine editor//@version=3
//
study("yek scalper", overlay=true,shorttitle="yek scalper")
//
// Reference:
//
// === INPUTS ===
//
ShowPAC = input(true, title="Show wave")
ShowBarColor = input(true, title="Show Coloured GRaB Candles")
ShowTrendIndi = input(false, title="Show Trend Indicator")
PACLen = input(50,minval=2,title="EMA ")
src = input(close,title="Source for Wave centre EMA")
// --- CONSTANTS ---
DodgerBlue = #1E90FF
// === /INPUTS ===
// Constants colours that include fully non-transparent option.
green100 = #008000FF
lime100 = #00FF00FF
red100 = #FF0000FF
blue100 = #0000FFFF
aqua100 = #00FFFFFF
darkred100 = #8B0000FF
// === SERIES SETUP ===
// Price action channel (Wave)
pacLo = ema(low, PACLen)
pacHi = ema(high, PACLen)
// === /SERIES ===
// === PLOTTING ===
//
// If selected, Plot the Wave Channel based on EMA high,low and close
L=plot(ShowPAC ?pacLo:na, color=black, linewidth=1, title="up",transp=20)
H=plot(ShowPAC ?pacHi:na, color=black, linewidth=1, title="down",transp=20)
fill(L,H, color=gray,transp=92,title="Fill Channel")
// Colour bars according to the close position relative to the PAC selected.
bColour = close>=open? close>=pacHi? green : close<=pacLo? darkred100 : yellow : close>=pacHi? green100 : close<=pacLo? darkred100 : yellow
barcolor(ShowBarColor?bColour:na, title = "Bar Colours")
// Show trend direction indication on the bottom
wcolor = high>pacHi and low>pacHi? lime : low

Reading the MarketsPlease have a look at the accompanying chart to see Money Man’s read on the situation. Money Man cannot believe he drew this, but that is what the plot is telling him now. What could he do but draw it? Hopefully, more data would cause adjustment to the chart. There is an election that should keep things calmer.
Picking up where we left off awhile ago, Money Man would like to test your tolerance to metaphors again while getting to another rule or lens to use, to look at the markets.
The markets are continually telling a story of cause and effect and the emotions of the perceptions on possible effects. It draws patterns and lines around these sentiments, building plots which lead to the reader forming bias as to the outcome of the impending climax. As you know, there is a whole field in technical analysis built around likelihoods of discernible patterns breaking up or down and by how much, reinforcing bias.
Stories have an exposition / the pattern and simply recognizing the start of this happening is an art in itself. Volume is normally the first to be pointed at as the volume sees a decline through the development of the pattern. Caution though; the first decline in volume could simply be the forming of a short-term pattern, leading into a longer term pattern, a good example would be a symmetric triangle morphing into a ascending triangle, (a plot, within a plot). An obvious pivotal area is ultimately reached, and a much-anticipated decision gets made or faked. This is where most chart readers are caught unawares as they have not been paying attention to the realm of rational possibilities, only focussed on the pattern and the advocated probable outcome to the type of plot. They are told that, for example, an ascending triangle has a 72% chance of breaking up (where does this number come from?). So logically traders stake accordingly and place their stop losses according to their staking and the pattern.
Money Man might not be liked for saying this, but this should not be thought of as an edge, and definitely not sold as one (please read the previous “On Edge” ed post for his view on edges). It logically cannot be that easy as per example, breakout trading, alone. If you are a breakout / chart pattern trader, you will have to refine beyond simply the pattern. Breakout trading is a strategy and not an edge which could lead to an edge. There is value to it, but it cannot be all of it as then most traders would quickly catch on and become consistently profitable (more on this in the PS).
Money Man often thinks about how whales can, in a fair amount of safety, inside the low volume of a pattern forming, move the markets with spoof buy and sell walls and strategic comparatively small trades, into strikingly obvious patterns. This would pull in enough interest, on the pattern edge / climax, to buy or sell big amounts – not a new idea and a well-known strategy. We all know that spoof orders and wash trading is real and exchanges, not eradicating it, should be avoided. He thinks arbitrage does not nullify but simply dampens the effects.
Back to the story: You cannot and should not attempt to pay attention to every instance in the story, if looking for rational outcomes and it takes many hours of market participation to start realizing what to note and how much weight it carries for how you trade. It is hard, but most people will bump into their own edge if determined and consistent. It is better to keep reading than to put the book down and then later find yourself at another chapter, frantically looking back trying to catch up with what happened. It is only okay over short periods and could benefit and make things clearer, but not so over long periods of time. So, Money Man is also not a fan of the use of market filters by beginner traders.
Conclusion: Reading the story rule: Do not read the market tick by tick, but still stay with it. Keep an eye out for the consistencies and plan for the worst, the best and everything rational in between. The more the plots change, the more the story stays the same. Simply filtering out the noise is already opening you up to finding your own edge. Very important to me: Please like if you appreciate the effort, please comment to develop this further and Please follow if you think this is leading somewhere that you might like to know about.
PS Money Man sees the fundamental reason for the existence of markets as distribution. This spills over into speculation markets too. This is probably the truth behind the zero-sum game view, but he does not agree fully as there is more to it). The edge to go fundamentally against the grain of a market (please read Hive Mind v Irrational Markets), and accumulate, will not be hidden in one indicator or pattern, because the market will seek out the inefficiency and nullify it. Money Man thinks that the 2% (or whatever) of traders who are consistently profitable is not the aim of a market, but a consequence of those 2% thinking differently to the rest (He has virtually in all ed posts offered different ways of viewing the market to call out the thought warrior in readers).

BTC bounce Update 4: correction to $6220 possible targetQuick post to map nearby zones of interest.
BTC topped as expect in last plot and now in retrace.
Thus far the retrace seems textbook ABC structure.
The turning points have been following fibs nicely.
$ 6220-28 is Minimum Expected for this pullback.
$ 6124-30 would be the next target if 6.2 breaks.
$ 6054-60 would be a scary but JUICY long entry.
Plotted EW wave is a GUESS, but the zones are SOLID.
Each zone will cause a reaction which is to be studied.
.
Previous Plots of this bounce:
Possible Bottom: $3850 Bottom Taggged
Bounce Update 1: $6950 top Plotted
Bounce Update 2: $5900 launch caught
Bounce Update 3: $6600 top Plotted
.
Older Plots catching every Major Turn:
9.2k Top Call
7.7k Retrace Target
10.5k Top call
9.7k Bounce <= mapped within $10
9k barrier Foretold <= Warning in Time
8475 Top Call <= Mapped within $5
Sub 7k Foreseen
Big Picture Fibs <= the 3 Fibs of Life
14k target call <=Perfect TP
10k target call
3.1k bottom call <=EXACT 2018 bottom

EURUSD big picture Fibs ending Draghi's rein: EU may bottom soonBig Picture plots of the important Fib sequences in play.
Drahgi's term as ECB President comes to an end soon.
This upcoming meeting and the next one are last steps.
Will Drahgi push the EURO towards its final destination?
Will Trump allow the EUR/USD cross to fall much lower?
Will LaGarde turn this monster Trend around next year?
1.25xx Top was spotted April 2018 in this plot (click) .
1.07xx Target was plotted in this plot on May 2018 .
1.09xx Support as since come into focus.
.
See some of my other Forex calls below.
I also plot Crypto and some Stocks, check my Profile Page .
EUR.USD short call (still in play)
EUR.USD bounce plot (found last bottom)
EUR.USD short call (in time, to the Pip)
EUR.USD long call (scalp that ran hard)
EUR.USD short Call (perfect top, huge profits)
EUR.USD trend Short (the very tip-top a year ago)
USD.CAD short call (perfect entry, huge profits)
GBP.USD scalp zones (pinpoint Entries/targets)
GBP.USD dip Call (just in time, quick 70 pips)
DXY toping call (Upthrust warning just in time)
USD.JPY short to long (recent perfect entries)
AUD.USD trend Short (perfect short a year ago)
XAU.USD $1555 top call (warning just in time)
XAU.USD long to short (recent perfect entries)
Silver Bounce scalp (Perfect entry, still in play)
SPX recent top (Fib extensions at work)
Of course, I have had total FAILS on some plots also, not going to pretend.
But my plans offer PRECISE entries, TIGHT stops, and EXACT take profits.
Precision is the way of the Fib. Almost every turn happens at a Fib Line.

Advanced Algorithm with Trend Detector Visit every aspect of the idea. Rocket Blast is using RSI levels.
The plotter detector for BULL RUNS and my algorithm plotter clearly show no sell signal.
My trend detector shows in advance which way the trend is headed. As of now, BITCOIN is in a downtrend, let's see how it unfolds.
Visit my trendlines with circles and key level.
Date range candles show almost the same movement, like halving, which aligns with my plots.

My Art of Trading with Risk Manager which reads BREAKOUT!Art of Trading
Length`: Defined period for calculating the moving average and pullback/breakout levels (default is 14 candles).
- `threshold`: Defined pullback/breakout sensitivity value
**Pullback & Breakout Calculation:**
- `pullback`: The lowest closing price within the lookback period plus the threshold value. This helps identify potential pullbacks.
- `breakout`: The highest closing price within the lookback period minus the threshold value. This helps identify potential breakouts.
**Plotting:**
- The moving average (`ma`) is plotted on the chart in blue.
- A triangle-shaped signal is plotted below the bar when the current price is below the pullback level, indicating a pullback (red triangle pointing up).
- A triangle-shaped signal is plotted above the bar when the current price is above the breakout level, indicating a breakout (green triangle pointing down).
- **Alerts:**
- If the price falls below the pullback level, an alert is triggered with the message "Pullback detected!".
- If the price rises above the breakout level, an alert is triggered with the message "Breakout detected!".
Risk Manager (I've retraced in order to show the red and green direction as price moves)
The "ForexX_Risk_Manager" indicator leverages historical price data and moving averages to provide a calculated safety level for trading decisions. By analyzing past extremes and smoothing the current risk level, helps traders navigate their forex strategies with a clearer understanding of potential risks.
Follow the risk manager: I've retraced RM and added red and green for guidance. As the trend moves up in color green, that's because the RM is moving down in color green. The same goes for red but in the opposite direction

TrendLine Indicator//@version=5
// Revision: 3
// Author: @CHIMKOO
// Strategy: Enter long when recent swing high breaks out, using recent swing low as stop level. Move stops up as higher lows print to act
// as trailing stops. Ride trend as long as it is there and the higher lows aren't breached.
// Conditions/Variables
// 1. Manually configure which dates to back test
// 2. Can add a filter to only take setups that are above (or below for shorts) user-defined moving average(s) (helps avoid trading counter trend)
// 3. Can ignore signals that are too extended and not consolidating enough based on ADR and/or RSI.
// 4. Color background of trades - helps to easily see at a glance if the strategy should be long or not.
// === CALL STRATEGY/STUDY, PROGRAMATICALLY ENTER STRATEGY PARAMETERS HERE SO YOU DON'T HAVE TO CHANGE THEM EVERY TIME YOU RUN A TEST ===
// (STRATEGY ONLY) - Comment out srategy() when in a study()
strategy('Breakout Trend Follower', overlay=true, initial_capital=10000, currency='USD', calc_on_every_tick = true,
default_qty_type=strategy.percent_of_equity, default_qty_value=100, commission_type=strategy.commission.percent, commission_value=0.1)
// === BACKTEST RANGE ===
Start = input.time(defval=timestamp('01 Jan 2019 06:00 +0000'), title='Backtest Start Date', group = "backtest window")
Finish = input.time(defval=timestamp('01 Jan 2100 00:00 +0000'), title='Backtest End Date', group = "backtest window")
// === USER INPUTS ===
pvtLb = input.int(defval=3, title='Pivot Lookback', minval=1, group = "support & resistance levels",
tooltip = "Number of bars to left and right to deterine local pivot.")
showPivotPoints = input.bool(title = "Show Historical Pivot Points?", defval = false, group = "support & resistance levels",
tooltip = "Toggle this on to see the historical pivot points that were used.")
currentColorS = input.color(color.new(color.orange,50), title = "Current Range S/R Colors: Support",group = "support & resistance levels", inline = "lineColor")
currentColorR = input.color(color.new(color.blue,50), title = " Resistance", group = "support & resistance levels", inline = "lineColor")
useMaFilter = input.bool(title='Use Current Timeframe Moving Average for Filtering?', defval=true, group = "moving average filters",
tooltip='Signals will be ignored when price is under this moving average. The intent is to keep you out of bear periods and only buying when price is showing strength.')
maType = input.string(defval='SMA', options= , group = "moving average filters",title='MA Type For Filtering')
maLength = input.int(defval=50, title='MA Period for Filtering', minval=1, group = "moving average filters", inline = "1ma")
ma1Color = input.color(color.new(color.purple, 60), title = " Color", group = "moving average filters", inline = "1ma")
useMaFilter2 = input.bool(title='Use Multi-Timeframe Moving Average for Filtering?', defval=false, group = "moving average filters",
tooltip='Signals will be ignored when price is under this moving average. The intent is to keep you out of bear periods and only buying when price is showing strength. Other timeframe allows you to use Daily moving average for higher level view of market strength.')
tfSet = input.timeframe(defval='D', title='Moving Average Time Frame', group = "moving average filters",
tooltip='Allows you to set a different time frame moving average to filter your signals by.')
ma2Type = input.string(defval='SMA', options= , title='MA Type For Filtering', group = "moving average filters")
ma2Length = input.int(defval=50, title='MA Period for Filtering', minval=1, group = "moving average filters", inline = "2ma")
ma2Color = input.color(color.new(color.yellow, 60), title = " Color", group = "moving average filters", inline = "2ma")
// === MOVING AVERAGE CALCULATIONS ===
// Declare function to be able to swap out EMA/SMA
ma(maType, src, length) =>
maType == 'EMA' ? ta.ema(src, length) : ta.sma(src, length) //Ternary Operator (if maType equals EMA, then do ema calc, else do sma calc)
maFilter = ma(maType, close, maLength)
maFilter2 = request.security(syminfo.tickerid, tfSet, ma(ma2Type, close, ma2Length))
plot(useMaFilter ? maFilter : na, title='Trend Filter MA', color=ma1Color, linewidth=2, style=plot.style_line)
plot(useMaFilter2 ? maFilter2 : na, title='Trend Filter MA', color=ma2Color, linewidth=2, style=plot.style_line)
// === USE RSI FOR FILTERING ===
// The idea here is that you want to buy in a consolodating range for best risk/reward. With the RSI filter, you make sure that the previous bars' RSI
// level is not overbought/overextended before deciding to take a position on.
useRsiFilter = input.bool(title='Use RSI for Filtering?', defval=false, group = "rsi filtering",
tooltip='Signals will be ignored if the RSI level is above a user-defined level for overbought. This allows the user to ensure they are not buying something that is too extended and instead focus on names that are consolidating more.')
rsiTf = input.timeframe(defval='', title='RSI Timeframe', group = "rsi filtering",
tooltip='Allows you to set a different time frame for RSI to filter your signals by.')
rsiOB = input.int(defval=70, title='RSI Overbought Level', minval=1, group = "rsi filtering")
rsiVal = request.security(syminfo.tickerid, rsiTf, ta.rsi(close, 14))
// === PLOT SWING HIGH/LOW AND MOST RECENT LOW TO USE AS STOP LOSS EXIT POINT ===
// Get High and Low Pivot Points
ph = ta.pivothigh(high, pvtLb, pvtLb)
pl = ta.pivotlow(low, pvtLb, pvtLb)
highLevel = ta.valuewhen(ph, high , 0)
lowLevel = ta.valuewhen(pl, low , 0)
barsSinceHigh = ta.barssince(ph) + pvtLb
barsSinceLow = ta.barssince(pl) + pvtLb
timeSinceHigh = time
timeSinceLow = time
//Removes color when there is a change to ensure only the levels are shown (i.e. no diagonal lines connecting the levels)
pvthis = fixnan(ph)
pvtlos = fixnan(pl)
hipc = ta.change(pvthis) != 0 ? na : color.maroon
lopc = ta.change(pvtlos) != 0 ? na : color.green
// Display Pivot lines
plot(showPivotPoints ? pvthis : na, color=hipc, linewidth=1, offset=-pvtLb, title="Top Levels")
plot(showPivotPoints ? pvthis : na, color=hipc, linewidth=1, offset=0, title="Top Levels 2")
plot(showPivotPoints ? pvtlos : na, color=lopc, linewidth=1, offset=-pvtLb, title="Bottom Levels")
plot(showPivotPoints ? pvtlos : na, color=lopc, linewidth=1, offset=0, title="Bottom Levels 2")
// == PLOT SUPPORT/RESISTANCE LINES FOR CURRENT CHART TIMEFRAME ==
// Use a function to define the lines
f_line(x1, y1, y2, _color) =>
var line id = na
line.delete(id)
id := line.new(x1, y1, time, y2, xloc.bar_time, extend.right, _color)
highLine = f_line(timeSinceHigh, highLevel, highLevel, currentColorR)
lowLine = f_line(timeSinceLow, lowLevel, lowLevel, currentColorS)
// === USE ADR FOR FILTERING ===
// The idea here is that you want to buy in a consolodating range for best risk/reward. So here you can compare the current distance between
// support/resistance vs. the ADR and make sure you aren't buying at a point that is too extended.
useAdrFilter = input.bool(title = "Use ADR for Filtering?", defval = false, group = "adr filtering",
tooltip = "Signals will be ignored if the distance between support and resistance is larger than a user-defined percentage of ADR (or monthly volatility
in the stock screener). This allows the user to ensure they are not buying something that is too extended and instead focus on names that are consolidating more.")
adrPerc = input.int(defval = 120, title = "% of ADR Value", minval = 1, group = "adr filtering")
tableLocation = input.string(defval="Bottom", options= , title = "ADR Table Visibility", group = "adr filtering",
tooltip = "Place ADR table on the top of the pane, the bottom of the pane, or off.")
adrValue = request.security(syminfo.tickerid, "D", ta.sma((high-low)/math.abs(low) * 100, 21), barmerge.gaps_off, barmerge.lookahead_on) // Monthly Volatility in Stock Screener (also ADR)
adrCompare = (adrPerc * adrValue) / 100
// == ADR TABLE ==
tablePos = tableLocation == "Top" ? position.top_right : position.bottom_right
var table adrTable = table.new(tablePos, 2, 1, border_width = 3)
lightTransp = 90
avgTransp = 80
heavyTransp = 70
posColor = color.rgb(38, 166, 154)
negColor = color.rgb(240, 83, 80)
volColor = color.new(#999999, 0)
f_fillCellVol(_table, _column, _row, _value) =>
_transp = math.abs(_value) > 7 ? heavyTransp : math.abs(_value) > 4 ? avgTransp : lightTransp
_cellText = str.tostring(_value, "0.00") + "%\n" + "ADR"
table.cell(_table, _column, _row, _cellText, bgcolor = color.new(volColor, _transp), text_color = volColor, width = 6)
srDistance = (highLevel - lowLevel)/highLevel * 100
f_fillCellCalc(_table, _column, _row, _value) =>
_c_color = _value >= adrCompare ? negColor : posColor
_transp = _value >= adrCompare*0.8 and _value <= adrCompare*1.2 ? lightTransp :
_value >= adrCompare*0.5 and _value < adrCompare*0.8 ? avgTransp :
_value < adrCompare*0.5 ? heavyTransp :
_value > adrCompare*1.2 and _value <= adrCompare*1.5 ? avgTransp :
_value > adrCompare*1.5 ? heavyTransp : na
_cellText = str.tostring(_value, "0.00") + "%\n" + "Range"
table.cell(_table, _column, _row, _cellText, bgcolor = color.new(_c_color, _transp), text_color = _c_color, width = 6)
if barstate.islast
f_fillCellVol(adrTable, 0, 0, adrValue)
f_fillCellCalc(adrTable, 1, 0, srDistance)
// Conditions for entry and exit
buyConditions = (useMaFilter ? highLevel > maFilter : true) and
(useMaFilter2 ? highLevel > maFilter2 : true) and
(useAdrFilter ? highLevel - lowLevel < adrValue : true) and
(useRsiFilter ? rsiVal < rsiOB : true) and
time > Start and time < Finish
// (STRATEGY ONLY) Comment out for Study
strategy.entry('Long', strategy.long, stop=highLevel, when=buyConditions)
// strategy.entry("Long", strategy.long, stop = buyLevel2, when = time > Start and time < Finish and high > maFilterCheck)
strategy.exit('Exit Long', from_entry='Long', stop=lowLevel)
strategy.cancel('Long', when=not(buyConditions)) // Cancels resting orders when new swing high is printed below filters.

Swing//@version=5
indicator("RSI 14 Golden Cross with Volume Break MA 20", overlay=true)
// Input parameters
rsi_length = input.int(14, title="RSI Length")
ma_volume_length = input.int(20, title="MA Volume Length")
// Get weekly data
weekly_rsi = request.security(syminfo.tickerid, "W", ta.rsi(close, rsi_length))
weekly_volume = request.security(syminfo.tickerid, "W", volume)
weekly_ma_volume = request.security(syminfo.tickerid, "W", ta.sma(volume, ma_volume_length))
// Check for RSI golden cross and volume break MA 20
rsi_golden_cross = ta.crossover(weekly_rsi, 50)
volume_break_ma = weekly_volume > weekly_ma_volume
// Plotting signals
plotshape(series=rsi_golden_cross and volume_break_ma, location=location.belowbar, color=color.green, style=shape.labelup, text="RSI GC + Vol Break MA 20")
// Plotting RSI and volume for reference
plot(weekly_rsi, title="Weekly RSI", color=color.blue)
plot(weekly_ma_volume, title="Weekly MA Volume", color=color.red)

Nifty Important levels and trade plan for Monday, 28th NovemberIn Daily time frame Nifty is bullish, and we may expect a pause in this uptrend in coming days, before continuing the same trend. So, in coming days, we may expect to see a downside corrective move in Nifty and in 75 minute time frame a double top and a divergence in RSI is supporting the same statement.
Now based on Nifty price action, plotted some important levels for tomorrow, but support levels may change if Nifty breaks the PDH, in that case new support levels need to be plotted.
Here for tomorrow, we may avoid to trade between, 18521 and 18480, and for low risk taker the lower side of this range will be 18449.
Here for tomorrow, we will have to be careful with the upside moves, above 18521 it is bullish trade, but we need to wait for a proper price action, Similarly, below 18480 or 18449 it is a bearish trade, and can wait for a price action in 15-minute time frame for this trade.
For upside- 18597 and 18681 will be the target levels, and for downside 18407 and 18359 will be the levels of importance.
For next week, CPR is quite wide, so we may expect a sideways move in the this week.
**All support/resistance levels depend on PDH/PDL, breaking either side may change the levels plotted*
**Time of plotting the levels and planning 26th November, 10:30 AM**
***Personal opinion, not a trading advice***

XTZ.usd Parabolic Climb about done? or retrace for one more Leg?Part of my ongoing analysis of XTZ movements (see links below).
As we all know, Tezos has been growing in leaps and bounds (parabolic actually).
Eventually it will pull back, and this would be a great spot to start retrace (or crash).
However, the parabolic leg is typical of a "wave 3" with wave 5 yet to come (in theory).
It is PLAUSIBLE that wave 3 goes a bit higher (green wave).
It is LIKELY that w3 is done and w4 is starting (blue wave).
It is POSSIBLE that the pullback will be deep (red wave).
Break above $3.6369 would imply w3 to $4.2xx
Break below $2.9239 would imply deep retrace.
Break below $2.4502 would imply crash potential.
Previous BCH plots: (click links below)
$2.00 Target Plot (blew right past it)
$1.23 Bounce Plot (near perfect bottom)
$1.85 Take Profit (near perfect top)
Parabola Spotted (early bull call)
I plot many Crypto Currencies, as well as Forex and some Stocks.
See my TV Profile Page and hit "follow" to be notified of updates.
.

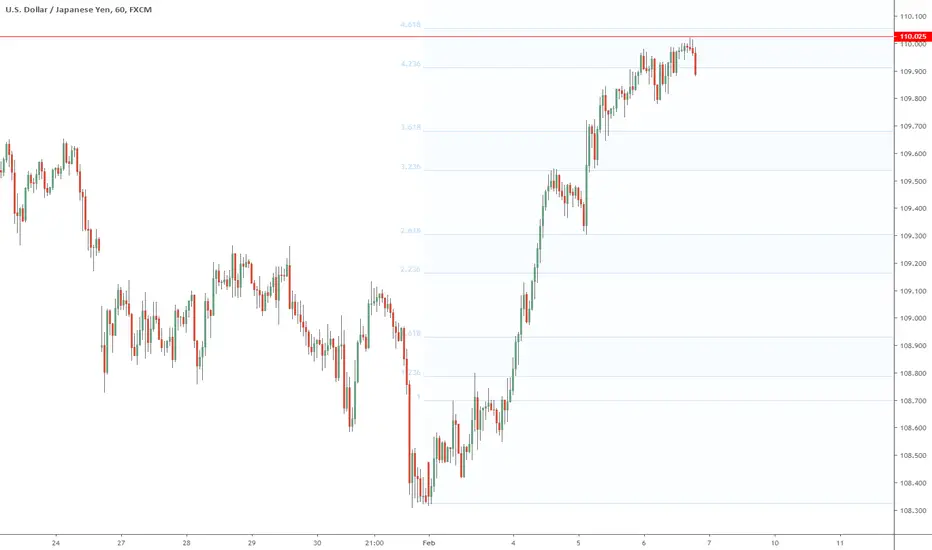
USD.JPY scalp short into Reversal? based on ONE line: $ 110.025Attempting a scalp short which if survives might catch the reversal.
Market sentiment has been "Risk-On" so shorting this pair a bit risky.
But as we know, risk sentiment can flip instantly given some "news".
No targets yet, but will watch each of the Blue fib lines for clues.
IF the move progresses down, I will make measurements and a new plot.
Until that time I will trail the Stop one fib behind the price at any time.
$110.025 is NOT some random number, it is THE number for UJ, see this plot:
XRP.usd Support Zones of interest after Strong Bounce in RetraceThis is follow up to my previous Plot that caught the Rocket from $0.19 (click) .
XRP finally took off, partially tugged by Bitcoin, partially of its own strength.
Entire market had been retracing and so is Ripple, but it is holding some gains.
Now approaching some support zones including one it just " Pinged " up from.
I know what you are thinking: "Draw enough lines and SOME of them will react".
And normally I would agree, but these lines are because of congestion below.
Congestion/Consolidation has many " Impulses " that produce many "https://www.tradingview.com/chart/LTCUSD/yNQWEaqy-The-Pulse-of-an-asset-times-Fibonacci-Chapter-2/ ".
Chart Notes:
Plotted are 3 charts of different timeframes: 1 H, 21 min, and 5 min candles.
Blow up a single pane by hovering over Lower-Center and click the Square Icon.
Drag PRICE scale UP to remove overlap in numbers and view in greater detail.
I will post updates as price moves or if the outlook changes.
.
See some of my other plots and trade calls below.
I also plot Forex and Stocks, take a look at my profile page
BAT $0.15 Bottom (great gains)
EOS top Call (near perfect plot)
LTC to $150 call (near perfect plot)
BTC $14k call (Near Perfect target, easy trade)
ETH breakout (instant Profits, no drawdown)
BTC bottom 3.1k (caught the EXACT bottom)
ADA breakout (PERFECT targets, massive profits)
ZRX bottom call (200% gain, Perfect target)
ZRX breakout (massive Profits, short wait)
XLM breakout (massive Profits, instant Win)
RVN top call (Perfect Target, take profits)
LINK re-entry (caught the spike)
MATIC top Warning (caught the EXACT top)
MATIC rocket (massive Profits, breakout entry)
NEO Rocket Launch (great entry, massive profits)
FET top warning (EXACTLY on time)
Of course, I have had total FAILS on some ideas too, not going to pretend.
But all of my plots show PRECISE entries, TIGHT stops, and EXACT targets.
Precision is the way of the Fib. Almost every turn happens at a Fib Line.
