$GRVY HITS KEY SUPPORT LEVELNASDAQ:GRVY Hits a key support level:
The support level is :
1) Related to a previous top
2) 0.786 Fibonnaci retracement
3) At the 89 period moving average
4) The trendline since October 2020
I am getting long at this level:
1) We have a stochastic hidden bullish divergence
2) The company is growing it's earnings per share
3) The general market is going up
4) It allows me to have a nice risk to reward ratio with a relatively tight stop-loss
Search in ideas for "stochastic"

NZDCHF PA Range| .382 Fibonacci| Stoch Buy Cross| 21 EMAEvening Traders,
Today’s analysis – NZDCHF- deviating back to range low where support is probable,
Points to consider,
- Price Action Impulsive
- Range Low Support
(.382 Fibonacci Confluence)
- 21 EMA Resistance
- RSI Bullish Control Zone
- Stochastic Buy Cross
NZDCHF’s immediate price action is trading towards Local S/R that has technical confluence with the .382 Fibonacci. A bounce here is highly probable, allowing for a bullish bias.
The 21 EMA is current dynamic resistance, breaching this in the immediate short term will show convicting in price action.
The RSI is trading in its bullish control zone, maintaining these levels are indicative of strength. Current stochastics has a valid bullish cross coming to fruition, confirmation will signal an immediate momentum shift.
Overall, in my opinion, NZDCHF is a valid long with defined risk, price action is to be used upon discretion/ management.
Hope this analysis helps!
Thank you for following my work
And remember,
“You never know what kind of setup market will present to you, your objective should be to find opportunity where risk reward ratio is best.”
― Jaymin Shah

BTCUSD Rising Channel|21 MA|Neck Line S/R|Declining Volume| PA Evening Traders,
Today’s Analysis – BTCUSD – trading at a key pivot point with bearish price action, key region to watch is around $10650 -$10680.
Points to consider,
- Bearish PA
- Neckline Resistance
- Channel Support
- RSI Trend Break
- Stochastic Sell Cross
- Declining Volume
BTCUSD’s immediate price action is bearish with a confirmed psychology of a head and shoulders. This allows us to have a bearish bias on the market in the immediate short term.
The current Neckline S/R is resistance, price has respected it on first attempt, breaking this level will negate our bearish bias.
The immediate support is the Channel S/R, this creates a respective apex in correspondence with the Neckline S/R. BTC will break out of this apex in the coming hours.
Both oscillators are showing weakness, the RSI has broken its dynamic support whilst the stochastics has a valid sell cross. This is indicative of immediate momentum shifting in the market.
Volume is considerably low; this is suggestive of a volume influx, most likely to coincide with the break of the apex break.
Overall, in my opinion, BTCUSD is a valid short with defined risk; price action is to be used upon discretion/ management of trade.
Hope this analysis helps
Thank you for following my work!
And remember,
“The big ones take the psychology out of the game. Have a game plan, and stick to it.” Tim Erber

SRMBTC Bullish Scenario| Falling Wedge| Structural S/R| Apex| PAEvening Traders.
Second analysis – SRMBTC –trading in a probable falling wedge that needs to break resistance for confirmation,
Points to consider,
- Trend approaching apex
- Structural S/R (support)
- Possible bullish divergence forming
- Stochastics buy cross
SRMBTC’s trend is approaching its apex where a break will be imminent; breaking bullish will confirm the falling wedge pattern.
The immediate target for SRMBTC will be swing high
Structural S/R is current support that is likely to get tested, establishing a new local lower low will increase the probability of an RSI bullish divergence.
The stochastic is currently showing a buy cross; momentum needs to shift above 30 for confirmation.
Overall, in my opinion, SRMBTC is a valid long trade upon confirmation of the falling wedge pattern. Price action is to be used upon discretion/ management of the trade.
Hope this analysis helps!
Thank you for following my work!
And remember,
“Trade the market in front of you, not the one you want!” – Scott Redler

CRLBF S/R Flip|Structural Support|Trend Change|Bull Volume NodesEvening Traders,
Today’s Analysis – CRLBF – showing signs of a confirmed trend change, holding structural support will establish another higher low.
Points to consider,
- S/R Flip at structural level
- Structural resistance (Immediate target)
- RSI Cooling off
- Stochastic in upper regions
- 21 Moving Average (Visual guide)
- Increasing bull volume nodes
The trend change on CRLBF has been confirmed with establishing its first higher low. Now trading above structural support, consolidation above this level will further solidify the S/R flip.
The 21 Moving Average can be utilized as a visual guide as CRLBF has been respecting it in the immediate up trend.
Current increasing bull volume nodes is a healthy sign for the trend change, must sustain with establishing another higher low.
The RSI is cooling off from oversold conditions, a retracement to the 50 level is probable if price starts to consolidate above support.
Stochastics on the other hand is in the upper regions, can remain trading here for an extended period of time with stored momentum.
Overall, in my opinion, CRLBF is in the midst of a trend change. Holding structural support is critical for a new higher low. A long trade is valid with defined risk below structural support.
What are your thoughts?
Please leave a like and comment,
And remember,
“A probabilistic mind-set pertaining to trading consists of five fundamental truths. 1. Anything can happen. 2. You don’t need to know what is going to happen next in order to make money. 3. There is a random distribution between wins and losses for any given set of variables that define an edge. 4. An edge is nothing more than an indication of a higher probability of one thing happening over another. 5. Every moment in the market is unique.”
― Mark Douglas

Engulfing BearFor me its an engulfing bear with stochastic divergence, i.e. loosing momentum. Wait for confirmation candle or the 20EMA to breakdown. Watch out fundamental news too, this is only technical analysis. The profit you gain or loss is not responsible to me.

BNBUSDT Resistance Confluence| Demand Zone| Bearish Retest Evening Traders,
Today’s Technical Analysis – BNBUSDT – wedge formation has broken bearish, testing local support (demand zone), which has led to buy backs.
Points to consider,
- Resistance Confluence
- Bearish retest
- Local Support (Demand Zone)
- Stochastic lower highs
- RSI below 50
Long candle wicks confirm buy pressure coming in at local support, BNB is currently putting in a bearish retest at structural resistance, confirmation will likely revisit local support, this will then further solidify a macro lower high.
A break of structural resistance on the other hand will increase the probability of taking out the current high, continuing the trend.
The RSI is currently neutral, not officially oversold whilst the stochastics is projecting lower highs, indicating potential further downside.
Overall, in my opinion, BNBUSDT has two clear levels to breach, structural resistance and or local support. These are key levels to pay attention to when developing a directional bias.
What are your thoughts?
Please leave a like and comment,
And remember,
“There is only one side of the market and it is not the bull side or the bear side, but the right side.” –Jesse Livermore

GBPUSD - Market in a downtrend - Resistance & Resistance ChannelHi Traders!
The market is in a downtrend.
As you can see the market is respecting a "Resistance Channel".
Everytime it gets inside this area, it falls back again.
After the market was very down, it moved up again towards this area.
We expect the market to move down further.
In addition, the Stochastic is overbought too.
We recommend to sell this market with a risk-to-reward ratio of 1 to 3!
Thanks and good luck :)!

TRX/BTC: A Gamble with Huge RewardIts not one hundred percent, but this really does look like a continuation inverse head and shoulder pattern, everything matches in terms of volume and shape of the graph. The price objective if the inverse head and shoulders were to break upwards would be 1249 satoshis which can be seen in the purple arrow. In addition there is major support around 300 satochis, the risk/reward on this would be insane, so if one were to invest close to 300 satoshis, there would be extraordinary lower risk for the possible reward. Bitcoin has been a tank lately, powering through everything, so its highly probable that Bitcoin will just steam roll through Tronix despite everything.
Continuation Inverse Head And shoulder:
1.) The general shape and volume match those of an inverse head and shoulder, it can be seen that volume is decreasing throughout the movement and there is a lot less volatility on the right shoulder suggesting possible accumulation.
2.) Using the Moving average convergence divergence (MACD), it can be seen that during the head portion of the last move, as the weekly moving averages converged and had a bullish cross, there was huge upside potential in tronix.
3.) Also, using the stochastic, there were two bullish crosses that occurred in this move, the second one was a significant divergence. (It could be argued that since the divergence isn't as large on the right shoulder when compared to the head, there will not be as much upside potential as well)
However, for something like this to occur, bitcoin would either need to be stagnant while tronix pushes up, maintains its price while BTC drops in price, or increases faster than bitcoin. This is possible, but I don't think it is highly likely, thus, I do believe this is a gamble.

[Signal] EURGBP: Covering of EUR shorts a Big PossibilityEURGBP
Timeframe: 1D
Direction: Long
Confluences for Trade:
- Waning bearish momentum
- Stochastic Oversold momentum
- Price action bounced off a Horizontal SupportTrendline
- Fundamentally, weakness in the GBP is explained in the GBPUSD post in Related Ideas and the impact of Brexit will be more extensive for GBP in comparison with EUR.
Suggested Trade:
Entry @ Area of Interest 0.8540 - 0.8650
SL: 0.8447
TP1: 7.8747
TP2: 0.8888
RR: Approx. 2.10 (Depending on Entry Level)
May the pips move in our favor! Good luck! :D
*This trade suggestion is provided on an advisory basis. Any trade decisions made based on this suggestion is a personal decision and we are not responsible for any losses derived from it.

[Signal] USDHKD: Low-Risk Opportunity Arises AgainUSDHKD
Timeframe: 1D
Direction: Short
Confluences for Trade:
- Pegged currency @ 7.85
- Stochastic Overbought momentum
- Price action at Horizontal Resistance Trendline (Central Bank defends at this level)
- The opportunity appears again similarly to our previous USDHKD trade; minimal risk involved)
Suggested Trade:
Entry @ Area of Interest 7.8450 - 7.8500
SL: 7.8572
TP1: 7.8350
TP2: 7.8210
RR: Approx. 2.72 (Depending on Entry Level)
May the pips move in our favor! Good luck! :D
*This trade suggestion is provided on an advisory basis. Any trade decisions made based on this suggestion is a personal decision and we are not responsible for any losses derived from it.

[Signal] USDCHF: Incoming Multi-Year Resistance; Drop LikelyUSDCHF
Timeframe: 1D
Direction: Short
Confluences for Trade:
- Bearish candle formations and waning strength in upwards move
- Stochastic Overbought momentum
- Price action at strong resistance multi-year Trendline (Since 2016)
Suggested Trade:
Entry @ Area of Interest 0.9980 - 1.0130
SL: 1.0213
TP1: 0.9885
TP: 0.9681
RR: Approx. 2.37 (Depending on Entry Level)
May the pips move in our favor! Good luck! :D
*This trade suggestion is provided on an advisory basis. Any trade decisions made based on this suggestion is a personal decision and we are not responsible for any losses derived from it.

AUDSGD: Strong Support Level @ 2016 lowsAUDSGD
Timeframe: H4
Direction: Long
Confluences for Trade:
- Price action at a Trendline Support
- Stochastic Oversold momentum
- Widening of EMA
- Price action is close to 2016 lows, could be a strong support at such levels
Suggested Trade:
Entry @ Area of Interest 0.9675 - 0.9735
SL: 0.9619
TP: 0.9886
RR: Approx. 2.30 (Depending on Entry Level)
May the pips move in our favor! Good luck! :D
*This trade suggestion is provided on an advisory basis. Any trade decisions made based on this suggestion is a personal decision and we are not responsible for any losses derived from it.

USDCAD: Weakness in oil overdone?USDCAD
Timeframe: 1D
Direction: Short
Confluences for Trade:
- Price action at top of Resistance line of Parallel Channel
- Widening of EMA
- Stochastic Overbought momentum (W1, D1 & H4)
- Fundamentally, market is starting to expect FED to be more dovish in their hiking path, and may steer USD weakness. Global demand is weaker which has affected oil prices but the move seems extreme.
Suggested Trade:
Entry @ Area of Interest 1.3440 - 1.3500
SL: 1.3521
TP: 1.3252
RR: Approx. 3.56 (Depending on Entry Level)
May the pips move in our favor! Good luck! :D
*This trade suggestion is provided on an advisory basis. Any trade decisions made based on this suggestion is a personal decision and we are not responsible for any losses derived from it.

EURUSD: Mid-Channel Bounce?EURUSD
Timeframe: 1D
Direction: Long
Confluences for Trade:
- Mid-Support in Resistance Channel
- Price at Support of a Horizontal Trendline
- Stochastic Oversold momentum (H4)
- Fundamentally, EU-Italy impasse has shown some willingness from Italian counter-party to review their budget deficit numbers. Although not concrete, it should relieve some pressure off the EUR (it dropped from 1.18 - 1.12 due to this issue last time). The growth data numbers have been weak but it is unlikely to deter the trajectory of ECB's direction to taper.
We believe market is still very rangy at this point of time. Use small lots to be safe.
Suggested Trade:
Entry @ Area of Interest 1.1250 - 1.1310
SL: 1.1209
TP: 1.1494
RR: Approx. 2.20 (Depending on Entry Level)
May the pips move in our favor! Good luck! :D
*This trade suggestion is provided on an advisory basis. Any trade decisions made based on this suggestion is a personal decision and we are not responsible for any losses derived from it.

NZDCHF: Long-Term Short Trend NZDCHF
Timeframe: 1D
Direction: Short
Confluences for Trade:
- Price action at Strong Resistance Trendline (Since Jan 2015)
- Price action at 61% Fibo retracement levels
- Gap between 8EMA and 50EMA too wide
- Stochastic Overbought momentum
Suggested Trade:
Entry @ Area of Interest 0.6825 - 0.6925
SL: 0.6998
TP: 0.6453
RR: Approx. 3.42 (Depending on Entry Level)
May the pips move in our favor! Good luck! :D
*This trade suggestion is provided on an advisory basis. Any trade decisions made based on this suggestion is a personal decision and we are not responsible for any losses derived from it.

EURNZD: Price Bounce LikelyEURNZD
Timeframe: 1D
Direction: Long
Confluences for Trade:
- Price at Long-Term Trendline (since Feb 2017)
- Price at Fibo 38% levels
- Price around Horizontal Trendline (since Jan 2018)
- Divergence of 8 EMA and 50 EMA quite wide
- Stochastic Oversold momentum
Suggested Trade:
Entry @ Area of Interest 1.6610 -1.6750)
SL: 1.6464
TP: 1.1.7228
RR: Approx. 2.80 (Depending on Entry Level)
May the pips move in our favor! Good luck! :D
*This trade suggestion is provided on an advisory basis. Any trade decisions made based on this suggestion is a personal decision and we are not responsible for any losses derived from it.

AUDNZD: Revival of the AUD Strength?AUDNZD
Timeframe: 1D
Direction: Long
Confluences for Trade:
- Price close to Long Term Support Trendline (since 2015)
- Price at Resistance Line of Parallel Channel
- Price at 78% Fibo retracement levels of previous Low to High
- Stochastic Oversold momentum (W1, D1, H4)
Suggested Trade:
Entry @ Area of Interest 1.0585 - 1.0640
SL: 1.0541
TP: 1.0800
RR: Approx. 2.50 (Depending on Entry Level)
May the pips move in our favor! Good luck! :D
*This trade suggestion is provided on an advisory basis. Any trade decisions made based on this suggestion is a personal decision and we are not responsible for any losses derived from it.

GBPJPY (1D): Strong Selling AreaGBPJPY
Timeframe: 1D
Direction: Short
Confluences for Trade:
- Stochastic Overbought momentum (1D, H4, H1)
- Strong Selling area (since June 18, price has been sold down from this area)
- Fundamentally, yet to see actual progress in Brexit negotiations; so far all we are hearing are reports are saying this and that. Add on, a risk off play may be likely if the Democrats take over the House of Representatives.
Suggested Trade:
Entry @ Area of Interest: 148.20 - 149.20
SL: 149.76
TP: 146.18
RR: Approx. 2.09 (Depending on Entry Level)
May the pips move in our favor! Good luck! :D
*This trade suggestion is provided on an advisory basis. Any trade decisions made based on this suggestion is a personal decision and we are not responsible for any losses derived from it.

MNKD - falling wedge on the hourlyMNKD is in a falling wedge on the hourly time frame. The stochastic has coiled and there is divergence, right at the breakout point of the wedge.
Buy: 3.03
Target: 3.10 - 3.20 (2.31% - 5.61%)
jbzstocks.com
@jbzstocks

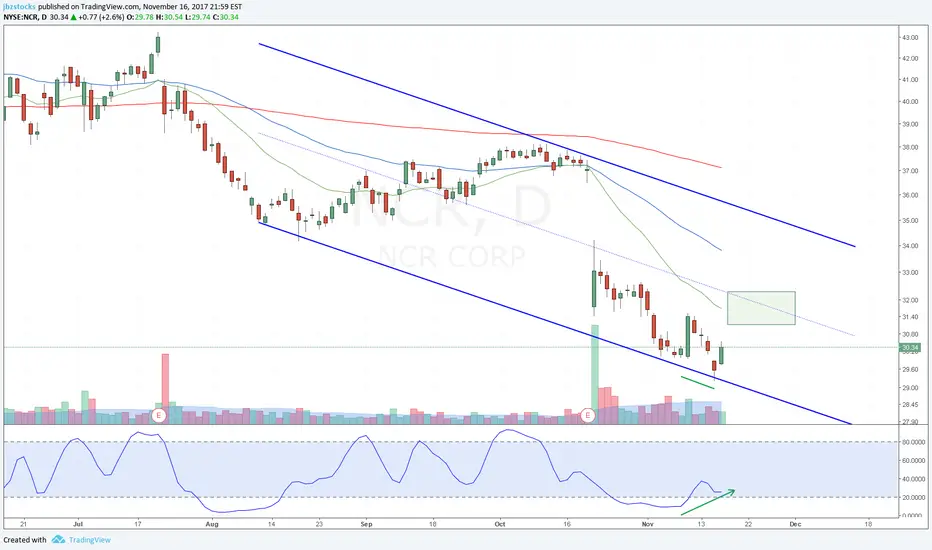
Running Divergence channel line bounceThere is a running stochastic divergence on channel line support. Mentioned this one last week in the list and it finished the week strong. It looks like there is more upside to come, but I consider it a higher risk since it is a new stock (IPO in July).
Buy: 19.50
Target: 20.93 - 22.70 (7.33% - 16.41%)

Falling wedge Trend Line BreakoutMSI has been coiling and now that the stochastic returned to oversold and has turned back u, it's time to move.
B: 85.00
S: 83.50
T: 87.02 - 89.59 (2.38% - 5.40%)