GBPUSDThe expected price movement is the completion of the Shark pattern within the harmonic pattern. The expectation is that its course will be downward in the next phase, and God knows best. A break of the upward trend line reinforces selling levels in the next phase. The Shark pattern continues to form, which is a bullish pattern. Remember, this is a prediction, not a recommendation.
Shark

Bitcoin Bear Market Outlook🔴 Over the next 10 months, INDEX:BTCUSD is expected to correct the entire rally from the 2022 low, with downside potential toward the 37K – 30K zone to retest the previous base.
🔵 The structure of the decline remains uncertain, it could unfold as a sharp aggressive drop or a slow bleeding move.
#ElliottWave #Crypto #Trading

JPY SharkAs we expected in the previous idea, the dollar index strengthened, and accordingly, the dollar-yen currency pair will likely jump above the Fibonacci golden level (the pink area) to around 113.8 and then probably take a deep dive.

Sark into the 5-0Shark appears to have been completed at the 113 area of our top of the old high and reversed. Let’s see if we can get into the 5-0 toward 47200.

Potential BTCUSD RUsh to $155KPrice action has reached our anticipated support level of $89,000, a critical threshold we identified in our previous analysis.
Based on current technical structure, we are positioning for a potential rally toward $155,000 in the next 24weeks.
However, over the coming weeks, with our target window extending through January 26th.
Forward Outlook:
The manner in which price navigates to this level will be instrumental in shaping our 2025 outlook. We are monitoring two primary scenarios:
Bullish Case: A sustained move higher could establish new targets at $145,000
Bearish Case: Failure to maintain momentum may result in a retracement toward the $78,000-$65,000 range
We are intentionally keeping technical details concise to maintain clarity for our portfolio holders.
Further updates will be provided as market conditions develop.
Disciplined patience remains our guiding principle.
Ieios Capital

$MSTR Bullish Shark Harmonic completedNASDAQ:MSTR : C wave of this ABC correction has gone beyond A, meeting the requirements of an ABC flat correction. Bullish Shark Harmonic also looks complete.

POTENTIAL BULLISH SHARK HARMONIC ON BTC/USDThere appears to be a potential bullish harmonic pattern forming on Bitcoin. The structure has all the components that could signal a possible market bottom before a blow-off top phase. Sentiment and confluences — including the 0.618 retracement level, suggesting a potential completion of Elliott Wave 2 — are aligning.
I’ve outlined my entry levels, stop losses, and take-profit targets for transparency. Wishing everyone good luck with their trades.

Cardano - Realistic take4 separate times that RSI Divergence has occurred in oversold territory has hinted and displayed positive upside shortly after.
*Bullish Shark harmonic could be forming.
My current price to add more: ~.45 range.
No current TP at this time.

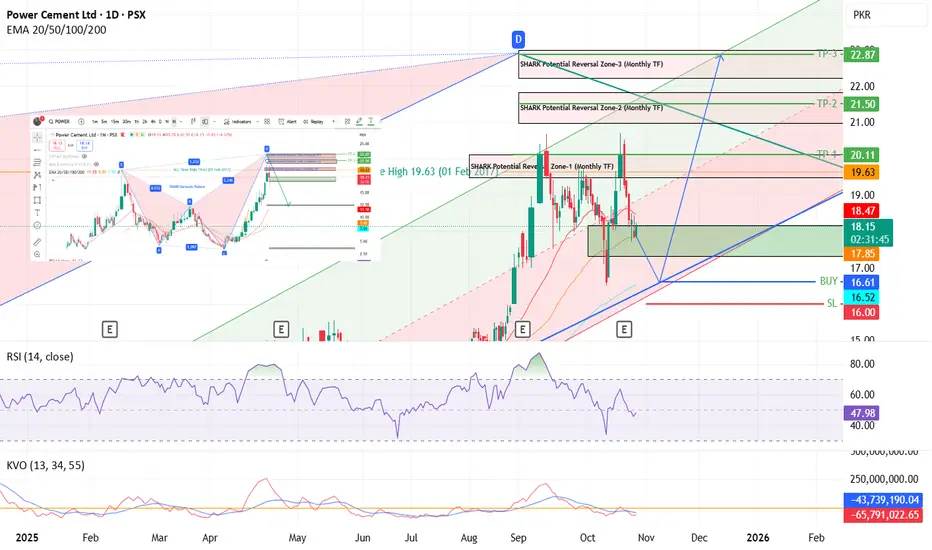
POWER - PSX - Technical Analysis - Monthly & DailyPOWER on Monthly Time Frame, has completed the SHARK Harmonic Pattern Zone-1 and has tested it twice and then price came down. It may even try to test Zone 2 or Zone 3 by taking support from Weekly Trend Line (Blue). Even presently price is in support zone (green) and may go up again from this zone.
A regression channel has also been drawn which price is following.
In my personal opinion, price will try to test SHARK Potential Reversal zone 3 before eventually coming down.
I recommend entering the trade as marked on the chart. From 17 to 23 in next 2 to 3 months is quite possible.
ETH Elliott wave analysis 13/10 /2025In my view, ETH has not yet completed its upside cycle, and the recent decline is simply part of wave (c) within wave (IV).
I believe we are currently in wave (5), specifically within wave 3 of that structure. The reason is that if waves 1 and 3 were corrective ABC structures, then wave C should not exceed 138.2% of wave A, otherwise it would invalidate the b-failure flat pattern—and this limit has already been exceeded, confirming the impulsive nature of the current move.
The Shark harmonic pattern indicates a potential target zone around $5,000–$5,100, which aligns with the requirement for a higher high to complete wave 5. Interestingly, this target also coincides with a Gann Fan resistance level, adding further confluence to this projection.
The invalidation level for this bullish scenario is at $3,800.
A break below this level would suggest that a full bear market structure has already begun.

Btc/U.S. S_Enterprice Circle Structure . The chart represents a multi-layer analysis of price movement using Fibonacci Circles and geometric expansion structures . The colored concentric zones show the main areas of liquidity compression and release .


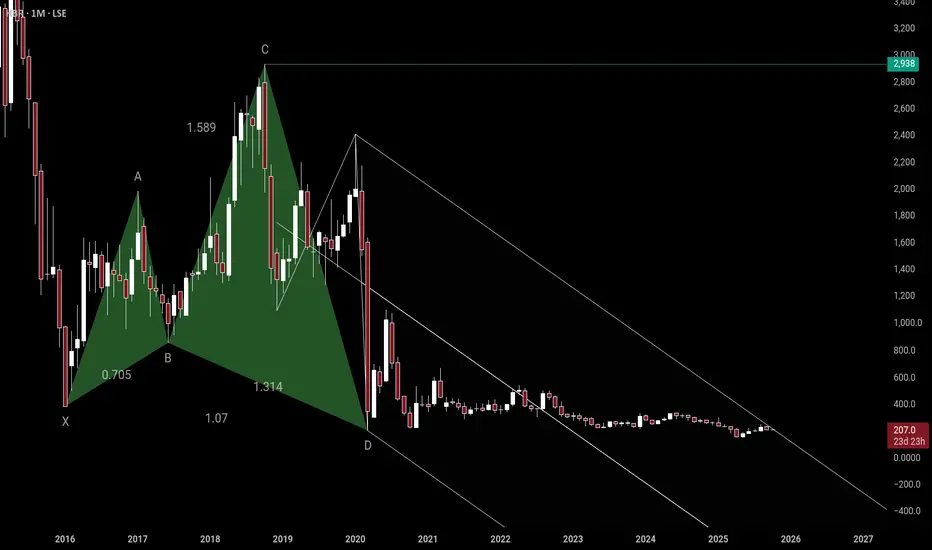
HBR massive shark pattern.This one shows a shark harmonic with schiff pitchfork. The fact this has been in consolidation/PRZ since 2020 means 1 of 2 things.
1. Bearish, the pattern has failed.
2. Bullish, this going to explode so fast and hard.
The fact Brent oil is threatening to clear its main resistance leads me to the latter.
$BTC Bearish Divergence on 1H Chart Near Key Support#BTC BearishBTC/USDT on the 1-hour timeframe is flashing a bearish structure with clear divergence. The immediate correction zone looks to be around $111K, with the $110.8K support acting as the deciding level. If that floor gives way, we could see a sharp drop toward $98K. But if buyers defend the level, it may reset as a new higher low, setting up continuation. With Fed data on deck today, expect liquidity grabs both ways—first stop likely downside before any rebound.

GBPCAD ShortProbability of a decline in the GBPCAD based on the harmonic shark algorithm.
A price Correction is occurring at the Fibonacci level of 0.88, and it is expected that a Deep Correction price will be observed at the Fibonacci level of 1.138.

IWM Appears Due for a Minimum 40-60% Downside CorrectionOn the lower timeframes IWM has been treating $223 as short term support with much sold put leverage building at $220 and recently IWM has begun to retrace back down into those levels putting those sold puts at risk of expanding the volatility and of squeezing through these short puts as a result.
The short term the loss of this zone could likely squeeze down to $200.
However in the longer term we have been trading within this much larger parallel channel since the peak and bottom of 2008-2009 GFC and have started to form a potential peak paired with a Bearish Shark. I think that if we were to start to see some serious downside the IWM could trade back down to not just the bottom of the channel but down to one of the 3 major horizontal supports I have plotted on the cart down at $121, $85.74, or even $41.11 if things get real bad.
Personally I will be targeting one of the 2 upper horizontal supports in the longer dated positioning while targeting the $210-$200 levels in the short term.
I'd suspect this decline to come especially as Fed Rate cut expectations are completely priced out of the market, it is worth mentioning that fed funds futures around the start of the month dropped their expectations of rate cuts for the September meeting down to 0 and we may now be on the path to pricing in rate hikes as seen in the chart below.
Alternatively the expectations for rates going into the end of December has been on a fast trajectory of pricing out rate cuts as well, starting at 90BPS of rate cuts at the start of the year, now pricing in only 37.5BPS in rate cuts:
This ongoing shift in these fed futures spreads from positive to negative signifies the amount that Fed Funds Futures are expecting the Fed to hike rates with both the instance of rate hikes and rate cuts likely to cause a collapse in credit spreads as the bond market yield shift higher leaving the interest rate sensitive IWM to be one of the most negatively affected.

EURNZD Bearish Shark Follow-UpFrom my previous post regarding potential Bearish Shark forming on the EURNZD (see Related Publications ->) a shooting star pattern might be forming right around the 1.97500 level. I usually don't trade candlestick patterns, but will look for a handful of certain ones around areas of fib confluence, S/R, S/D, and divergence. The Kiwi is weak relative to all other currencies, but I think the Euro is exhausted. Nevertheless, I would not be surprised if bulls make another exhausted push up towards 1.98500.
Currently short at 1.9755

Bearish Shark EUR/NZDLooking at a potential Bearish Shark forming on the EURNZD. I'm seeing divergence, but anticipate a bullish move up towards 1.975. I've placed a couple short limits at 1.975 and 1.98, but will short the market if I see a signal on the lower timeframes.

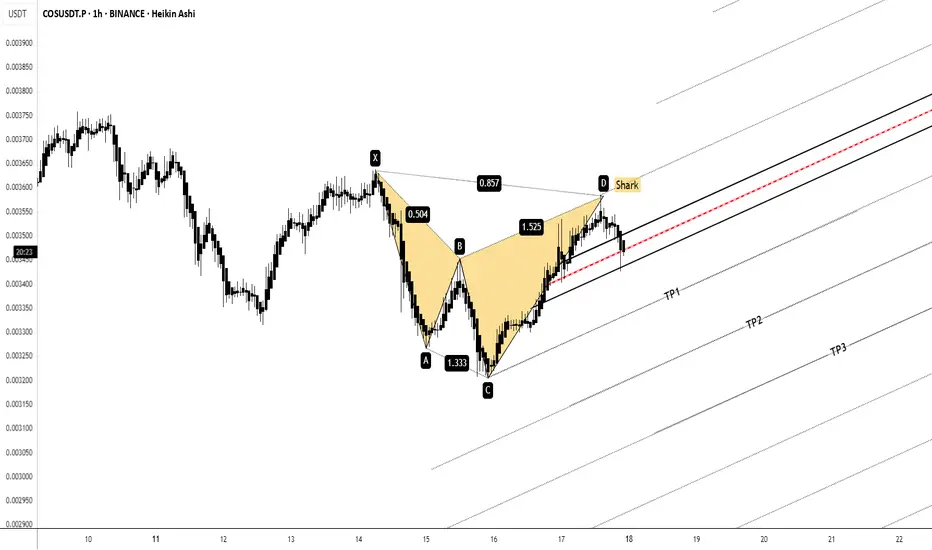
COSUSDT.P | 1H Short ThermOpening a short setup on COSUSDT.P (1H) based on the completion of a Shark harmonic pattern at point D.
🔎 Confluences:
– Shark pattern completion aligning with resistance
– TDG indicator flashing bearish momentum (Sell mode)
– Market structure respecting the pitchfork channel
📉 Setup:
– Entry: Point D rejection
– Targets: TP1 → TP2 → TP3 (scaling out)
– Stop: Above X to limit risk
⚠️ This is not financial advice, just sharing my analysis for discussion.
Question: Do you guys find Shark patterns reliable compared to Bat/Crab, or do you mostly ignore them?
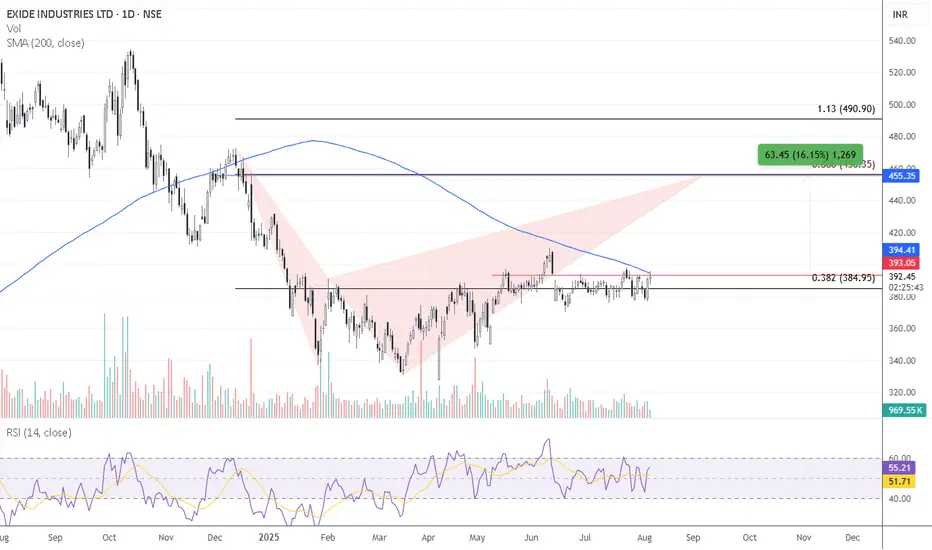
Exide Ltd is currently trading near its 200-day moving averageExide Ltd – Technical Outlook
Exide Ltd is currently trading near its 200-day moving average, which is acting as a key resistance level. A decisive breakout above this level could trigger a positional upmove of approximately 15%, making it a strong candidate for a medium-term long trade.
Additionally, the stock has been consolidating within a narrow 5% range, indicating a phase of accumulation. A breakout from this sideways range could present a short-term swing trading opportunity.
Actionable Insight:
Keep Exide Ltd on your watchlist for both positional and swing long trades, contingent on a breakout above key resistance levels.

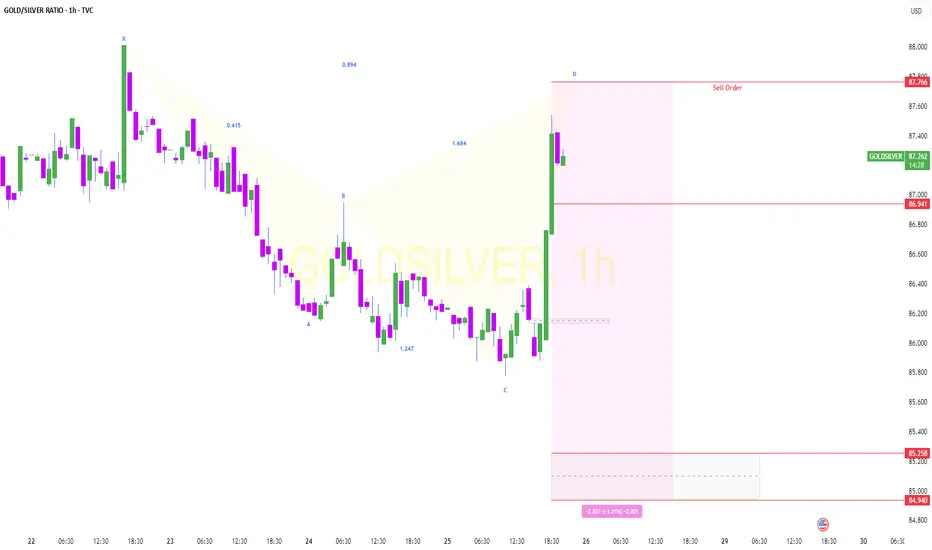
GOLDSILVER Short .GOLDSILVER Index may fall from 87.77 towards target (order block zone), based on shark pattern.
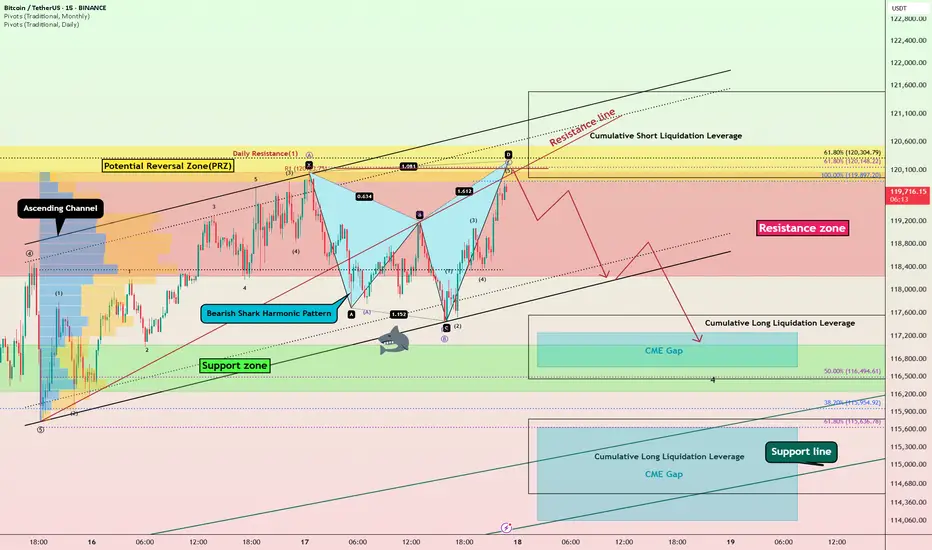
Bitcoin Bearish Shark Detected – CME Gap Below $115K in Sight?Today's analysis is on the 15-minute timeframe , following the previous analysis I shared with you on the 1-hour timeframe .
Bitcoin ( BINANCE:BTCUSDT ) is currently trading in the Resistance zone($120,100-$118,240) near the Potential Reversal Zone(PRZ) and Cumulative Short Liquidation Leverage($121,490-$119,965) .
From a technical perspective , it looks like Bitcoin is completing the Bearish Shark Harmonic Pattern on the 15-minute timeframe .
From an Elliott wave theory perspective, it looks like Bitcoin is completing the microwave 5 of wave C of the Zigzag Correction(ABC/5-3-5) .
I expect Bitcoin to start falling from the top of the ascending channel and at least decline to the lower line of the descending channel, and if the ascending channel breaks this time, we should wait for the CME Gap($117,255-$116,675)/CME Gap($115,060-$114,947) to fill.
Cumulative Long Liquidation Leverage: $117,556-$116,465
Cumulative Long Liquidation Leverage: $115,773-$114,513
Do you think Bitcoin can create a new ATH again?
Note: Stop Loss(SL)= $121,620
Please respect each other's ideas and express them politely if you agree or disagree.
Bitcoin Analyze (BTCUSDT), 15-minute time frame.
Be sure to follow the updated ideas.
Do not forget to put a Stop loss for your positions (For every position you want to open).
Please follow your strategy and updates; this is just my Idea, and I will gladly see your ideas in this post.
Please do not forget the ✅' like '✅ button 🙏😊 & Share it with your friends; thanks, and Trade safe.