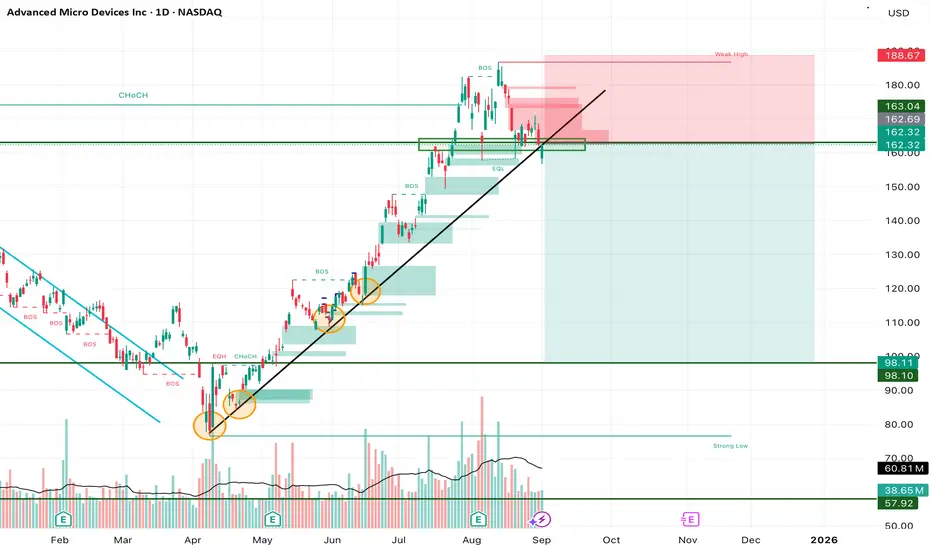
AMD Trendline Break – Short-Term Weakness, Long-Term AI Power PlAMD has broken below its long-standing ascending trendline, which has been respected multiple times since April. This is the first real sign of weakness after months of steady upside. The $162–165 zone, once strong support, is now acting as resistance. Unless bulls can reclaim this area quickly, AMD risks sliding lower toward $150 or even deeper levels.
Technical View:
• Trendline: Broken on daily chart → bearish short-term shift.
• Resistance: $162–165 (former support), $186–187 (weak high).
• Support Levels: $150 psychological, then $135–140 range.
• Indicators: RSI softening, MACD negative, short-term MAs leaning bearish.
Fundamental Backdrop:
Despite this technical weakness, AMD’s long-term story remains strong. HSBC recently upgraded AMD with a $200 price target, citing its MI350 AI chips that rival Nvidia’s Blackwell GPUs. The MI400, due in 2026, could expand GPU sales to $20B by 2028. Melius Research also raised its target to $175, highlighting AMD’s AI trajectory. Fundamentally, AMD is building momentum as a serious competitor in the AI chip race.
Trade Setup (Swing Idea):
• Entry Zone: $162–165 rejection area.
• Stop Loss: Above $188 (weak high).
• Take Profit 1: $150 (psychological level).
• Take Profit 2: $135–140 demand zone.
• Long-Term Accumulation: Any dip below $150 could be a strategic buy for investors with a $175–200 upside target in the AI cycle.
My View:
Short-term, the break of trendline favors bears — I’m watching for a retest of $162–165 to confirm resistance. Medium-term, I see pullback opportunities. Long-term, AMD’s AI roadmap gives conviction that dips should be accumulated rather than feared.
(Not Financial Advice) NASDAQ:AMD
Shortsetup
CHWY in ConsolidationHi Traders!
In my previous post, I mapped out my long plan, and took profits around resistance at $42. Since then, CHWY has returned back to my entry area I am re-adjusting myself for another set up. Right now it is retesting the Daily CHOCH area again, and seems to be in consolidation. If the Daily CHOCH is valid, I would like to see a bullish engulfing, or a strong bounce to act as support.
If the CHOCH area fails, I will look for a re-entry around $36. That will bring price towards a Daily order block. Therefore, a bearish sentiment would be a close below $39, retests from below turning into resistance. No trade if it just chops between $39 & $40 with weak candles. This will avoid me getting caught in consolidation and chopping up my contracts.
*DISCLAIMER: I am not a financial advisor. The ideas and trades I take on my page are for educational and entertainment purposes only. I'm just showing you guys how I trade. Remember, trading of any kind involves risk. Your investments are solely your responsibility and not mine.*

BTC price analysis for SeptemberWith ICC we read what price is telling us and we act accordingly.
After the ranging sideways zone, price has given the bearish indication, went up to take the shorts above 122k then pushed back down.
The trend is still bearish, 1h,4h and Daily both MACD and RSI are still bearish.
The support from 105k to 106k has held price before so it could be where BTC reverses and strong buys will step in OR it fails to hold and we head further down. We don't try to predict.

Indecision and Potential StallingHi Traders!
GBPUSD is telling me indecision right now. When mapping out my trading plan I'm seeing price recently made a higher low on the weekly, dipped into a Daily Order Block, and currently testing the 1.36000 neckline. However, unless GBPUSD closes above 1.35200, retests with continuation, this looks like consolidation. Alerts set, and waiting for some more confirmation right now.
Key levels:
Bullish breakout- Close above 1.35200.
Bearish caution- Break below 1.34600/1.34500.
*DISCLAIMER: I am not a financial advisor. The ideas and trades I take on my page are for educational and entertainment purposes only. I'm just showing you guys how I trade. Remember, trading of any kind involves risk. Your investments are solely your responsibility and not mine.*

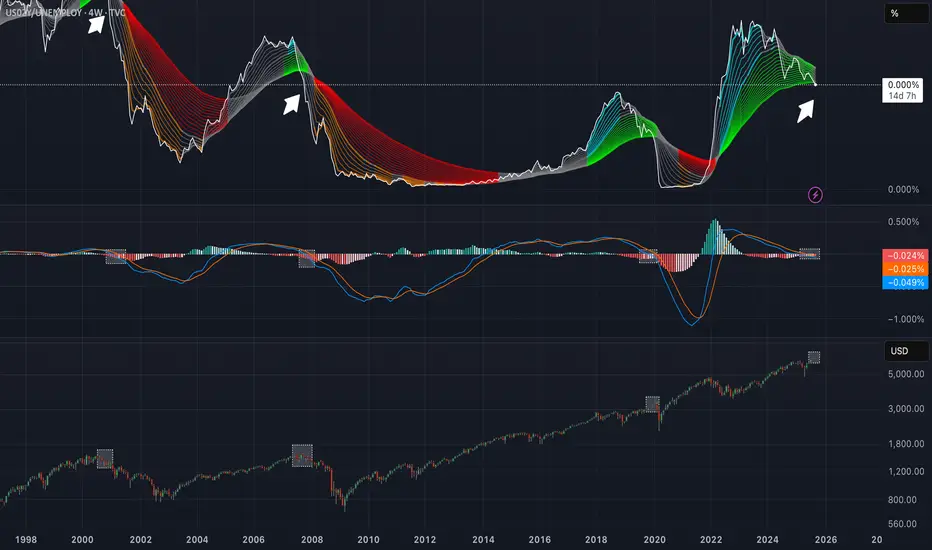
Credit crunch about to explodeI strongly believe we are about to experience a recession in the coming months. Open some spy shorts posisitions for late 2026.
BTC - Short Trade Update - Expected PathI’m sending an update to this short idea because as we progress we can start narrowing down which pathway is the most likely.
I expect this move to occur very quickly, and I hope that afterwards we understand why it’s important to be preemptive with predicting the potential movements and corrective patterns.
My most likely / personal trade:
110,000 to 34,700-35,000
35,000 to 81,000
81,000 to 8,000
My Strategy:
I will be closing 50-75% of my short at 45,000 to 40,000
I will watch for a rise from that 35,000 level to confirm the swing long - and if I see intention for that to play out (we could also go straight to 8,000) - I will open a hedge long position and add to it accordingly
I know many of you think I’m crazy or a troll - but my confidence is very high we will see this occur.

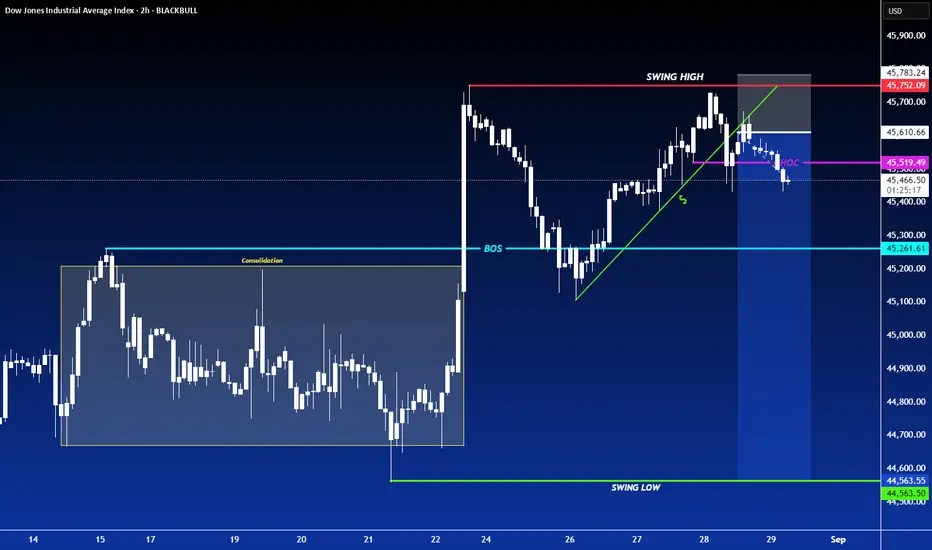
SHORT ON US30US30 has given us a CHOC to the downside after a long time run up.
I will be selling US30 to the consolidation zone looking to catch 1000 points over the next few days.
Is the price of gold really going up? 3500?⭐️GOLDEN INFORMATION:
Gold (XAU/USD) slips in Friday’s Asian session, pulling back from a five-week high near $3,425 as profit-taking and strong US GDP and jobless claims data lift the Dollar. Still, growing expectations of a September Fed rate cut, reinforced by dovish comments from NY Fed’s John Williams, help limit the downside for the non-yielding metal.
⭐️Personal comments NOVA:
Gold prices increased thanks to expectations that the FED will cut interest rates in September. However, the large fomo market will cause the market to be too optimistic, requiring adjustments to accumulate before that time.
⭐️SET UP GOLD PRICE:
🔥SELL GOLD zone: 3437- 3439 SL 3444
TP1: $3430
TP2: $3420
TP3: $3410
🔥BUY GOLD zone: $3366-$3364 SL $3359
TP1: $3375
TP2: $3383
TP3: $3390
⭐️Technical analysis:
Based on technical indicators EMA 34, EMA89 and support resistance areas to set up a reasonable SELL order.
⭐️NOTE:
Note: Nova wishes traders to manage their capital well
- take the number of lots that match your capital
- Takeprofit equal to 4-6% of capital account
- Stoplose equal to 2-3% of capital account

Continue to accumulate below 3400⭐️GOLDEN INFORMATION:
Gold (XAU/USD) dips during Thursday’s Asian session, pulling back from a three-week high near $3,400 as the US Dollar rebounds and traders book profits. Ongoing concerns over Fed independence, following President Trump’s removal of Governor Lisa Cook, lend some support to the safe-haven metal.
Markets now await the second estimate of US Q2 GDP, expected at 3.1%. A stronger print could boost the Greenback and pressure Gold, while focus will shift to Friday’s PCE inflation data for clues on Fed rate-cut prospects
⭐️Personal comments NOVA:
Gold prices continue to accumulate below 3400, according to experts expecting GDP data to support DXY. This could contribute to putting pressure on gold prices.
⭐️SET UP GOLD PRICE:
🔥SELL GOLD zone: 3428- 3430 SL 3435
TP1: $3418
TP2: $3407
TP3: $3392
🔥BUY GOLD zone: $3350-$3352 SL $3345
TP1: $3360
TP2: $3370
TP3: $3380
⭐️Technical analysis:
Based on technical indicators EMA 34, EMA89 and support resistance areas to set up a reasonable SELL order.
⭐️NOTE:
Note: Nova wishes traders to manage their capital well
- take the number of lots that match your capital
- Takeprofit equal to 4-6% of capital account
- Stoplose equal to 2-3% of capital account

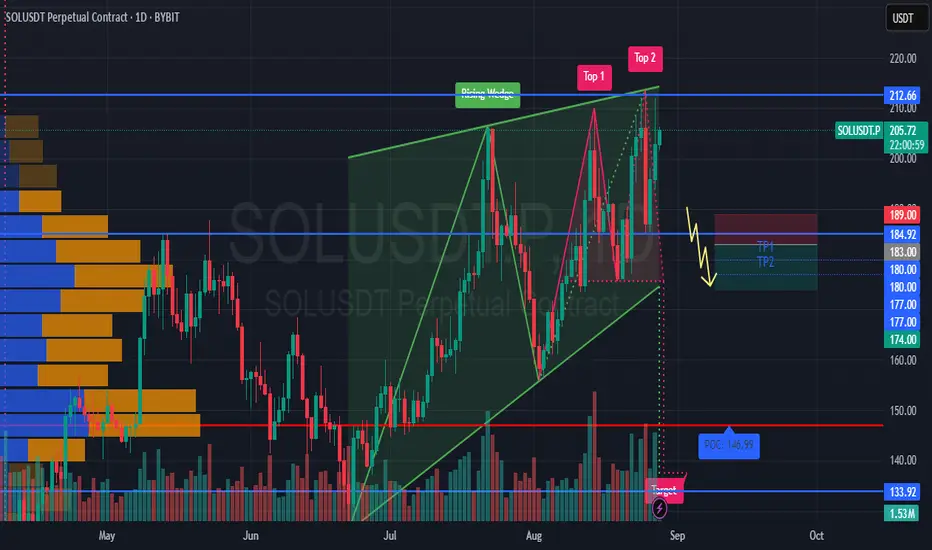
#SOLUSDT maintains a bearish setup📉 SHORT from $183.00
🛡 Stop loss $189.00
🕒 Timeframe: 1D
❗ If the price consolidates above $189, the setup becomes invalid.
⚡ Overview:
➡️ On the daily chart, a Rising Wedge has formed — a bearish pattern signaling potential reversal.
➡️ The $183.00 level is the key zone where the short scenario gets activated.
➡️ The POC at $146.99 remains a strong long-term magnet for price.
➡️ Increasing volumes on red candles confirm seller interest.
🎯 TP Targets:
💎 TP 1: $180.00
💎 TP 2: $177.00
💎 TP 3: $174.00
📢 Short entry is optimal from $183 with a clear stop at \$189.
📢 Focus on holding below $183 — this will confirm the bearish continuation.
📢 In the long term, if $174 breaks, the target could extend to the $147 (POC) zone.
🚀 #SOLUSDT maintains a bearish setup — as long as price holds below $183, expect a move toward $174 and potentially further downside.
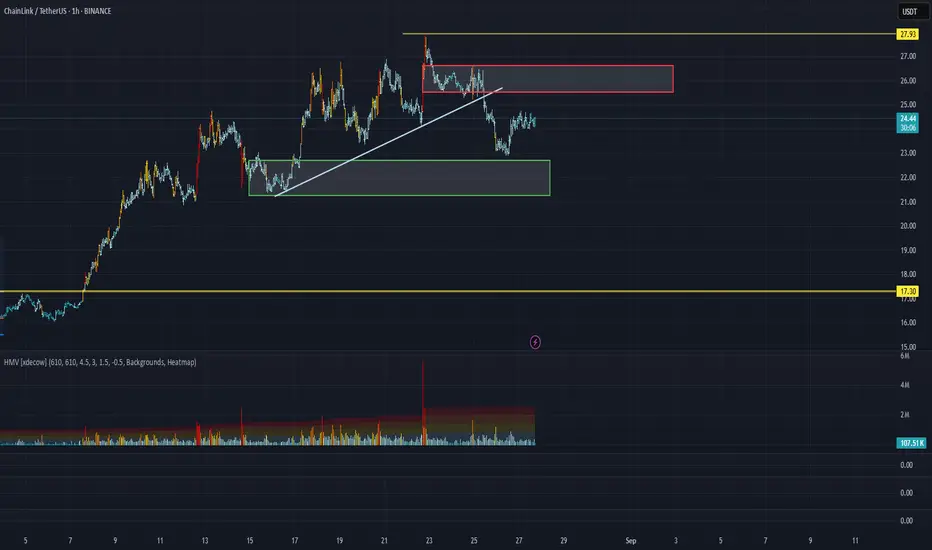
LINK/USDT Analysis. Short Setup
This asset has made a trend break to the downside. A strong volume zone has formed above the current price. If the price tests the $25.5–$26.6 range and shows a reaction, we consider short entries.
ETHUSD🔎 Chart Setup
ETH/USD 1H → Bearish flag = continuation pattern AB=CD
ETH Dominance (D) → Also breaking flag = confirms weakness in ETH vs other alts/majors
📊 Trade Plan
⚠️ Manage risk strictly (crypto volatility is brutal):
Entry: On breakdown retest of the flag support line 🟥
Stop Loss (SL): Just above flag resistance
rofit (TP):
🎯 TP1 (1:1 RR) → Secure partial profits (50% book)
🎯 TP2 (1:2 RR) → Let rest run, trail SL
💡 Risk Management
Max 1%–2% account risk per trade ⚖️
Always use hard stop, don’t widen 🚫
Partial booking keeps you safe + confident 🛡️

BTC - Short Trade Update - Ready to PlummetWe secured the top entry around 117,000 - successfully snagging that top price.
Currently Bitcoin has fallen below this key trendline channel.
Adjusted trading path possibilities:
Scenario 1:
Short - 110,000 to 34,700-35,000
Long - 35,000 to 82,000
Short - 82,000 to 7,300-9,000
Scenario 2:
Short - 110,000 to 43,000
Long - 43,000 to 74,000
Short - 74,000 to 7,300-9,000
Scenario 3:
Short - 110,000 to 7,300-8,000
Suggestion:
Watch for interactions at these bounce levels, consider hedging with longs at those Long ranges (remain short for main position) on ETH (correspondence with BTC price timing).
Let’s see how this progresses.
All the best.

BTCUSDBTCUSD
15 min TF
Sell Plan Trendline breaks !
Bearish Candle
SL TP EP mentioned in chart any quiries please leave message

SUSDT 4H Chart Analysis | Channel Breakdown LoomsSUSDT 4H Chart Analysis | Channel Breakdown Looms
🔍 Let’s break down the recent price action on the S/USDT 4-hour chart, focusing on the pivotal ascending channel structure and its implications for the next move.
⏳ 4-Hour Overview
S/USDT has been moving within a well-defined ascending channel, marked by higher highs and higher lows. Price is now testing the lower boundary of this channel, making the 0.3127 support a crucial level. The recent uptick in volume during the downward leg hints at mounting bearish pressure.
🔻 Short Setup:
A confirmed breakdown (BO) below 0.3127 would signal an exit from the ascending channel, opening the door to accelerated downside. With channel support breached, the next key target sits at 0.2710, in line with historical liquidity and the channel’s projected lower range.
📊 Key Highlights:
- Price action is currently at the channel’s lower boundary, with a breakdown below 0.3127 required to confirm bearish momentum.
- Volume has increased on the recent downward move, supporting the idea of a channel exit and follow-through selling.
- Downside target stands at 0.2710 if the channel fails, providing a clear roadmap for action.
🚨 Conclusion:
Bulls must defend the ascending channel at 0.3127, or risk seeing S/USDT cascade toward 0.2710. Watch for volume confirmation—an exit below channel support could shift sentiment quickly.

BTCUSD Short: Targeting Channel Support at 107800Hello, traders! The price auction for BTCUSD has been clearly contained within a descending channel for an extended period. This bearish structure was established by key pivot points that defined the upper supply zone near 117350 and the lower demand territory. Since the formation of this channel, every rally attempt has been met with significant selling pressure from the supply line, consistently confirming that sellers are in control of the dominant trend.
At present, the price has completed another impulsive move downwards within this structure. BTCUSD is now trading at a critical juncture, directly testing the major horizontal demand level at 111000. The market is currently pausing at this support, which represents the upper boundary of the wider 111000 - 110300 demand area, a key battleground for market participants.
The working hypothesis is a short continuation scenario. It is anticipated that after a brief dip into the demand area, a minor corrective bounce may occur. However, this rally is expected to fail, with sellers reasserting control. This failure would confirm that the bearish momentum remains dominant, setting the stage for the next leg down. The take-profit is therefore set at 107800 points, targeting the lower demand line of the channel. Manage your risk!

BTC adjusts down, market suspects interest rate cut💎 BTC PLAN UPDATE – Early Week (08 / 25 )
🔎 BTC Analysis
After retesting the 117k resistance zone (117,566 USD), the price reacted with a sharp drop. This indicates that the selling pressure in this area remains very strong.
Currently, the price is falling near the EMA200 (red line ~111,664) – which is a key short-term support level.
📌 Key Reaction Zones
111k – 110k:
This is the confluence of EMA200 + Fib 0.5.
If the price holds, there’s potential for a rebound back to 113k–115k.
109k – 108k:
Next strong support.
If 111k breaks, this zone will be the next critical reaction point.
105k – 104k:
Major long-term support (confluence of Fib extension + old demand zone).
In a bearish scenario, the price could test this zone before bouncing back up.
🌐 Market Sentiment & Expectations
After BTC was rejected at 117k, market sentiment has turned cautious and somewhat bearish in the short term.
However, many traders still expect BTC to hold above the EMA200 to trigger a rebound → if this level holds, sentiment may shift back to bullish, targeting 115k–117k again.
On the contrary, if the price breaks deep below 110k, the market may enter short-term panic and shift focus toward the strong support at 104k.

Slight decrease in the new week, accumulation above 3330⭐️GOLDEN INFORMATION:
Fed Chair Jerome Powell signaled openness to a rate cut at the September meeting, though persistent inflation pressures could complicate that outlook. Powell described the US economy as facing a “challenging situation,” noting inflation risks remain skewed to the upside while employment risks lean to the downside.
Following his remarks, traders boosted their bets on a 25 basis-point cut next month to nearly 85%, up from 75% prior to the speech, according to the CME FedWatch tool. Powell’s dovish tone could lend support to gold prices, as lower interest rates diminish the opportunity cost of holding the non-yielding metal.
⭐️Personal comments NOVA:
Gold price decreased and adjusted, pay attention to liquidity zones 3351, 3330
⭐️SET UP GOLD PRICE:
🔥SELL GOLD zone: 3400- 3402 SL 3407
TP1: $3388
TP2: $3373
TP3: $3360
🔥BUY GOLD zone: $3330-$3328 SL $3323
TP1: $3340
TP2: $3350
TP3: $3360
⭐️Technical analysis:
Based on technical indicators EMA 34, EMA89 and support resistance areas to set up a reasonable SELL order.
⭐️NOTE:
Note: Nova wishes traders to manage their capital well
- take the number of lots that match your capital
- Takeprofit equal to 4-6% of capital account
- Stoplose equal to 2-3% of capital account


Bitcoin Trendline Breakdown: The Pullback Trap Before Further DoBitcoin has officially broken its ascending trendline on the daily chart — a strong technical signal that the bullish momentum is weakening. Yesterday’s sharp pump was nothing more than a classic pullback to retest the broken trendline, and price is now showing signs of rejecting it.
From a price action perspective, this setup often acts as a trap for late buyers, with the market typically retracing the entire pullback move.
🔑 Key Points:
• Daily ascending trendline has been broken.
• Yesterday’s rally = pullback retest of the broken structure.
• Market likely to erase yesterday’s gains and resume downward momentum.
📊 Key Levels to Watch:
• Support 1: $112,000
• Support 2: $108,000
• Invalidation: A daily close back above yesterday’s high (~$117,000).
🎯 Trading Strategy:
• Wait for confirmation on lower timeframes (1H/4H) such as a CHoCH (Change of Character) or BOS (Break of Structure).
• Short entries become favorable if price fails to reclaim $117k.
• Initial targets: $112k → $108k.
• Keep stops above the recent swing high to control risk.
⚡ Summary:
The break + retest of the ascending trendline is a bearish sign. As long as BTC trades below the retest zone, the path of least resistance is down. Traders should stay patient, wait for proper entry signals, and avoid being trapped by the pullback.
⸻

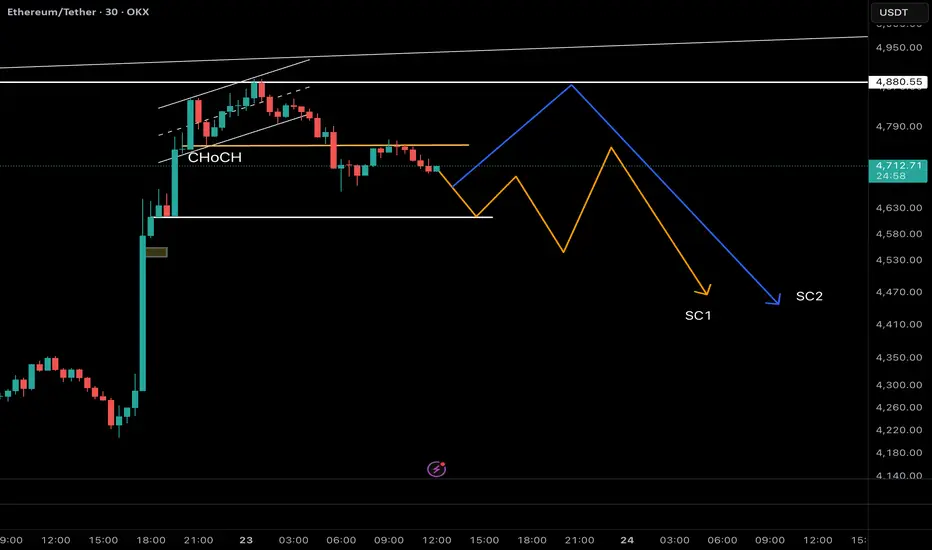
Ethereum Update: CHoCH Confirmed – Waiting for BOS & Wave C! As mentioned in my previous Ethereum analysis, ETH has completed its 5-wave impulsive rally and is currently inside wave B of a corrective ABC structure. Wave B often breaks above the wave ⑤ top to trap liquidity before a sharp wave C sell-off.
📊 Latest Price Action (30m TF):
• ETH has already shown a CHoCH by breaking the first key support at $4,753 and retesting it.
• The next crucial support lies at $4,613. If this level also breaks, it would confirm a BOS (Break of Structure) and strengthen the bearish case.
🔀 Two Possible Scenarios from Here:
1. Price retests the broken $4,753 level as resistance → then resumes the downtrend.
2. A deeper pullback toward $4,845 (acting as a left shoulder liquidity zone) → before the real wave C decline begins.
🎯 Trading Strategy:
• Wait for confirmation of BOS at $4,613.
• Once confirmed, look for bearish entry triggers (CHoCH / MSB) on lower timeframes.
• First targets: $4,100 → $3,800.
• Stop-loss invalidation above the swing high at $4,845 to maintain strict risk control.
⚠️ Remember: patience is key. Don’t get trapped in wave B’s fake breakouts — let the structure confirm wave C.
👉 Like & Follow to stay updated as we track ETH’s potential wave C move step by step!
BTC - Short Trade Plan Updated details for this BTC short below, with a lower entry than first plan.
DISCLAIMER - This is my personal trade only and I’m not advising you what to do with your money. Trading is risky and please use your own discretion and risk practices.
Fundamental analysis of this trade can be found on my prior posts.
Entry Range - 116,700 to 117,000
Stop Loss - 120,000
Target 1 - 88,000
Target 2 - 61,500
Target 3 - 35,000
Target 4 - 8,000
God speed. Let the dump begin.

short term adjustment, accumulation for uptrend ETH💎 ETH WEEKEND PLAN UPDATE (August 22 , 2025 )
ETH is in a medium-term uptrend, having just completed wave (5) according to Elliott Wave, and is now undergoing a slight correction.
The current price zone around 4,200 – 4,300 USD is a key area to watch:
• If it holds, ETH may rebound higher.
• If it breaks down, it could retreat to deeper support levels.
Key Levels
Near Resistance:
• 4,500 – 4,600 USD: Strong resistance zone, aligning with wave (5) and Fibonacci 1.618.
• If this level is broken, the next target is 6,000 USD (Fibo 2.618).
Near Support:
• 3,800 – 3,900 USD: Confluence with EMA34 and an intermediate support zone.
• 3,200 – 3,250 USD: Strong support, intersecting EMA200 and key Fibonacci cluster.
• 2,500 – 2,600 USD: Final support, a solid base before the last strong rally.
Trend Outlook
• Short-term: ETH may continue correcting towards support to accumulate before forming a new rally.
• Medium-term: The main trend remains bullish as long as ETH holds above 3,200 USD.
• Long-term: If ETH breaks above 4,600 USD, it is highly likely to target 6,000 USD.
👉 Summary:
ETH is in a consolidation phase after a strong rally. Investors should watch the 3,800 – 3,900 USD zone closely. If it holds, the chance of retesting 4,600 USD and potentially 6,000 USD remains strong.
