Silver - Next StopSilver has moved sharply higher, and the explosive upward trend is still ongoing.
The move from March to August 2020 can be considered wave 1 and the start of this bullish phase.
The question now is: where will we stop and potentially reverse? In other words, where might the next corrective phase begin.
Fibonacci levels drawn from the first wave and from the last significant corrective wave point to several key areas:
77 - the nearest level, which we have already passed without stopping
89 - the next most probable target
96 - applicable only to the current wave
Time will tell where the next stop occurs.
---
Please subscribe and leave a comment.
You’ll get new information faster than anyone else.
---
Si1! (Silver Futures)

Silver's Rally Is About To ExhaustSilver has outperformed gold with a huge margin this year
On the 4-hour chart the price perfectly fits into the blue uptrend channel
The 5-wave sequence is almost complete with the following signs of soon trend exhaustion:
1) triangle in the trend usually makes for wave 4 of 5 of (5)
2) price approaches the top of the channel for the third time already
3) RSI "doesn't buy" the current rally showing lower readings at Bearish Divergence
The strong support is located at the bottom of wave 4 at $56.4

Si1! - A "Short" Silver Heads-UpWhat we see on these two charts are two different Andrews Pitchforks.
- same time window
- different time period
- different pitchfork placement
The left chart maps the pendulum swings.
The right chart maps the real swings.
LEFT CHART
The market has almost reached the maximum stretch point, arriving at the U-MLH. A reversal toward the centerline is very likely, as the market tends to seek balance after such an extreme stretch. Classic mean reversion.
RIGHT CHART
Here we see that silver has reached the centerline - the classic 80% target for a pitchfork trader. From here, the market can break/zoom through the centerline, retest it, and continue upward. In the LEFT chart, this would correspond to a larger stretch toward Warning Line 1. Or the market may turn at the centerline because it has found its balance, which in the LEFT chart would confirm the stretch-and-turn scenario.
Either way, caution is warranted. I would at least take partial profits (50% is always good) and treat myself to an enjoyable Christmas party!
Anyone who would like to learn more about pitchforks, please read my bio here on TradingView.
Happy profits to you Silver Arrows §8-)

Silver = to the moon??? September 03, 2025Who’s Loading Up:
A top dog at Pan American Silver Corp., a heavyweight in North American silver digs, just scooped up a hefty chunk of shares.
Deal Size: This exec grabbed 50,000 shares at $22.50 a pop on August 28, 2025, dropping $1.125 million—talk about putting skin in the game!
Company Lowdown
Pan American Silver Corp. runs 10 mines across the Americas, packing 468 million ounces of silver and 6.7 million ounces of gold. Based out of Vancouver, they’ve got cash flowing like a river, fueling big bets like La Colorada Skarn and Escobal.
Sector Vibes:
• The Silver Institute’s calling for a fifth straight supply crunch in 2025, with photovoltaics and AI tech demand hitting all-time highs.
• Tariff threats, green energy boom, and a possible Fed rate cut in September 2025 could send silver soaring.
Big Funds Jumping In
Last quarter (June–August 2025), heavy hitters like Sprott Asset Management (+8% in Pan American), BlackRock Inc. (+5% in iShares Silver Trust), and Invesco Ltd. (+6% in VanEck Silver Miners ETF) piled into silver.
Buzz on X says Saudi Central Bank’s dipping its toes into silver via iShares Silver Trust (SLV), ditching its gold-only playbook.
London Vaults Drying Up
The LBMA’s silver stash is under siege from a supply deficit. With 150 million ounces short in 2024, the Silver Institute hints reserves might shrink 5–10% yearly if demand keeps raging, setting the stage for a price explosion.
1979 Boom & 2025–2026 Wild Cards
1979 Flashback: The Hunt Brothers’ silver grab, plus inflation and oil chaos, rocketed silver from $6 to $50/oz (+700%). Gold jumped from $300 to $850/oz on similar vibes.
2025–2026 Triggers:
Inflation’s sticky above 3%, the USD’s wobbling from tariffs, and a Fed cut looms in September 2025. Watch for U.S.-China trade wars, Middle East flare-ups, or a BRICS metals exchange—any could ignite a 1979-style silver rocket if deficits worsen.
Price Targets:
Short-Term (3 months): $60.00 (+46.9%)
Mid-Term (6–12 months): $120.00 (+193.7%)
Long-Term (18–24 months): $240.00 (+487.5%)
🤔🤔🤔🤔🤔🤔🤔🤔

Pre Open heads up on Gold. And overall draw. Bullish it isCOMEX:GC1!
Looking for higher prices on Gold. It should deliver towards the buyside and successive highs from here on. Need a CISD on the 4H timeframe

XAGUSD Is it on the brink of a Bear Cycle?Silver (XAGUSD) has formed the same kind of 1W RSI peak pattern as the one that marked the August 2020 Top of the previous Bull Cycle.
The confirmation signal for the Top on that Bull Cycle following an impressive 4-month rally (similar to the July - September 2025 one), was the price breaking below the 1D MA50 (red trend-line).
When that took place, the price violently dropped to the 0.382 Fibonacci retracement level. As a result, if we get again a 1D MA50 break-out (which is being tested persistently and holding), we expect Silver to start a new Bear Cycle and quickly decline to 38.000 (Fib 0.382). On the longer term, we may even see a bottom as low as 30.500 (Fib 0.618) based on the July - October 2022 bottom formation of the previous Bear Cycle.
Perhaps the most optimal indicator to call the bottom, hence the most optimal long-term buy, is the 1W RSI getting oversold at 30.00 as it happened perfectly another 3 times in the past 7 years.
---
** Please LIKE 👍, FOLLOW ✅, SHARE 🙌 and COMMENT ✍ if you enjoy this idea! Also share your ideas and charts in the comments section below! This is best way to keep it relevant, support us, keep the content here free and allow the idea to reach as many people as possible. **
---
💸💸💸💸💸💸
👇 👇 👇 👇 👇 👇

Silver (SLV): Multi-Year Cup & Handle SetupSilver appears to be repeating the same large-scale institutional “Cup and Handle” structure that played out almost perfectly on Gold.
The difference is that in SLV (iShares Silver Trust), the chart history is shorter, so the full formation is not as clearly visible — but if we reference the historical silver chart (since 1802), the pattern becomes unmistakable.
That long-term chart shows a massive multi-decade rounded base — the cup — and now price has already touched the upper boundary, effectively activating the pattern.
🧠 Technical Context
On the long-term silver chart, the handle represents the multi-year consolidation we’ve seen since the 2011 peak.
In SLV, this structure is compressed, but the correlation with physical silver remains ~99%, since the fund is backed by over 90% physical silver holdings.
This makes SLV an ideal instrument for expressing long-term silver exposure — it tracks spot silver almost tick-for-tick, while providing the liquidity and accessibility of an ETF.
Technically, silver has already tested the upper rim of the cup, confirming that the pattern is active.
This breakout will likely be followed by a short-term consolidation (the final part of the handle) before the market enters what could become a multi-year rally phase.
Based on historical fractals and volume structure, the first major pullback is expected toward the $35–25 zone, which corresponds to the previous 4th-wave cluster — a classic accumulation area in Elliott terms.
I’ll be looking to accumulate aggressively in the $35–30 range, scaling in gradually as price approaches those levels.
🎯 Trade Plan
Instrument: SLV (iShares Silver Trust ETF)
Correlation to Spot Silver: ~99%
Primary Support Zone (Accumulation): $25 – $35
Handle Breakout Level: around $50
Long-Term Target: $800+ (silver spot equivalent)
Stop-Loss: per individual risk management
Time Horizon: 5+ years
Once silver completes its consolidation and breaks above $50, the measured move of the Cup and Handle suggests a multi-hundred percent rally that could unfold over the next decade.
The breakout will likely be accompanied by rising institutional volume and strong follow-through momentum.
🧭 Strategic View
I trade silver exclusively through SLV, as it offers the most direct and reliable exposure to the underlying metal.
The fund’s near-perfect correlation with spot silver makes it ideal for implementing long-term accumulation strategies without the operational complexities of futures or CFDs.
This will be one of my core positions for the coming decade.
After the expected correction into the $30–35 range, I plan to build a large position, possibly hedged later on, and hold through the full bullish cycle.
Silver’s technical structure, macro fundamentals, and historical analogs all point toward a potential generational rally once this base completes.
This is the setup I’m positioning for — patiently, systematically, and with conviction.
Summary
Long-term “Cup and Handle” formation now confirmed
Final correction expected before the next secular rally
SLV offers near-1:1 tracking with physical silver
Accumulation zone: $35–25
Target: $800+ over the next decade

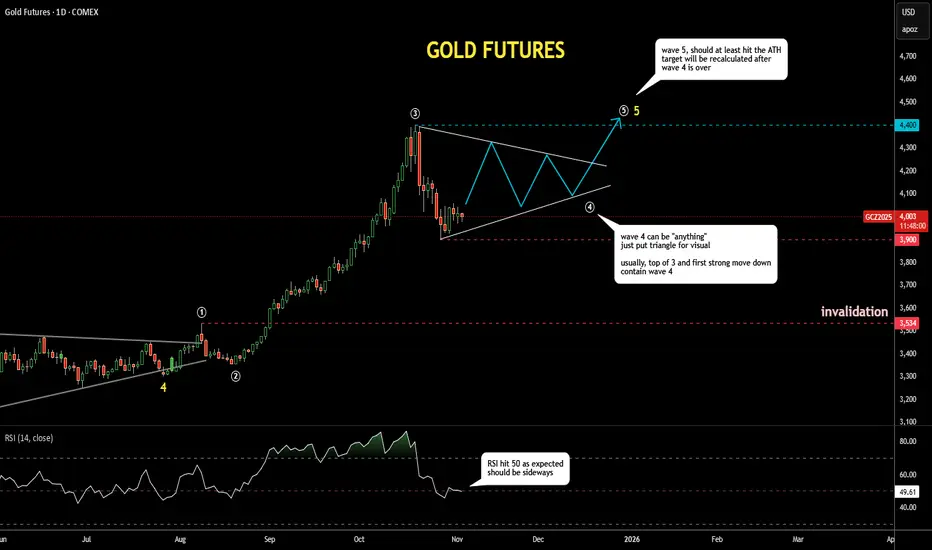
Gold Update 04NOV2025: Wave 4 Dropped Into Target AreaGold futures dropped into the pink-box target area based on the Fibonacci retracement between $3,750 and $4,000.
As expected, the RSI has reached the 50 “waterline”, where it could find some support and start moving around that level.
Many traders lose money in fourth waves, as they can be “anything” and often last longer than one’s pocket. I’ve outlined a triangle shape in wave 4 just for visual context.
The range built through the peak of wave 3 around $4,400 and the bottom of recent panic selling near $3,900 will likely contain most of the volatility in wave 4.
It can take time… testing one’s patience.
Gold | Oil | Dollar | Silver | Natural Gas Price ForecastGold | Oil | Dollar | Silver | Natural Gas Price Forecast
AMEX:BOIL AMEX:KOLD NYMEX:CL1! COMEX:GC1!

SI1! - Dancing on the SILVER Tracks🔱 I like risk. Specially when it's skewed to my favor 🔱
WL1 has been reached, and the market is wildly overextended.
Is it crazy to stand in front of this speeding train?
Absolutely — if you don’t know when to jump.
I’ve done my warm-up, and I’m ready to leap off the rails the moment it gets too close, too fast.
My move is with options — that means my risk is defined, my escape route mapped.
I would never short the underlying — not in a million years.
Now let’s see if this setup earns me that Steak & Lobster target.

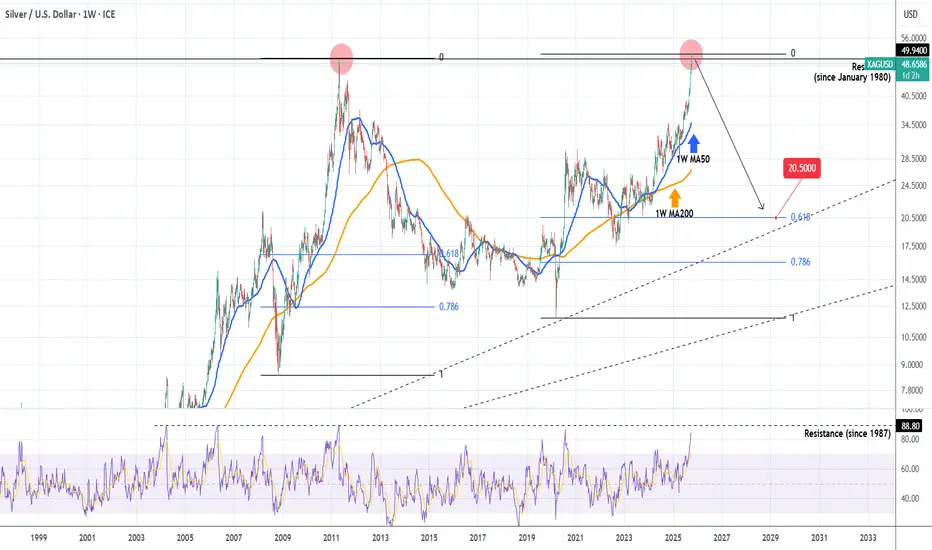
SILVER made new ATH. Multi-year Bear Cycle starting.Last time we took a look at Silver (XAGUSD) (August 22, see chart below), we had a clear buy signal on its 1D MA50 at the bottom of the Channel Up, that quickly hit our 4050 Target:
The pattern even broke aggressively upwards and this week crossed the 49.9400 Resistance, which is the All Time High (ATH) from April 18 2011. Essentially that was also the High of the long forgotten January 1980 Top!
Needless to say, cyclical behavior indicates that this is where the market sells and starts new multi-year (2-3) Bear Cycles. The 1W RSI comes to confirm that, as it is only a few points off he 88.80 Resistance, which has been the ultimate sell signal since 1987.
We expect the market to decline to at least the 0.618 Fibonacci retracement level at 20.500, which is also where the first key Higher Lows trend-line (dashed) is.
-------------------------------------------------------------------------------
** Please LIKE 👍, FOLLOW ✅, SHARE 🙌 and COMMENT ✍ if you enjoy this idea! Also share your ideas and charts in the comments section below! This is best way to keep it relevant, support us, keep the content here free and allow the idea to reach as many people as possible. **
-------------------------------------------------------------------------------
💸💸💸💸💸💸
👇 👇 👇 👇 👇 👇
SILVER (XAGUSD): Strong For Weeks! Continue To Buy! It!In this Weekly Market Forecast, we will analyze the XAGUSD (SILVER) for the week of Sept. 22 - 26th.
Silver has been strong for weeks. The industries continue strong demand from solar, electric vehicles and electronics. That, combined with supply constraints, continues to lend support to silver.
Bullish FVGs, bullish BOSs, and OLHC candles point to higher prices.
No reason to short this market.
Enjoy!
May profits be upon you.
Leave any questions or comments in the comment section.
I appreciate any feedback from my viewers!
Like and/or subscribe if you want more accurate analysis.
Thank you so much!
Disclaimer:
I do not provide personal investment advice and I am not a qualified licensed investment advisor.
All information found here, including any ideas, opinions, views, predictions, forecasts, commentaries, suggestions, expressed or implied herein, are for informational, entertainment or educational purposes only and should not be construed as personal investment advice. While the information provided is believed to be accurate, it may include errors or inaccuracies.
I will not and cannot be held liable for any actions you take as a result of anything you read here.
Conduct your own due diligence, or consult a licensed financial advisor or broker before making any and all investment decisions. Any investments, trades, speculations, or decisions made on the basis of any information found on this channel, expressed or implied herein, are committed at your own risk, financial or otherwise.

Gold | Oil | Dollar | Silver | Natural Gas Price ForecastGold | Oil | Dollar | Silver | Natural Gas Price Forecast
NYMEX:NG1! AMEX:UNG AMEX:BOIL PEPPERSTONE:NATGAS

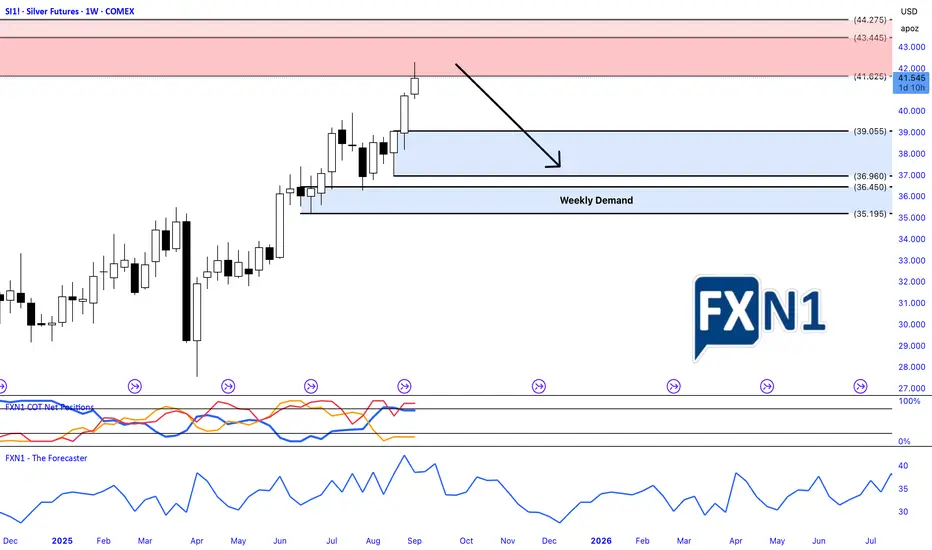
Silver Trade Insights: Supply Levels, Seasonality and COTI have initiated a short position in silver as the price approaches a significant weekly supply zone. This entry was strategically determined based on an intra-day supply level identified on the daily chart. My outlook is primarily bearish, supported by seasonal patterns suggesting a potential downward trend. Additionally, non-commercial traders and institutional investors have been increasing their short positions, while retail traders continue to build long positions. I'm anticipating a possible trend reversal, but I also remain cautious of a retest of my designated supply area before any decisive move. As always, I recommend conducting thorough personal research before making any trading decisions.
✅ Please share your thoughts about Silver in the comments section below and HIT LIKE if you appreciate my analysis. Don't forget to FOLLOW ME; you will help us a lot with this small contribution.
Gold | Oil | Dollar | Silver | Natural Gas Price ForecastGold | Oil | Dollar | Silver | Natural Gas Price Forecast
COMEX:GC1!
COMEX:SI1!
AMEX:UNG
NYMEX:CL1!

Gold | Oil | Dollar | Silver | Natural Gas Price Forecast Support & Resistance Guide
Natural Gas NYMEX:NG1! stock Bulls AMEX:UNG
USO NYMEX:CL1! Oil Stock price Forecast
DXY US dollar Stock analysis
Gold COMEX:GC1! XAUUSD Stock price Forecast
Silver XAGUSD stock analysis

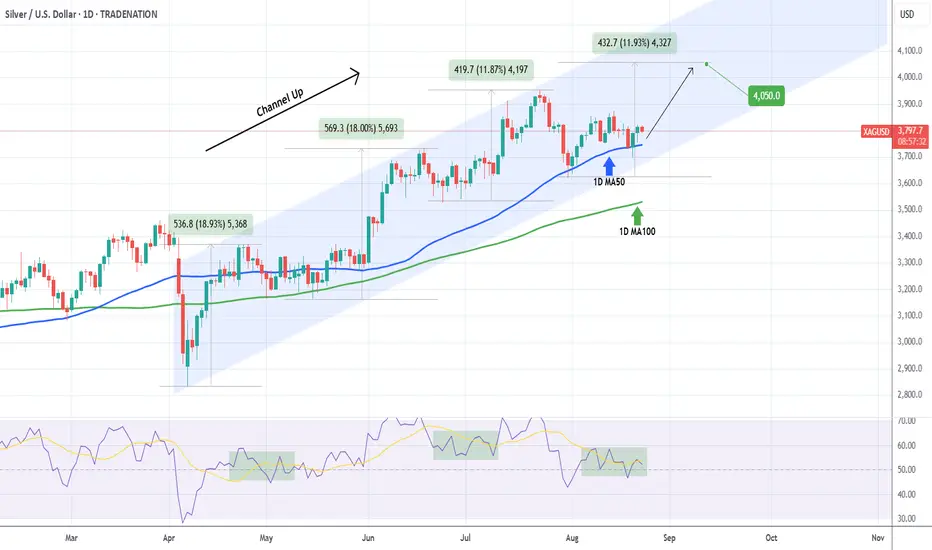
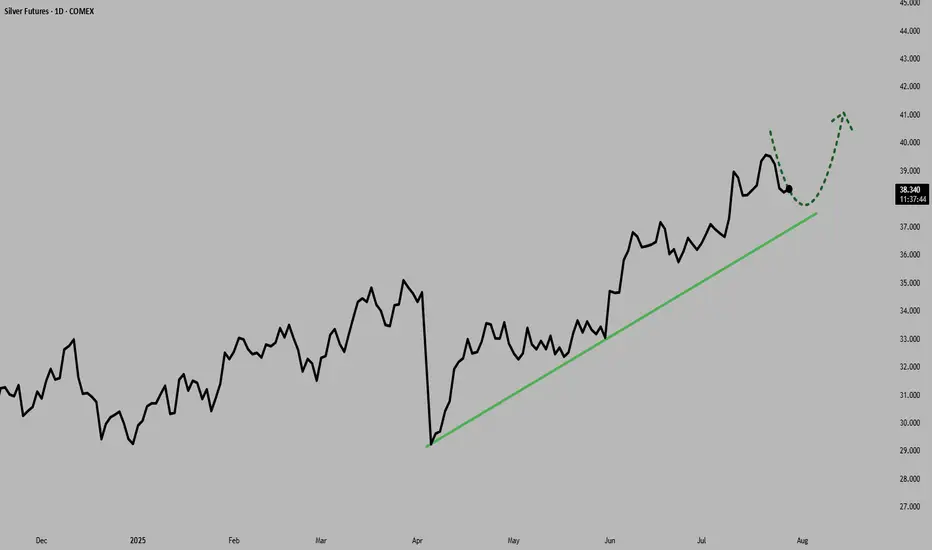
XAGUSD Channel Up still valid, targeting $40.500.Silver (XAGUSD) has been trading within a Channel Up pattern since the April 07 market bottom. Right now it is consolidating with the 1D MA50 (blue trend-line) acting as Support, following the recent 1-month pull-back.
We have seen the very same consolidation pattern after every Higher High, as also shown on the 1D RSI.
As long as it holds, this is a strong buy opportunity near the bottom of the Channel Up, targeting $40.50 based on the +11.90% rise that the previous Bullish Leg did.
-------------------------------------------------------------------------------
** Please LIKE 👍, FOLLOW ✅, SHARE 🙌 and COMMENT ✍ if you enjoy this idea! Also share your ideas and charts in the comments section below! This is best way to keep it relevant, support us, keep the content here free and allow the idea to reach as many people as possible. **
-------------------------------------------------------------------------------
Disclosure: I am part of Trade Nation's Influencer program and receive a monthly fee for using their TradingView charts in my analysis.
💸💸💸💸💸💸
👇 👇 👇 👇 👇 👇
Silver Near $40: Deficits and Demand Fuel the RallySilver prices surged to multi-year highs in July 2025, driven by an extraordinary convergence of bullish factors, pushing prices above $39 per ounce, levels last seen in 2011.
Silver’s rally, supported by robust industrial demand and safe-haven inflows, aligns with traditional patterns as the U.S. dollar has weakened over 2.3% over the recent period.
Macroeconomic Drivers and the U.S. Dollar
Silver's rally is unfolding around shifting macro conditions. The Federal Reserve has kept interest rates at a restrictive 4.25-4.50% throughout 2025 due to persistently high inflation (2.7% YoY). However, expectations for more rate cuts are growing, with the CME FedWatch tool showing a 59.8% probability of a cut at the September meeting as of July 28.
Adding to the complexity, U.S. trade policies have triggered significant market volatility and raised concerns over a potential supply shock. The U.S. administration has imposed steep 30% tariffs on imports from Mexico, set to resume on August 1. This has heightened fears, as Mexico is the world’s largest silver producer and supplies over half of U.S. silver imports.
But macro drivers aren’t the full story. The real force behind silver’s rally lies in the physical market itself. A structural supply deficit, escalating industrial demand, and growing investor appetite from Asia and North America, are proving to be far more pivotal than shifting rates or a softer dollar.
Physical Market Dislocation and Industrial Demand
The year 2025 marks the fifth consecutive year of a structural deficit in the global silver market, and the imbalance between supply and demand shows no sign of easing.
With minimal new mining capacity expected to come online and lengthy lead times for project development, supply constraints are structural rather than temporary.
Since 2021, the cumulative shortfall has reached nearly 800 million ounces (25,000 tons), steadily drawing down available inventories and tightening the market.
Industrial demand remains the central pillar of silver’s bull market. Forecasts for 2025 project record consumption of roughly 700 million ounces, driven by rapid adoption in green technologies and digital infrastructure. The electrical and electronics sector, which includes solar photovoltaics (PV), consumer electronics, automotive electronics, power grids, and 5G networks, has increased its silver usage by 51% since 2016.
Solar PV alone consumed approximately 197.6 million ounces in 2024, a record largely driven by China’s 45% expansion in solar capacity. With global EV production expected to approach 20 million units in 2025, automotive silver demand alone could exceed 90 million ounces.
Together, persistent deficits, accelerating industrial consumption, and capital flowing into physically backed investment vehicles are creating a market where available silver is increasingly scarce, amplifying upside pressure on prices regardless of short-term macroeconomic shifts.
COMEX silver inventories peaked at 504.72 million ounces on May 11 but have since eased back to levels last seen on April 24, indicating a recovery in demand following the large accumulation in US inventories post-tariff shock.
Positioning and Ratios Favour Gains
With net inflows of 95 million ounces in the first half of 2025, silver ETP investment has already surpassed the total for all of last year. By June 30, global silver ETP holdings reached 1.13 billion ounces, just 7% below their highest level since the peak of 1.21 billion ounces in February 2021
Futures positioning has also surged , with long positions up 163% over six months. These factors have helped propel silver prices over 35% higher year-to-date, building on a 21% gain in 2024.
The iShares SLV ETF netted inflows of $1,467.5 million over the past 3 months.
Physical silver investment demand remains robust, with significant buying from Asian markets. India, the world’s leading silver importer, saw record purchases of physical bullion and silver-backed ETFs during the first six months of 2025.
The gold-to-silver ratio, currently in the late 80s, remains historically elevated, suggesting silver remains significantly undervalued compared to gold. This indicates substantial upside potential for silver, especially given persistent market deficits, rising industrial and investment demand, and gold rising at the same time.
Hypothetical Trade Set-up
The silver market’s bullish fundamentals appear increasingly robust. Investors may consider accumulating silver positions, viewing short-term consolidations as attractive buying opportunities amid the compelling long-term outlook.
Options open interest for the September contract shows a bullish bias with a put/call ratio of 0.82 and high call interest at the far out-of-the-money call strike of $45 per ounce.
To express a bullish view on silver, investors can deploy a long position in CME Silver futures expiring in September. A hypothetical trade setup for this view is described below.
● Entry: $38.00 per ounce
● Target 1: $40.00 per ounce
● Target 2 (extension): $42.00 per ounce (if Fed easing in September coincides with physical tightness)
● Stop Loss: $36.70 per ounce
● Profit at Target 1: $10,000
● Profit at Target 2: $20,000
● Loss at Stop: $6,500
● Reward-to-risk ratio: 1.54 (Target 1) and 3.08 (Target 2)
Alternatively, investors can exercise the same view using CME Micro Silver futures, which offer smaller notional positions and more flexibility. Each Micro contract is priced in USD per ounce and represents 1,000 ounces of silver, compared to 5,000 ounces for the standard contract.
MARKET DATA
CME Real-time Market Data helps identify trading set-ups and express market views better. If you have futures in your trading portfolio, you can check out on CME Group data plans available that suit your trading needs tradingview.com/cme .
DISCLAIMER
This case study is for educational purposes only and does not constitute investment recommendations or advice. Nor are they used to promote any specific products, or services.
Trading or investment ideas cited here are for illustration only, as an integral part of a case study to demonstrate the fundamental concepts in risk management or trading under the market scenarios being discussed. Please read the FULL DISCLAIMER the link to which is provided in our profile description.
SI1!: Silver Demand Zone: Possible Bullish ContinuationI am currently observing a potential long-term continuation on SI1! Silver (XAG/USD), as the Commitment of Traders (COT) data indicates an increase in positions from both commercial and non-commercial traders. The price is approaching a demand zone on the daily chart, suggesting a possible bullish move.
The recent price action originated from an initial spike in the monthly supply zone, but there’s a possibility that the price could continue to rise further before reaching the next supply zone where a reversal might occur. Given the daily timeframe, I view this setup as suitable for a scalp trade. In my opinion, this presents an opportunity for short-term traders to capitalize on the potential upward movement.
✅ Please share your thoughts about SI1! in the comments section below and HIT LIKE if you appreciate my analysis. Don't forget to FOLLOW ME; you will help us a lot with this small contribution.
Natural Gas | Oil | Dollar | Silver | Gold Price Forecast.Natural Gas | Oil | Dollar | Silver | Gold Price Forecast.
NYMEX:NG1! AMEX:UNG NYMEX:CL1! COMEX:GC1!

Natural Gas | Oil | Dollar | Silver | Gold Price Forecast.Natural Gas | Oil | Dollar | Silver | Gold Price Forecast.
NYMEX:NG1! AMEX:UNG NYMEX:CL1! COMEX:GC1!

Silver: Daily Reversal Possible at Supply ZoneI'm anticipating a potential daily reversal in silver prices. Retail traders are maintaining a bullish stance, while commercial traders remain heavily short. The current price action suggests a possible reaction to a key supply area. What are your thoughts on the likelihood of a reversal, and what technical indicators might support or refute this potential shift?
✅ Please share your thoughts about SI1! in the comments section below and HIT LIKE if you appreciate my analysis. Don't forget to FOLLOW ME; you will help us a lot with this small contribution.

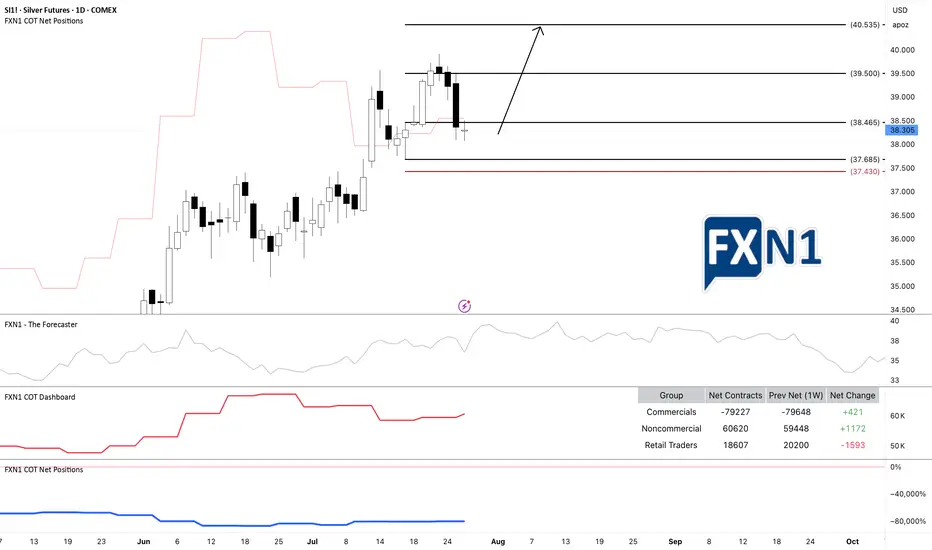
XAGUSD Strong accumulation waiting for a break-out. Silver (XAGUSD) has been trading within a 3-month Channel Up pattern and since the June 18 Higher High, it has entered a Descending Triangle.
This has previous been an Accumulation pattern, which after broken to the upside, it led to June's High. Similarly, we expect a bullish break-out once the 4H RSI breaks above its MA, and as long as the 4H MA200 (orange trend-line) holds, we expect a +15.50% minimum rise (like the first Bullish Leg of the Channel Up), with our Target se at 40.500.
-------------------------------------------------------------------------------
** Please LIKE 👍, FOLLOW ✅, SHARE 🙌 and COMMENT ✍ if you enjoy this idea! Also share your ideas and charts in the comments section below! This is best way to keep it relevant, support us, keep the content here free and allow the idea to reach as many people as possible. **
-------------------------------------------------------------------------------
💸💸💸💸💸💸
👇 👇 👇 👇 👇 👇
