BRIEFING Week #3 : ETH and OilHere's your weekly update ! Brought to you each weekend with years of track-record history..
Don't forget to hit the like/follow button if you feel like this post deserves it ;)
That's the best way to support me and help pushing this content to other users.
Kindly,
Phil
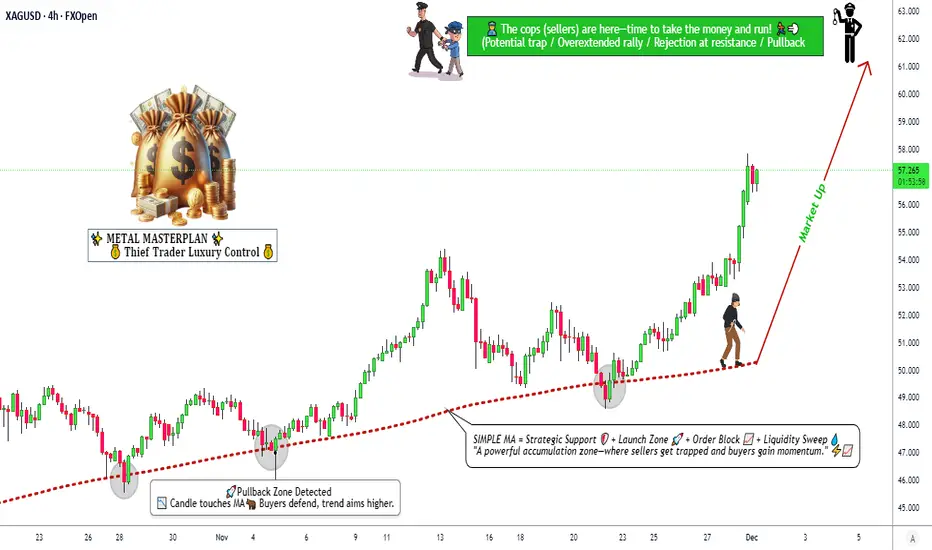
Silver

SILVER BULLISH CONTINUATION|LONG|
✅SILVER remains in a strong bullish structure after the impulsive rally, with shallow pullbacks holding above the demand zone. As long as price stays supported, continuation toward higher liquidity and premium targets is favored. Time Frame 5H.
LONG🚀
✅Like and subscribe to never miss a new idea!✅

Strong Bullish Structure Developing in Silver🚀 XAG/USD (SILVER) Swing Blueprint | Bullish Structure Intact | Key Levels Mapped! ⚔️
🎯 Metals Market Opportunity: Silver (XAG/USD) Swing Trade Setup
📈 Direction: Bullish | Swing Trade
🏷 Asset: XAG/USD - Silver vs. U.S. Dollar
⚖️ Core Thesis: Silver is building a potential swing bullish structure, aiming for a significant resistance zone. This plan outlines the key framework.
📊 Trade Plan (Blueprint)
✅ Entry Zone: Consider entries on pullbacks or strength confirmation. (Any price level entry - discipline is key).
🛑 Stop Loss (Risk Management):
"This is thief SL @ 54" 💎
Dear Traders (The OG Crew), 👊
This is my protective level. YOU MUST adjust your SL based on YOUR OWN risk tolerance & strategy. I do not recommend using only my level. Manage your capital wisely.
🎯 Target Zone: @ 62 Area.
This aligns with a strong historical resistance + potential overbought/trap zone. 🪤 The strategy is to "escape with profits" as price approaches.
Note: This is my target. Take profits based on your own analysis and risk-reward goals.
🔍 Related Pairs & Market Correlations (Must-Watch) 🔗
Monitoring these pairs provides context for Silver's move:
🦅 TVC:DXY (U.S. Dollar Index):
Key Point: INVERSE correlation. A weaker TVC:DXY typically boosts commodities priced in USD, like Silver. Watch for DXY breakdowns for added Silver bullish confirmation.
🟡 XAU/USD (Gold):
Key Point: STRONG positive correlation. Gold is the leader. A strong, bullish Gold market often drags Silver higher (and vice-versa). Silver's moves can be more volatile ("Gold on steroids").
📈 US 10-Year Treasury Yields / TVC:TNX :
Key Point: General inverse relationship. Rising real yields can pressure non-yielding metals. Watch for yield pullbacks that may relieve pressure on Silver.
⛽️ Crude Oil ( BLACKBULL:WTI / ICMARKETS:XBRUSD ):
Key Point: Inflation/Commodity Sentiment Gauge. Rising oil can signal broader commodity strength and inflation fears, which can benefit Silver as a real asset.
📊 Copper ( CAPITALCOM:COPPER ) & AMEX:GDX (Gold Miners ETF):
Key Point: Industrial / Risk Sentiment. Copper confirms industrial demand outlook. AMEX:GDX strength confirms bullish precious metals sector momentum.
💎 Final Notes
This is a blueprint, not financial advice.
You are the captain of your own capital. 🧭
Always use proper position sizing.
Markets are dynamic—always monitor for structure breaks.
Let's get this bread... responsibly! 🥖
✅ Like & Follow if you find this detailed blueprint valuable! It helps the idea reach more traders. 💡
#SILVER #XAGUSD #TradingSetup #SwingTrading #Commodities #PreciousMetals #Forex #TradingView #DXY #GOLD #XAUUSD #Analysis
Trump's Greenland Tariff 10% on NATO from 1st Feb 2026📢 Statement That Shook Global Diplomacy
Former U.S. President Donald J. Trump has announced a historic geopolitical and economic escalation, directly linking Greenland acquisition with tariff punishment on major European nations.
From February 1, 2026 → 10% tariff
From June 1, 2026 → 25% tariff
On:
🇩🇰 Denmark
🇳🇴 Norway
🇸🇪 Sweden
🇫🇷 France
🇩🇪 Germany
🇬🇧 United Kingdom
🇳🇱 Netherlands
🇫🇮 Finland
Until Greenland is fully purchased by the USA.
🧠 Why Greenland Is So Important
Trump highlighted Greenland as critical for:
✔ Missile defense systems (Golden Dome)
✔ Arctic military dominance
✔ Control of North Atlantic routes
✔ Rare earth & mineral resources
✔ Strategic positioning vs China & Russia
✔ Future space and satellite defense geometry
In modern warfare, location = power.
⚠ What Makes This Statement Extremely Dangerous
Trump directly said:
“World Peace is at stake.”
Which means:
• NATO unity is at risk
• EU–US relations face direct stress
• Arctic militarization increases
• China & Russia involvement becomes aggressive
• Global security architecture destabilizes
This is no longer a trade issue — this is military geopolitics.
💥 Immediate Economic Impact
1️⃣ European Exports to USA
A 25% tariff will:
• Hurt EU auto exports
• Hurt machinery exports
• Hurt pharmaceutical trade
• Hurt luxury brands
• Raise US inflation on imports
• Reduce EU corporate profits
European stock markets will face structural selling pressure.
2️⃣ Currency Market Impact
🇪🇺 EUR → Weak
🇬🇧 GBP → Weak
🇺🇸 USD → Strong initially
But long term → USD also becomes unstable due to trade retaliation risk.
3️⃣ Global Trade War Revival
This officially reopens:
🔥 US vs EU Trade War
🔥 NATO political fracture
🔥 WTO disputes
🔥 Retaliatory tariffs
🔥 Supply chain realignment
🪙 Impact on Gold & Silver
This statement is EXTREMELY BULLISH for Bullion.
Because:
✔ Geopolitical fear rises
✔ Trade war risk rises
✔ Currency trust weakens
✔ Defense spending increases
✔ Inflation expectations increase
✔ Central bank gold buying increases
📈 Gold Reaction
Gold benefits from:
• Political instability
• Trade conflict
• Military tension
• Currency risk
• Safe-haven demand
➡ Gold becomes strategic asset, not just commodity.
📈 Silver Reaction
Silver gains from:
• Industrial defense demand
• Green technology usage
• Electronics
• Investment shift
Silver becomes hybrid asset: Industrial + Safe haven.
🔥 Why Trump Uses Tariffs As Weapons
Trump does not use tariffs for economics.
He uses tariffs as:
🛡 Political pressure
🛡 Negotiation tool
🛡 Strategic leverage
🛡 Military diplomacy
🛡 Psychological warfare
This is economic warfare model.
🌐 NATO & EU Risk Factor
Trump’s statement directly challenges:
• NATO authority
• European sovereignty
• Arctic territorial balance
• Denmark’s control legitimacy
This may lead to:
⚠ EU military alignment against US
⚠ NATO internal conflict
⚠ Arctic militarization
⚠ Increased Russian activity
⚠ Chinese Arctic ambitions
🧩 Why This Is Bullish for Long-Term Gold
Because the world is entering:
✔ Multi-polar power struggle
✔ Currency fragmentation
✔ Military competition
✔ Trade nationalism
✔ Strategic resource wars
Gold thrives in chaos cycles.
📊 Tradeline Capital View
We clearly believe:
🟡 Gold is no longer just inflation hedge
🟡 Gold is becoming geopolitical insurance
🟡 Silver is following strategic industrial demand
🟡 Trade wars guarantee long-term upside
📌 Trading Psychology
Every geopolitical escalation:
➡ Creates volatility
➡ Creates opportunity
➡ Creates trend continuation
➡ Creates panic buying
➡ Creates hedging demand
And bullion benefits the most.
🔮 Forward Outlook
If this tension continues:
Gold can test new historic highs
Silver can accelerate sharply
USD volatility will increase
Equity markets will remain unstable
🧠 Final Conclusion
Trump’s Greenland tariff threat is:
✔ Not a political drama
✔ Not a media stunt
✔ Not a temporary threat
It is a long-term strategic restructuring of global power.
And whenever power restructures…
👉 Gold rises
👉 Silver follows
👉 Risk assets suffer
🏷 Tradeline Capital Note
We strongly advise investors and traders to:
✔ Track geopolitical statements daily
✔ Not ignore tariff politics
✔ Not underestimate Trump policy power
✔ Keep bullion exposure strategic
Because markets don’t move only on numbers — they move on power.
Stay on Buy Side on any price with back up Trade weekly or Positional only this news makes open Buy again in Bullion
🌍 Trump’s Greenland Tariff Bombshell: Global Trade, Security & Bullion Market Impact

Silver Fractal Analysis $50 short time frame analysis, silver could go much higher than $50.
this is however just a short term analysis, until we break resistance and turn support $50 is the target price.

SILVER Will Keep Growing! Buy!
Hello,Traders!
SILVER remains firmly bullish after an impulsive expansion from the demand zone. Structure continues to print higher highs and higher lows, showing strong buyer control. Any brief dips are likely accumulation phases before continuation into overhead buy-side liquidity. Time Frame 4H.
Buy!
Comment and subscribe to help us grow!
Check out other forecasts below too!
Disclosure: I am part of Trade Nation's Influencer program and receive a monthly fee for using their TradingView charts in my analysis.

STRIKEPOINT GOLDOTC:STKXF
Great North American Jurisdictions with global tensions and currency debasement. American jurisdictions could prosper.

Silver bound for a bigger correction?HTF EMA's pointing downwards
First 0.618 retracement from ATH hit Jan 16 - subtle rebound happening now
Next week will show if the current retracement will hold. If not, the next 0.618 retracement level down touches previous ATH's, then rebounds higher.

Is The Price Of Silver Telling Us What The Dollar Is Going To DoTrading Fam,
I am sensing some events on the horizon, and the charts seem to confirm what I am feeling. I want to let you know what I am seeing. We’ll talk Silver, the dollar, S&P500, Bitcoin, and Ethereum in this video. Don’t shoot the messenger.
✌️Stew

My Silver Analysis - Simple & Clear🧠 My Silver Analysis - Simple & Clear
Right now, this silver chart is showing me where price is likely to hesitate or move next by using a few key technical ideas:
📈 1. Where the Trend Is Headed
I’m watching the overall movement of price, whether it’s making higher highs and higher lows (uptrend) or lower highs and lower lows (downtrend). Trends help me decide if buyers or sellers are currently in control.
How to spot it:
If each peak is above the last and each low is above the previous low = bullish.
If peaks and lows keep dropping = bearish.
This structure is the backbone of my directional bias.
📊 2. Support & Resistance Zones
Instead of guessing, I draw zones (not exact numbers) where price has reacted repeatedly in the past, these are likely areas where traders have shown strong interest: buyers around support, sellers around resistance.
What this tells me:
Price may stall or bounce off these zones.
If price breaks through them with conviction, it often accelerates into the next zone.
Think of support as a floor buyers defend, and resistance as a ceiling sellers fight to keep price below.
📉 3. Trendlines & Price Structure
I connect significant swing lows and highs with smooth lines, these aren't perfect, but they help visualize pressure points where price tends to react.
A rising trendline below price supports bullish momentum.
A falling trendline above price highlights selling pressure.
If price breaks a key trendline and fails a retest, that’s often a signal things are changing, either shifting trend or entering a period of range movement.
🔁 4. Momentum and Confirmation
I don’t rely on just one factor, so if price hits a support zone and there’s a bullish pattern (like a strong bounce candle), I feel more confident in a buy idea.
The opposite is true for bearish moves.
I look for confirmation, not just hope:
Strong closed candles in the direction of my bias
Break + retest setups
Confluence of zones, trendlines, and patterns
This helps me avoid fake moves and get clearer on potential target and stop levels.
✍️ Putting It All Together
So in my own words, the chart is telling me something like:
“Price is approaching a key zone where buyers and sellers have historically shown interest. If it holds here, we could see a bounce back toward the recent highs. But if sellers overwhelm and price breaks the zone with conviction, the next level below becomes the target. I’ll be watching how price reacts at that level for clues about the next leg.”
🎯 Why This Helps Me
This kind of breakdown lets me:
✅ Trade with structure instead of guesswork
✅ Set clear levels for entries and exits
✅ Manage risk by knowing where my bias is invalidated

XAGUSD Is this insane Bull Cycle coming to an end?Silver (XAGUSD) has been on a remarkable rally since the April 2025 low when a period of consolidation ended. This is technically the Bullish Leg of Silver's 24-year Channel Up and it may be coming to an end as it is approaching the top (Higher Highs trend-line) of that pattern.
On top of that, the 1M RSI just hit the Higher Highs trend-line that has been in effect since the March 2004 High but since the Bearish Leg isn't exhausted yet, we may see it rise up to Higher Highs 2, which is the trend-line of its own RSI Bull Cycle.
When the previous Bull Cycle topped in April 2011, it started the new Bearish Leg (Bear Cycle) that bottomed after 56 months on both the 0.5 Fibonacci retracement level and the 1M MA200 (orange trend-line).
As a result, if we are to make a very long-term macro estimate of where Silver may correct to and turn into a buy again (long-term),that would be $37.000.
---
** Please LIKE 👍, FOLLOW ✅, SHARE 🙌 and COMMENT ✍ if you enjoy this idea! Also share your ideas and charts in the comments section below! This is best way to keep it relevant, support us, keep the content here free and allow the idea to reach as many people as possible. **
---
💸💸💸💸💸💸
👇 👇 👇 👇 👇 👇

Stop!Loss|Market View: USDCAD🙌 Stop!Loss team welcomes you❗️
In this post, we're going to talk about the near-term outlook for the USDCAD currency pair☝️
Potential trade setup:
🔔Entry level: 1.38655
💰TP: 1.40086
⛔️SL: 1.37995
"Market View" - a brief analysis of trading instruments, covering the most important aspects of the FOREX market.
👇 In the comments 👇 you can type the trading instrument you'd like to analyze, and we'll talk about it in our next posts.
💬 Description: This currency pair maintains its buy priority after successfully completing the previous trading idea. In the medium term, the 1.41000 - 1.42000 range is considered a target. A short-term entry point is likely to be found near 1.38580, where a false breakout scenario is most likely.
Thanks for your support 🚀
Profits for all ✅

Silver impresses again with big recoveryToday’s US data has lifted the dollar across the board and you’d have thought precious metals would have sold off, or come under some pressure. But the metals were both lower earlier in the session and have actually managed to recover quite impressively off their lows. Once again, precious metals are ignoring US data. This is quite impressive from silver, which was down some 7% at one stage overnight. Now, it has broken its resistance trend on the hourly chart and another ATH looks to be incoming...
By Fawad Razaqzada, market analyst with FOREX.com

Y'all are still watching NVDA? Bloom ($BE) is the "Missing Link"I know, everyone loves the "Chip Trade." But if you have been following my analysis, you know we aren't chasing the past. We are hunting the infrastructure.
🧩 The "AI Trinity" is Finally Complete We have been tracking three critical pillars of the physical AI revolution.
The Vault ( NASDAQ:WDC ):
We caught the storage breakout because AI needs massive data memory.
(See my previous WDC idea).
The Conductivity ( TVC:SILVER ):
We tracked the "Cup & Handle" breakout because AI hardware needs silver's conductivity.
(See my previous Silver idea).
The Power ( NYSE:BE ): This was the missing link. Until now.
👀 The "Receipts"
I just ran Bloom Energy ( NYSE:BE ) through the relative strength scanner. While retail is still arguing about Nvidia, look at what the "Power Trade" is actually doing:
vs NVDA: Bloom is outperforming by +336.1%
vs BTC: Bloom is outperforming by +552.1%
vs MSFT: Bloom is outperforming by +469.1%
⚡ Why NYSE:BE fits the "Eco-System" Trade It is simple physics.
NASDAQ:WDC stores the data.
TVC:SILVER moves the data.
NYSE:BE powers the data.
The US Power Grid is full. It takes 5-7 years to build new transmission lines.
Bloom Energy is the only company that can drop a "Power Plant in a Box" (Fuel Cells) in a parking lot in 90 days. The recent $2.65 Billion deal with AEP proves the utilities are panicking. They need this tech to keep the lights on for the AI Vaults we are trading.
The Verdict: The "Chip Trade" was 2024-2025.
The "Infrastructure Trade" (WDC, Silver, BE) is 2026. Don't be the guy holding the bag on flat tech stocks while the real physical ecosystem goes parabolic.
Do you have the full "Trinity" (Storage, Metal, Power) in your portfolio? Let's discuss below.

SILVER BLOWOFF TOP I AM NOW LONG PUTS IN THE MONEYThe chart posted is that of Silver ETF I have taken a 75 % position in deep in the money PUTS just now at 82.5 We are coming into the GANN date which is Jan 18 but that is a sunday So I am in a rather good spot .best of trades WAVETIMER

Silver +144% in 2025 and another +28.7% in 2026FreshForex analysts note that in 2026, the key benchmarks for silver (XAGUSD) will remain Fed decisions, movements in the US dollar and real yields, the supply–demand balance, and investor flows into metals.
Demand for silver (XAGUSD) is picking up — here’s what’s behind its growth:
The Fed may cut rates → holding funds in bonds and deposits becomes less attractive, increasing interest in metals.
The dollar is weakening → silver priced in dollars usually becomes more expensive.
Markets are nervous → investors more often buy “safe-haven” assets, including silver.
Silver is essential for industry (electronics, solar panels) → industrial demand supports prices.
Speculators and funds are stepping in → as prices rise, new buyers enter the market, strengthening the trend.
Silver (XAGUSD) is supported by two factors at once — safe-haven demand and industrial consumption — which is why silver may grow faster than gold.

Gold-to-Silver Ratio at 15-Year LowsGold-to-Silver Ratio pulled back sharply after President Trump paused new tariffs on critical minerals. The announcement eased near-term trade risks, leading to profit-taking after record highs above $93/oz. Despite the correction, silver remains up over 25% YTD, supported by robust industrial demand and tight supply.
Policy Context
The U.S. administration’s decision to delay tariffs on critical minerals (including silver, lithium, cobalt, and rare earths) temporarily removes a key policy risk.
Officials are expected to revisit trade agreements within 180 days, potentially introducing price floors instead of blanket tariffs.
This shift reduced short-term volatility — but structural drivers for silver remain unchanged.
Market Fundamentals
Industrial demand remains strong — especially from solar, EV, and electronics sectors.
Mine supply is constrained since silver is mostly a by-product of other metals.
Physical tightness persists after significant stock draws earlier in the year.
The gold/silver ratio near 50 marks the lowest level since 2011, signaling ongoing relative strength.
Overall, the fundamental setup continues to favor long-term accumulation on dips.
Technical Picture
Gold-to-Silver Ratio recently fell below its 200-day moving average, indicating near-term weakness.
Price structure remains bullish above $48–50 — a critical zone of prior support.
The ratio is trending within a descending channel, suggesting silver continues to outperform gold on a relative basis.
Short-term view: Expect range-bound trade between $50–60 as the market stabilizes.
Medium-term view: A sustained breakout above $65 could reopen the path toward previous highs.
Outlook
Volatility will remain elevated as markets digest U.S. trade policy and macro shifts.
However, tight supply, structural deficits, and ongoing industrial demand should cushion downside moves.
The metal’s dual role — part safe haven, part industrial — keeps it sensitive to both policy and growth signals, but the bias remains upward over the longer term.

GBPUSD: waiting for impulse🛠 Technical Analysis: On the H4 chart, GBPUSD is compressing into a tight wedge/pennant right under the 1.3500–1.3536 resistance zone, signaling a potential volatility expansion. Price is losing momentum near the upper structure while the SMA50/100 sit overhead, acting as dynamic resistance. The key trigger is a confirmed breakdown below 1.3425, which would validate the bearish continuation scenario from the local pattern. If sellers take control, the next downside extension is aimed toward the lower marked support area near 1.3204.
———————————————
❗️ Trade Parameters (SELL)
———————————————
➡️ Entry Point: Sell on a confirmed breakdown and close below 1.34255
🎯 Take Profit: 1.32041
🔴 Stop Loss: 1.35362
⚠️ Disclaimer: This is a potential trade idea based on current analysis; market conditions and price direction are subject to change based on news factors and volatility.

Gold Bullish ContinuationHello Fellow Traders,
We're checking out Gold (XAU/USD) today.
Gold has been in a sideways range for the past few days, even after big news like CPI and PPI. Today we have US Unemployment Claims coming out in the NY session.
Price hit the Previous Day Low earlier, then broke above the 4620 area. We're seeing a Market Structure Shift (MSS) forming a Breaker Block and an FVG, plus a 4-hour Inverse Fair Value Gap (iFVG).
My expectation: Gold will pull back to the marked Breaker and FVG zone for a retest (discount area), then push higher — likely taking out the Previous Day High and grabbing the Buy-side Liquidity as marked.
This move is most likely after the jobless claims data releases. So, wait for the news, watch the reaction, and look for a good spot to enter longs with confirmation.
Always respect your risk — use small position sizes and protect your capital first!
Happy trading! Follow for more simple, clean ideas. What's your take on Gold post-claims? Dip to buy or straight continuation? Comment below!
#Gold #XAUUSD #JoblessClaims #TechnicalAnalysis #SMC #ICT #Forex #Commodities

Can Silver Extend Its Rally Into 2026? - Watch This Week's CloseCan silver extend its rally into 2026? How should investors manage the increase in volatility as silver margins rise?
As long as the US dollar remains in a downtrend, precious metals are likely to continue their bullish trend.
Mirco Silver Futures
Ticker: SIL
Minimum fluctuation:
0.005 per troy ounce = $5.00
Disclaimer:
• What presented here is not a recommendation, please consult your licensed broker.
• Our mission is to create lateral thinking skills for every investor and trader, knowing when to take a calculated risk with market uncertainty and a bolder risk when opportunity arises.
CME Real-time Market Data help identify trading set-ups in real-time and express my market views. If you have futures in your trading portfolio, you can check out on CME Group data plans available that suit your trading needs www.tradingview.com

Silver Bears Finally Make Their Mark Silver has been a tough market to watch, offering little in the way of a pullback as it surged to fresh record highs. As impressive as the move has been, trends like this inevitably roll over at some point — and we may have just seen an important first step from bears.
Today’s bearish range is already around 8% and looks set to close with at least a bearish outside day, with the potential for a bearish engulfing candle.
The 1-hour chart shows a clean break of the bullish trendline. While prices are now curling higher after a period of consolidation, several resistance levels loom — including the monthly pivot point, the broken trendline, and the $90 handle.
Bears could look to fade rallies into these resistance zones, in anticipation of another leg lower.
Matt Simpson, Market Analyst at City Index

Stop!Loss|Market View: USDJPY🙌 Stop!Loss team welcomes you❗️
In this post, we're going to talk about the near-term outlook for the USDJPY currency pair☝️
Potential trade setup:
🔔Entry level: 158.494
💰TP: 161.784
⛔️SL: 156.801
"Market View" - a brief analysis of trading instruments, covering the most important aspects of the FOREX market.
👇 In the comments 👇 you can type the trading instrument you'd like to analyze, and we'll talk about it in our next posts.
💬 Description: The resistance area of 158 has been broken, as previously noted. Buying remains the priority today, and all previous buy trades for this currency pair are active. Furthermore, given the current test of the 158 area, additional buying can be considered, with primary targets at 162 and 163. Level 164 is also considered a medium-term target. Entry points can be sought as close to current prices as possible.
Thanks for your support 🚀
Profits for all ✅

136 Years of SPX vs. Silver – What Should You Do in 2026?This chart shows the S&P 500 / Silver ratio (SPX/Silver) going all the way back to 1890 – a 136-year view of how U.S. equities have performed relative to silver.
The equity data before 1926 is reconstructed from the work of Alfred Cowles and later Robert Shiller; the modern S&P 500 index was created in 1957 and its predecessor, the S&P 90, began in 1926.
Silver prices are taken from long-term historical series that track spot prices back to the early 1900s.
So this ratio is not just a chart – it’s a 136-year financial history of stocks vs. hard money.
🌍 What the World Lived Through (1890–2026)
During this period, the world went through:
1914–1918: First World War
1929: U.S. stock market crash
1930s: Great Depression
1936–1939: Spanish Civil War
1939–1945: Second World War
1950: Korean War
1970s: Oil crises and inflation shock
1982: Worst U.S. recession in 40 years
1987: Black Monday crash
1995–2001: Dot-Com bubble
2008: Global Financial Crisis
2020: Covid crash
And yet, through all of this, the SPX/Silver ratio has moved in very large cycles, telling us when:
Paper assets (stocks) dominate, and
Hard money (silver) swings back with a vengeance.
🧮 The Five Big SPX/Silver Cycles
Using your key levels from the chart, here are the most important turning points:
1️⃣ 1930s – Great Depression Mean Reversion
April 1, 1930: SPX/Silver ≈ 70
April 1, 1935: SPX/Silver ≈ 12.5
Move in the ratio:
Drop: 82.1% from 70 → 12.5
Relative performance: 70 / 12.5 = 5.6×
👉 Silver outperformed the S&P by about 5.6x over that 5-year window.
2️⃣ 1970s – End of the Bretton Woods System / Stagflation
Oct 1, 1971: SPX/Silver ≈ 76
Oct 1, 1974: SPX/Silver ≈ 12.5
Move in the ratio:
Drop: 83.6% from 76 → 12.5
Relative performance: 76 / 12.5 ≈ 6.1×
👉 In the early 1970s inflation shock, silver outperformed stocks by ~6x.
3️⃣ 1980 – The Silver Mania Bottom in the Ratio
Jan 1, 1980: SPX/Silver ≈ 2.34
This is the lowest level in history.
From there, the next major top was:
Aug 1, 2000: SPX/Silver ≈ 310
The highest level in history.
Move in the ratio:
From 2.34 → 310 = ~132× increase
Silver massively underperformed; stocks dominated the next 20 years.
This is the mirror image: buying silver at the 1980 mania top and holding vs. SPX was catastrophic.
4️⃣ 2000–2011 – Tech Bubble to GFC to Silver Boom
Aug 1, 2000: SPX/Silver ≈ 310 (all-time high)
Aug 1, 2011: SPX/Silver ≈ 26
Move in the ratio:
Drop: 91.6% from 310 → 26
Relative performance: 310 / 26 ≈ 11.9×
👉 From 2000 to 2011, silver outperformed the S&P by almost 12x.
This captures the tech bust + GFC + big silver bull into 2011.
5️⃣ 2024–2025 – Our Current Cycle
Feb 1, 2024: SPX/Silver ≈ 225
Jan 14, 2025: SPX/Silver ≈ 76
Move in the ratio so far:
Drop: 66.2% from 225 → 76
Relative performance: 225 / 76 ≈ 3.0×
👉 In less than a year, silver has already outperformed the S&P by ~3x.
Note something extremely important:
📌 The 70–76 zone has acted as a key “ceiling” (resistance) for the SPX/Silver ratio between 1930 and 1991 – for about 61 years.
In previous cycles, when the ratio was rising into the 70–76 zone, it marked the end of stock outperformance and the start of a huge silver cycle.
Today, the ratio is falling down into 76 from above, which means we are in the middle of a silver outperformance phase, not at the start.
----------------------------------------------------------------------
👨👩👦 Maurice, Robert and Richard in January 1991
The chart tells a powerful story:
👨👩👦 Maurice buys silver on Jan 14, 1991 and holds until Jan 14, 2026.
👨👩👦 Robert buys the S&P 500 on the same date and holds until Jan 14, 2026.
👨👩👦 Richard buys the S&P 500 with 50% of his money and silver with the rest 50% on the same date and holds until Jan 14, 2026.
Because the ratio in 1991 and 2026 is the same, Maurice, Robert and Richard end up with roughly the same dollar value (ignoring fees and taxes). Over 35 years, their returns are similar despite choosing completely different assets.
-------------------------------------
👨👩👦 Now we meet Richard in January 2026.
He looks at this 136-year chart and has to decide:
I already have some money both in the SPX and Silver.
“Should I rebalance or stay 50% - 50% for the next 5-10 years?”
Today (Ratio ≈ 75)
Richard should take some profit from Silver and move into SPX:
📌 Recommended Allocation:
60% SPX
40% Silver
Why?
Because:
Ratio is sitting at previous resistance zone (70–76)
Short-term SPX might outperform in a relief rally
Silver has already made a historic move against SPX
Protective rebalancing reduces risk of a sharp mean-reversion
This is called risk-adjusted rebalancing.
Not selling silver completely — just trimming it.
If Ratio drops to 50:
➡️ Move to 70% SPX / 30% Silver
If Ratio drops to 31–26:
➡️ Move to 80% SPX / 20–25% Silver
If Ratio drops to 31–26:
➡️ Move to 80% SPX / 20% Silver
If Ratio drops to below 25:
➡️He has a story to tell to his grandchildren...
