SLV - Parabolic Exhaustion Play - $100 Puts Feb 13📉 Pattern Recognition Setup
AMEX:SLV just completed a 68% run from $65 to $110 in under 3 months. This isn’t normal commodity ETF behavior - this is meme-stock price action.
Key Observation:
The current parabolic structure mirrors the prior $30→$48 spike that collapsed violently after hitting exhaustion (see bar pattern overlay on daily). Same RSI divergence, same volume behavior, same exhaustion signature.
Technical Confluence:
• RSI: 74 (overbought with multiple bear divergence signals)
• Structure: Double top at $110 resistance zone
• Volume: 8h chart shows peak Volume surges mark local Tops/Bottoms
• Pattern Target: $88.91 measured move
• Historical Precedent: Prior parabolic collapse followed identical setup
Trade Details:
Entry: $100 Puts, Feb 13 expiration
Trigger: Close below $105 on 4H timeframe
Target: $88-90 zone
Stop: Reclaim and hold above $110 invalidates pattern
Risk Management:
This is a defined-risk speculation on technical pattern completion. When parabolic runs exhaust at resistance with stacked divergence, retracements are swift and violent - not gradual. Size accordingly.
Timeline: 11 trading days for execution
This is my own thoughts put together by Claude.ai
This is my own charting and my own words and thoughts gathered into a presentable form.
SLV

Will silver take a breather at $84?Silver has gone on a large run, however it looks like it has the potential to slow down or correct soon. I think once it hits the $84 resistance it has the possibility of rejecting there and making a move back to the $39 or $32 support on the chart.
There's a possibility it can extend a bit higher to the $87 resistance as well but unless that level is flipped as support, I lean towards a correction before continuation.
I've marked off higher resistance levels, but due to how we're already in a parabolic move, I lean towards a correction before continuation up to the higher targets.
Let's see how it plays out.

Parabolic / Blue Sky BreakoutThe SLV chart depicts a massive "blow-off top" or hyper-growth phase. The momentum is aggressively to the upside, but the distance from the nearest technical support (27.66) indicates the asset is significantly over-extended from its mean.
Bull Case: Momentum is dominant. With no overhead resistance, the price can theoretically run until buyer exhaustion occurs.
Bear/Risk Case: The vertical ascent leaves the asset vulnerable to sharp, volatile corrections, as there is little established market structure between 101 and 30 to catch a falling price.

Silver Inflation AdjustedHow much is the market willing to pay in real (inflation-adjusted) terms?
Roughly 20 times its historical real average ($3), which puts silver around $60 inflation-adjusted.
That means silver can still double from here—and do it faster than most expect.
Would I hold the entire position to those levels? No.
Would I let a small runner ride using house money? Yes.
Here are other Valuation metrics I have posted for your review.
That’s how you participate in upside without turning a trade into a belief system
If you enjoy the work: 👉 Drop a solid comment. Let’s push it to 6,000 and keep building a community grounded in raw truth, not hype.

I am now Long PUTS IN SLV and Silver 2027 lateThe wave structure is now complete as into the cycle high and fib relationship The US$ is about to Bottom in wave B low we should then see a huge rally in DXY and a sharp decline in all metals and the sp 500 is in wave c up in wave 5 of the diagonal 5th wave all coming into the 5 spirals due 2/9 event best of trades WAVETIMER

Backing Up The TruckIt seems silver is heating up. Better shine up your bullion and get ready for some crypto-like swings. From a macro perspective it looks very similar to the bullish cupping pattern on many other charts. Starting with the Fibonacci extensions measured out from the past major bull run it looks like once again, price clings to the levels like a magnet.
During the 2003-2011 bull market the most notable swings range from 65 to over 100%. The pullbacks sometimes just as violent. The 50 week EMA looks like it was a relatively solid support level and will likely remain so in the future.
Silver has already made it's first 75% move from off the 50 week EMA and has pulled back to the 0.236 fib. It looks like that could be the floor for now. Another 75ish% move would put it up between the 0.5 and 0.618 level around $40.
It will likely take some time to get there with a lot of chop. There is still a risk of the DXY having a technical relief rally especially if new starts rolling out of 'stimulus' disappointments. This is how I've been playing it considering these risks...
After it broke $20 - accumulating bits and pieces on dips, building a core long term position. Trimming and booking some profits into the larger swings.
Fib targets to watch for now:
0.382 --- 31.50
0.5 --- 37.45
0.618 --- 43ish
Trading is risky, don't do it.
Long (6% of portfolio)
Silver bullion and coins
SLV, PSLV, CEF

The Scariest Chart for Silver ShortsAfter flipping from long to short and getting quickly stopped out, I took a step back to try to see the big picture and answer the question, where is silver headed?
Silver is clearly in a parabolic move and the question is no longer whether silver will experience a significant decline from its future top, but rather, when that will occur. Getting the timing wrong will only lead to misery.
I was planning to short heavily at $100, but now I'm not so sure that would be wise. Yes, $100 is a psychological barrier and also coincides with Elliott Wave targets. However, silver has a long history of surprising to the upside during powerful parabolic moves. Three previous times in silver's charted history did it have a 2+ year long parabolic move. What's interesting about those moves is that duration is perfectly correlated with price top. The 71-74 (blue), 76-80 (red), and 08-11 (green) fractals (monthly bars from pivot low to high), are all logarithmically mapped from the 22 pivot low.
I doubt I'll be able to resist shorting at $100, but I will be sure to preserve most of my capital for any move above $150. At $150, I'll be willing to take on substantial risk as the trade will be quite asymmetric.

Gold vs Silver Ratio...Are We About To See Fireworks? The last time we saw a dramatic move of this nature in the gold silver ratio.... we witnessed some crazy volatile downside swings in the commodity price.
Specifically silver saw epic reversals and sell side pressure.
Ahead of the BOJ decision tonight price action is setting up mysteriously eerie.
Watch out for potential silver downside in the next few days...
Even if Silver has a sharp drop.... usually when a commodity sells from all time highs...there is a really great bounce opportunity....this asset is still a beast but anyone can admit its very very extended.
I've even recently sold physical silver since my cost basis is $19.00 (I never thought I would sell)

100% UPSIDE Precious Metals Playbook — Gold, Silver & Miners ETF🏛️ Precious Metals Playbook — Gold, Silver & Miners ETFs
🔑 Executive Summary
• We combine the 2026 parabolic metals thesis gold/silver/platinum with leveraged ETF implementation to target triple-digit portfolio upside under view that gold’s bull run continues into 2026 $5,500–$6,500/oz.
• Miners’ torque has been massive in 2025: GDX ~+123% YTD while gold itself is up ~51% YTD; levered miners e.g., NUGT, JNUG, GDXU show ~360–700%+ YTD — confirming high beta to metal.
• Implementation below caps any single ETF at 10% within 10–20% limit and keeps ≥50% of the book in 2×–3× products for upside torque while diversifying across metal vs. miners and gold vs. silver.
________________________________________
🌍 Market View Condensed
• Gold: Momentum + macro easing bias, softer USD, central-bank demand support the “second-leg melt-up” case into 2026; miners’ margin torque can deliver 2–3× metal beta.
• Silver: Structural deficits + PV/EV/datacenter demand have super-charged silver miners in 2025.
________________________________________
📊 2025 YTD Scorecard Key ETFs
• Gold metal (unlevered): GLD +50.9% YTD.
• Gold miners (unlevered): GDX ~+123% YTD.
• Silver miners (unlevered): SIL ~+137% YTD.
• Leveraged miners:
o NUGT (2× miners) ~+361% YTD; JNUG (2× juniors) ~+394% YTD.
o GDXU (3× miners ETN) ~+706% YTD (top performer cohort of 2025).
• Leveraged gold & silver metals: UGL (2× gold) ~+125% YTD; DGP (2× gold ETN) ~+123% YTD; AGQ (2× silver) ~+159% YTD.
________________________________________
🧩 Portfolio Construction Target book: $100,000
Constraints honored: max 10% per ETF, ≥50% allocation to 2×/3× ETFs.
🎯 Target Allocation 60% leveraged / 40% unlevered
Leveraged — 60% total
• 10% GDXU 3× gold miners ETN
• 10% NUGT 2× gold miners
• 10% JNUG 2× junior gold miners
• 10% AGQ 2× silver
• 10% UGL 2× gold
• 10% DGP 2× gold ETN
Rationale: diversify torque across miners vs. metals, 2× vs. 3×, and gold vs. silver to avoid single-product concentration risk.
Unlevered — 40% total
• 10% GDX VanEck Gold Miners
• 10% GLD SPDR Gold Trust
• 10% SIL Global X Silver Miners
• 10% SLV (or) IAU silver or gold bullion, choose per preference
Rationale: ballast and liquidity; preserves exposure if volatility in levered products forces risk-off.
Dollar mapping (@ $100k):
• Each 10% line = $10,000 notional; 10 tickers → $100,000 fully invested.
________________________________________
📈 Scenario Analysis Hypothetical, path-dependent
Gold advances toward $5,500–$6,500 by 2026. We translate that into rough upside bands using historical betas and allowing for daily-reset drag on leveraged products.
• Base case +100% portfolio:
o Gold +40–60% from here; 2× gold funds net ~+70–110% conservative for compounding/decay.
o GDX sensitivity ~2–3× metal → ~+80–150%; 2× miners ~+160–300%; 3× miners can overshoot in trending tapes.
o With 60% in levered assets and 40% in unlevered miners/metals, blended outcome can land near ~+100% if trends persist and volatility stays manageable.
• Stretch case +200% portfolio:
o If the “second-leg melt-up” plays out momentum + flows + central-bank bid and miners’ margins expand, levered miners dominate returns similar to 2025 YTD pattern.
o Portfolio hits ~+200% if miners continue to over-beta the metal and 3× exposure compounds favorably no major whipsaws.
Risk reality check: Leveraged ETFs reset daily; high volatility or choppy reversals can erode returns even if the long-term trend is up. Position sizing 10% lines and diversification across instruments help mitigate single-name decay risk.
________________________________________
🧭 Implementation Notes
• Execution: stage entries over several days reduce gap/vol risk, prioritize liquid hours; use stop-loss/hedge bands on the 3× sleeve.
• Rebalancing: monthly bands ±3–5% per line to defend the 60/40 torque mix.
• Risk budget: expect 3× ETN drawdowns >60% in sharp pullbacks; keep dry powder OR pre-define risk limits.
________________________________________
🗂️ Product Appendix — Quick Stats
• GDXU (3× miners ETN): ~+706% YTD; ER ~0.95%.
• NUGT (2× miners): ~+361% YTD.
• JNUG (2× junior miners): ~+394% YTD.
• AGQ (2× silver): ~+159% YTD.
• UGL (2× gold): ~+125% YTD.
• DGP (2× gold ETN): ~+123% YTD.
• GDX (miners): ~+123% YTD.
• SIL (silver miners): ~+137% YTD.
• GLD (gold): ~+50.9% YTD.
________________________________________
⚠️ Disclosures & Risks
Leveraged ETFs/ETNs are short-term trading tools with daily reset/compounding; they can significantly underperform their leverage multiple over holding periods with high volatility or mean-reversion. ETNs (e.g., GDXU, DGP) also carry issuer credit risk. This memo is informational, not investment advice; consider your risk tolerance, liquidity needs, and tax/ETN suitability.

Smart Money Setup: Katy AI Turns Bearish on SLVSLV QuantSignals Katy 1M Prediction 2026-01-19
SLV Analysis
Current Price: $81.95
Final Prediction: $81.11 (-1.02%)
30min Target: $80.87 (-1.32%)
Trend: BEARISH
Confidence: 56.8%
Volatility: 15.5%
🧠 AI Insight:
Katy AI identifies mild but consistent downside pressure, with price expected to drift lower rather than bounce aggressively. Momentum favors controlled continuation to the downside.
⚠️ Risk Note:
Lower volatility means slower movement—best suited for disciplined entries and tight risk control.
📌 Best For:
Short-term traders • Mean-reversion shorts • Low-volatility setups

Silver is flashing a warning it hasn’t shown in decadesToday the price crossed $90 per ounce while the monthly RSI the 92 level. Higher than 2011, when silver topped out near RSI 82 and then fell by ~80%
The only other time we’ve seen this level was 1980… followed by a ~90% crash
History doesn’t repeat perfectly, but it does rhyme
So the real question is: what makes this time different?

The Good, The Bad, and the Ugly. Silver.Silver, oh Silver.
My sweet, shiny stone. Since $24 or so, I've tried to preach the good word.
Where are we at now?
Ill start with my fundamental idealism and a short bear/bull case.
Year of the horse, lets keep it short-ish..
Bull
Silver has never seen her own bullrun.. until now(?).
We have new imposed restrictions via China on export.
We can sleep at night knowing silver is never going away.
We can sleep at night knowing they want to keep continue building data centers.
Silver is everything we wholeheartdly use, electronically.
Bear
We are going to see some sort of bearish diver, weve been hot too long
$70 support? we are currently ping-ponging in price, not an ideal entry point.
I've made a channel for our temporary upper and lower bounds.
Id suggest to watch for now, its a great time to take TP if youve been here.
Peace on Earth, happy new year.

Silvers Worth More than Oil! CAUTION!The last time silver traded above both oil and gold was during the Hunt Brothers’ attempt to corner the silver market (arguably the original anti-government Crypto Bros speculators with Lambos, if you think about it. LOL!)
What makes the current setup different is that this move is occurring without a concentrated speculative corner. Silver is outperforming both oil and gold amid systemic monetary stress, driven by broad market forces rather than manipulation.
A currency crisis is therefore one of my leading candidates for what could ultimately blindside markets. It is not the only risk I am monitoring — there are other developing factors and potential catalysts — but this signal stands out and deserves close attention in my view.
Consider what’s happening simultaneously:
The JPY is collapsing in value
The BOJ is raising rates
The Japanese 10-year yield has surged to ~2.0%
The carry trade is being margin-squeezed
Gold is exploding relative to oil
Oil is collapsing
Silver is now outperforming both oil and gold
Trump Starting A Trade war with the world
The DXY is down ~10% since Trump took office.
China has cut U.S. Treasury holdings roughly in half
Central banks are buying gold aggressively
These are not isolated events. They are anomalies clustering at the same time, signaling the same problem. CUERRENCY!
People may not be talking about this with their mouths on social media with silly memes, but they are speaking very loudly & clearly with their MONEY! It’s usually worth listening to what they are saying. The problem is that 99.9% of people don't know what to listen to in a crowded stadium when everyone is yelling and cheering.
That’s why I post observations like this, even if they seem boring or unexciting. I could be more popular by “just giving you the trade,” but context matters. This information is often more important than people realize — especially before it shows up in price. ;)
Here are some of my other posts that relate:
I maintain my position my GTFO and STFO!
CAUTION IS IN ORDER!
THANK YOU for getting me to 5,000 followers! 🙏🔥
Let’s keep climbing.
If you enjoy the work:
👉 Drop a solid comment
Let’s push it to 6,000 and keep building a community grounded in truth, not hype.

$XAG > $BTC? The 1980 "Curse" is Finally Broken.We just witnessed history. Stop scrolling and look at the chart.
For 45 years, the $50 level was the "Graveyard of Bulls."
1980: The Hunt Brothers cornered the market, peaked at $50, and crashed.
2011: The retail mania hit $49 and collapsed.
Today, that ceiling is gone. NASDAQ:XAG hasn't just "broken out"; it has shattered the most significant resistance level in modern financial history. We are trading at $58+, well into price discovery mode.
The "No-BS" Reality: While CRYPTOCAP:BTC is fighting for its life to hold support during this liquidity crunch, Silver has done what "Digital Gold" promised to do but couldn't.
CRYPTOCAP:BTC Status: Flushing leverage, correlating with tech stocks, and failing to act as a hedge.
NASDAQ:XAG Status: Breaking a 45-year suppression cycle to become the #1 performing asset.
The Setup (The Cup & Handle of the Century): This is a 45-year technical structure. The "Cup" started in 1980. The "Handle" ended this month.
The Breakout: $50 is now the floor, not the ceiling.
The Target: The measured move from the 1980 peak targets $85.89 - $89.15.
My Outlook: The "Gold 2.0" narrative is being tested in real-time.
Long NASDAQ:XAG : I am riding this breakout to the $89 target.
The "Re-test" Buy: If we dip back to $50 (the 1980 High), that is a generational buying opportunity. Old resistance must become new support.
Verdict: The "relic" just outperformed the "future." The 1980 curse is dead.
👇 Discussion: Is CRYPTOCAP:BTC failing its "Gold 2.0" audition, or is this just a temporary rotation before Crypto catches up to AMEX:SLV & AMEX:GLD Sectors ? Let me know your targets below.

Gold or Silver?Right now: SILVER!
I know, I know! Crazy schitt! Don't look at me!
The chart’s telling the story — Silver hasn’t even really started its move yet. Don’t blame me, I’m just reading the data.
Silver is up 87% year-over-year and outperforming gold by 11%, which is still on the low end historically.
That suggests Silver either has room to run from here, or it’s simply the safer relative play versus gold on a risk-adjusted basis.
If you’ve got space in your portfolio, it’s a reasonable addition.
If it hits nose-bleed levels, we reassess.
THANK YOU for getting me to 5,000 followers! 🙏🔥
Let’s keep climbing.
If you enjoy the work:
👉 Drop a solid comment
Let’s push it to 6,000 and keep building a community grounded in truth, not hype.

SILVER BLOWOFF TOP COMING! $SLV AMEX:SLV – Blow-Off Move Setting Up (Extreme Extension Alert)
Silver is starting to show classic blow-off characteristics, and at this point the risk is no longer on the long side — it’s on the late chasers.
🔹 Why This Is a Blow-Off Setup:
Price is well outside the upper Bollinger Band — a sign of emotional, momentum-driven buying.
AMEX:SLV is more than $10 above the 9 EMA, an extreme stretch by any historical metric.
Momentum has gone vertical, not constructive — this is what end-of-move behavior looks like.
These conditions don’t mean it collapses instantly — they usually mean volatility spikes and risk shifts hard to the downside.
🔹 How I’m Approaching This (Very Important):
I will NOT short weakness.
If AMEX:SLV fades overnight or opens flat/red, I’ll stay away.
What I want to see is a gap up — ideally a large one — that uses up most of its intraday ATR early.
That’s when blow-off reversals tend to trigger.
🔹 Execution Plan:
1️⃣ Trigger: Gap-up exhaustion move at the open.
2️⃣ Confirmation: Failure after ATR expansion / rejection of highs.
3️⃣ Vehicle: Puts, not stock — defined risk only.
4️⃣ Mindset: This is a fade of excess, not a long-term thesis.
🔹 Big Picture:
Blow-offs don’t end with a whisper — they end with euphoria and poor risk/reward.
Silver has gone from trend to mania, and that’s when traders need to flip from chasing to waiting patiently.

$100 Silver 2029-2031 - Long Term InvestmentMacro Cup & Handle + 21 Fib Time Zone + Fractal
The scenario means we go down a little bit more. We then consolidate for a couple of years before we have a parabolic year or two.

Gold % Gain vs SPX Since 1971Debt wasn’t the problem in 1971 or 1980. It became the system after 2000.
In 1980, the U.S. owed ~30% of its GDP.
In 2000, ~55%. In 2025, ~125%.
This isn’t inflation theory. It’s arithmetic!
I have long been a critic of MMT (Modern Monetary Theory)
Or, as I like to call it more accurately, OCG (Old Currency Guess), because it deliberately confuses a Gov. currency payment system & units of account as wealth. The more we borrow, the more wealth Gov creates, according to OCG. "No sovereign currency issuer can default in its own currency," they cry out daily. So print and play give us more free stuff! We will become richer and solve all the problems of the world! Right!!
Note that Gov becomes the source of wealth, not the private sector, which actually creates wealth with our blood, sweat, tears, innovation, and risk-taking.
So-called ‘printing’ isn’t printing at all. It’s borrowing existing dollars, recycling them through spending, and stacking permanent debt claims on future output. When growth goes to servicing past promises, the economy eventually gets consumed by its own debt and collapses.
Currently, Japan is on the path to economic ruin. With a debt-to-GDP ratio of 250% double that of the US. The thing with debt is that it works great at masking the problem right up to the point it doesn't! It's that "DOESN'T" part that really matters. When creditors lose confidence and run away, that is more subjective than an objective point in economics, which makes it difficult to calculate accurately. People use that subjectivity against economics and conclude it's not science and schitt all over it.
My take is different. While I literally subscribe to no economic standalone theory, I do believe all economists should be financial experts and fully understand markets. No theory or model can deal with the real-world complexity. Definitely not MMT! They are the cancer of economics.
While people are focusing on Gold/Silver and soon start talking about Japan with 250% debt/GDP, I will urge you to look at the US instead. While US debt-to-GDP is half of that of Japan. The US has 4 times the amount of debt as Japan! Quantity is a quality of its own! It is much easier to find creditors for $9 trillion than $38 trillion. Believe that schitt!
With Trump waging a trade war against the world and taking over the FED wanting lower rates, that is F disaster in the Making! After a Nuclear war, Inflation is the absolute worst thing that could happen to humanity! A Global Currency crisis is on the horizon, and 99.9% of the people are unaware of it.
CAUTION! Is in Order!
If you enjoy the work:
👉 Drop a solid comment
Let’s push it to 6,000 and keep building a community grounded in truth, not hype.

SLV | Next Leg Higher Is Here | LONGiShares Silver Trust seeks to reflect generally the performance of the price of silver. The Trust seeks to reflect such performance before payment of the Trust's expenses and liabilities. It is not actively managed. The Trust does not engage in any activities designed to obtain a profit from, or to ameliorate losses caused by, changes in the price of silver.

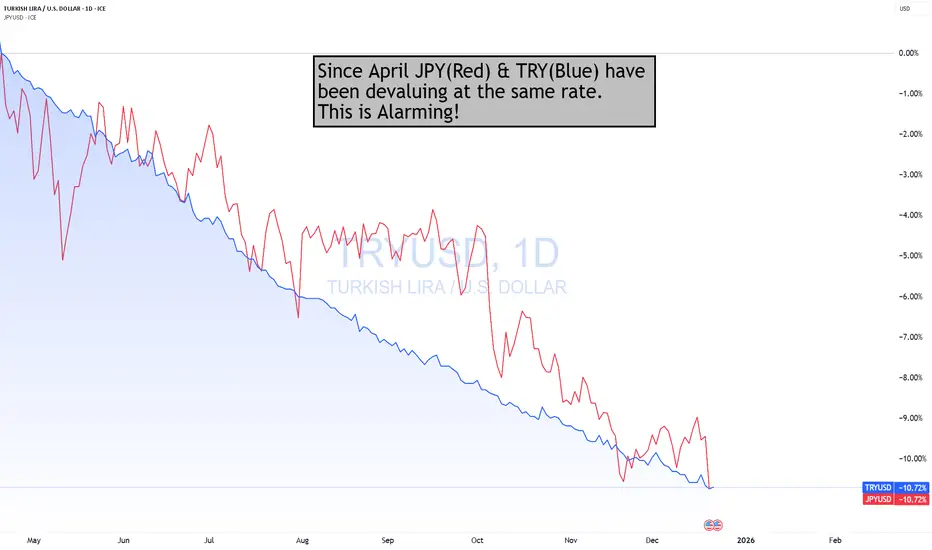
JPY Devaluing At The Same Rate As TRY Against $Since April, the JPY has been falling at the same rate as the TRY against the $. This is Alarming, should the trend continue.
This makes this even more interesting, is that the DXY since Trump took office, has dropped almost by the same amount!
What is important to also understand is that the JPY is 145 of the DXY. As such, if the JPY were to strengthen (all else being equal) the DXY would be down even more!
How would that help the "AFFORDABILITY HOAX" if the $ keeps devaluing, requiring more $s to buy the same amount of goods & services?
Now, does it make a bit more sense why Gold & Silver have soared this year?
I hate to keep harping on JPY, but it is important to all traders/investors in all asset classes, not just FX.
THANK YOU for getting me to 5,000 followers! 🙏🔥
Let’s keep climbing.
If you enjoy the work:
👉 Boost
👉 Follow
👉 Drop a solid comment
Let’s push it to 6,000 and keep building a community grounded in truth, not hype.
Can Silver Become the Most Critical Metal of the Decade?The iShares Silver Trust (SLV) stands at the convergence of three unprecedented market forces that are fundamentally transforming silver from a monetary hedge into a strategic industrial imperative. The November 2025 designation of silver as a "Critical Mineral" by the USGS marks a historic regulatory shift, activating federal support mechanisms including nearly $1 billion in DOE funding and 10% production tax credits. This designation positions silver alongside materials essential for national security, triggering potential government stockpiling that would compete directly with industrial and investor demand for the same physical bars held by SLV.
The supply-demand equation reveals a structural crisis. With 75-80% of global silver production coming as a byproduct of other mining operations, supply remains dangerously inelastic and concentrated in volatile Latin American regions. Mexico and Peru account for 40% of global output, while China is aggressively securing direct supply lines in early 2025. Peru's silver exports surged 97.5%, with 98% flowing to China. This geopolitical repositioning leaves Western vaults increasingly depleted, threatening SLV's creation-redemption mechanism. Meanwhile, chronic deficits persist, with the market balance projected to worsen from -184 million ounces in 2023 to -250 million ounces by 2026.
Three technological revolutions are creating inelastic industrial demand that could consume entire supply chains. Samsung's silver-carbon composite solid-state battery technology, planned for mass production by 2027, requires approximately 1 kilogram of silver per 100 kWh EV battery pack. If just 20% of the 16 million annual EVs adopt this technology, it would consume 62% of the global silver supply. Simultaneously, AI data centres require silver's unmatched electrical and thermal conductivity for reliability, while the solar industry's shift to TOPCon and HJT cells uses 50% more silver than previous technologies, with photovoltaic demand projected to exceed 150 million ounces by 2026. These converging super-cycles represent a technological lock-in where manufacturers cannot substitute silver without sacrificing critical performance, forcing a historic repricing as the market transitions silver from a discretionary asset to a strategic necessity.

SLV vs. IAU: Why Silver Is Crushing Gold ETFsMarket Performance: The Silver Surge
The iShares Silver Trust (SLV) is significantly outperforming its gold counterpart. Over the past year, SLV delivered a staggering 98.9% return. In contrast, the iShares Gold Trust (IAU) posted a respectable but lower 60.2% gain. Investors focused solely on safety often miss this growth engine. While gold acts as a stable store of value, silver behaves aggressively. This dynamic has resulted in SLV turning a $1,000 investment into $2,532 over five years. Gold generated $2,322 over the same period. The data confirms silver’s dominance in the current bull market.
High-Tech and Science: The Industrial Driver
Silver is not just a currency; it is a critical industrial component. Science dictates this market reality. Silver possesses the highest electrical and thermal conductivity of all metals. Consequently, the high-tech sector drives massive demand. Manufacturers require silver for 5G networks, advanced electronics, and medical devices. Unlike gold, which sits in vaults, industry consumes silver. This consumption creates a fundamental scarcity that drives price appreciation during economic expansions.
Green Tech and Patent Analysis
The global shift toward renewable energy directly benefits SLV. Patent filings for photovoltaic (solar) technologies have surged globally. Silver is the primary conductive element in solar panels. As the world transitions to net-zero emissions, solar demand creates a price floor for silver. Furthermore, electric vehicle (EV) patents increasingly rely on silver for contacts and circuitry. This structural trend ensures that SLV tracks the green energy boom, not just monetary policy.
Geopolitics and Geostrategy: Critical Minerals
Geopolitical tensions are reshaping the precious metals landscape. Nations now view silver as a strategic material rather than just a luxury good. Governments are securing supply chains for critical minerals to ensure technological sovereignty. This geostrategic hoarding reduces global supply elasticity. As major powers decouple their economies, control over silver mining and refining becomes a national security issue. Investors in SLV profit from this heightened competition for physical resources.
Macroeconomics: The Inflation Hedge
Both trusts capitalize on global debt concerns. Sovereign debt levels are rising uncontrollably across major economies. Investors traditionally use precious metals to hedge against currency debasement. However, silver offers a "high beta" play on inflation. When inflation expectations rise, silver typically rises faster than gold due to its smaller market size. Current macroeconomic conditions favor this volatility. The market anticipates continued currency devaluation, fueling inflows into hard assets like SLV.
Business Models and Fund Structure
The iShares business model focuses on accessibility. Both SLV and IAU allow investors to bypass the costs of storing physical bars. However, their cost structures differ. IAU charges a lean 0.25% expense ratio, appealing to cost-conscious holders. SLV charges 0.50%. Investors pay this premium for silver’s explosive growth potential. The fund structure is a grantor trust, meaning it holds physical bullion. This protects investors from counterparty risks associated with futures contracts or derivatives.
Risk Management and Volatility
High returns come with higher risk. SLV carries a beta of 0.18, indicating positive correlation with equity volatility. IAU holds a beta of -0.06, acting as a true diversifier. Consequently, SLV suffered a maximum drawdown of nearly 39% over five years. Gold dropped only 21.8% in the same period. Management of portfolio risk requires understanding this difference. Aggressive traders prefer SLV for its torque; conservative savers choose IAU for stability.
Conclusion: The Strategic Choice
The iShares Silver Trust offers superior leverage to the global industrial recovery. While IAU remains the safer, cheaper hedge, SLV is the growth leader. The combination of green technology demand and monetary debasement creates a perfect storm for silver. Investors willing to tolerate higher fees and deeper drawdowns have reaped larger rewards. As long as the precious metals bull market persists, silver’s dual nature ensures it will continue to outpace gold.

Silver Bear
Traders are trading silver like USD is collapsing tomorrow. 47923481239 bearish divergences on indicators don't matter to these traders they simply buy because of green candles like UNGA DUNGA. That big giant red candle that went straight down last Friday doesn't scare these traders apparently. That bearish divergence on the RSI doesn't scare these traders, apparently silver is just going up forever...
