GBP-USD Free Signal! Buy!
Hello,Traders!
GBPUSD taps a well-defined demand zone after sell-side liquidity grab, showing strong displacement and rejection. SMC bias favors continuation toward upside liquidity.
--------------------
Entry: 1.3799
Stop Loss: 1.3740
Take Profit: 1.3882
Time Frame: 2H
--------------------
Buy!
Comment and subscribe to help us grow!
Check out other forecasts below too!
Disclosure: I am part of Trade Nation's Influencer program and receive a monthly fee for using their TradingView charts in my analysis.
Smartmoneyconcept

CADJPY LOCAL SHORT|
✅CADJPY is pushing into a clear premium supply after a strong displacement. ICT structure shows bearish reaction potential, with upside liquidity taken and a retracement toward inefficiency likely next. Time Frame 2H.
SHORT🔥
✅Like and subscribe to never miss a new idea!✅

GBPNZD | Final Rally 2.46+ Before CollapseGBPNZD | The Final Push Before the Crash 🌋 | Wave (5) Climax in Motion!
🔍 Quick Outlook
GBPNZD is unfolding its micro wave (5) of C , the final stretch of the b wave of the Supercycle .
Momentum is fading, Smart Money is positioning, and a major reversal is brewing. ⚡
After a minor correction near 2.25 – 2.21, a last push higher is expected toward 2.46 + , aligning with the 1.618 Fib extension and the buy-side liquidity zone .
Once liquidity is taken, price may enter a multi-year bearish Wave C , targeting 1.70 – 1.62. 📉
🌊 Wave Theory + Confluence
✅ Wave (5) of C active – terminal phase underway
🎯 1.618 Fib extension ≈ 2.46
🕐 Minor wave (4) correction almost done
💥 Expect liquidity sweep above 2.45 – 2.48 then reversal
💰 Smart Money + Structure
🏦 Institutions accumulating below 2.25 before final markup
🎣 Liquidity inducement above 2.45 = trap zone
🔻 BOS below 2.1580 → bearish confirmation
🧩 Rising-wedge structure shows exhaustion
🔄 Market Cycle Perspective
We’re in the Euphoria phase — once wave (5) completes, the Depression phase (Wave C) could unfold toward 1.62 support before a new macro up-cycle begins.
Summary
"GBPNZD is in its final euphoric rally! One last liquidity grab above 2.45 before the big markdown begins. Watch closely 👀"
⚡ If this breakdown helps your outlook — Boost 👍, Comment 💬 & Follow 🔔 for live GBPNZD updates and multi-wave setups!
— Team FIBCOS
Trade the liquidity, not the noise." 💡

EURCAD: Expecting Bullish Continuation! Here is Why:
It is essential that we apply multitimeframe technical analysis and there is no better example of why that is the case than the current EURCAD chart which, if analyzed properly, clearly points in the upward direction.
Disclosure: I am part of Trade Nation's Influencer program and receive a monthly fee for using their TradingView charts in my analysis.
❤️ Please, support our work with like & comment! ❤️

BTCUSDT Review January 26 2026Short-term price movement ideas.
As anticipated in the previous analysis, price tested the daily area of interest, from which we saw a continuation and update of the bearish structure. At this point, the most recent daily zone remains the primary area to work from. If this zone is retested and confirmation is formed on the 4H timeframe, a short position may be considered, targeting a sweep of the previous low.
Be flexible, adapt to the market, and the results will come quickly. Good luck to everyone.

Silver M30 HTF Liquidity Sweep and Bullish Continuation Setup📝 Description
TVC:SILVER on the M30 timeframe remains within a broader bullish structure after completing a corrective pullback into a higher-timeframe demand area. Price has respected the H1 order block and is now consolidating above value, suggesting preparation for another expansion leg to the upside.
________________________________________
📈 Signal / Analysis
Primary Bias: Bullish while price holds above the H1 order block and recent higher low
Preferred Setup:
• Entry: 94.246
• Stop Loss: Below 93.606
• TP1: 95.240
• TP2: 95.871
• TP3: 96.858 (HTF liquidity / trend continuation target)
________________________________________
🎯 ICT & SMC Notes
• Market is holding above a valid H1 order block
• Recent sell-side liquidity has already been swept
• Upside targets align with buy-side liquidity and trendline expansion
________________________________________
🧩 Summary
As long as price holds above the H1 demand zone, Silver is expected to continue its bullish rotation toward higher buy-side liquidity levels. Pullbacks into value are considered continuation opportunities rather than reversals.
________________________________________
🌍 Fundamental Notes / Sentiment
Precious metals remain supported under mixed risk sentiment and hedging flows. Any renewed weakness in the US dollar or increase in macro uncertainty may further accelerate upside momentum in Silver.
________________________________________
⚠️ Risk Disclosure
Trading involves substantial risk and may result in capital loss. This analysis is for educational purposes only and does not constitute financial advice. Always apply proper risk management, predefined stop-loss levels, and disciplined position sizing aligned with your trading plan.

GBPUSD Sell Momentum | Gap Open + Order Block BreakGBPUSD H4 Bearish Since 05 January 2026, price has been moving inside a bearish channel CHOCH BOS confirmed, indicating a clear bearish shift Internal Order Block is in play and has been respected MACD supports the bearish momentum. The lower order block has been broken.
Targets downside liquidity.

NZDUSD Review January 19 2026Short-term price movement ideas.
Price has formed a daily high within the weekly area of interest, acting as a trigger for a potential downside move. If this high is taken and confirmed on the 4H timeframe, short positions may be considered with a target at the previous low. If this does not occur, a deeper move into the area of interest is expected, and further confirmation should be awaited.
Be flexible, adapt to the market, and the results will come quickly. Good luck to everyone.

USDCHF WILL GO UP|LONG|
✅USDCHF Price is holding a bullish ICT structure after a strong displacement, with demand clearly defended on pullbacks. Acceptance above this zone suggests smart money continuation toward higher liquidity and premium targets. Time Frame 3H.
LONG🚀
✅Like and subscribe to never miss a new idea!✅

GBPUSD H1 SSL Sweep + Bullish Order Block with RSI ConfirmationOANDA:GBPUSD GBPUSD H1 Timeframe Previously, we had a sell analysis on GBPUSD H1 where sideways liquidity was highlighted, and that analysis was later closed.
Now, price has taken sell-side liquidity, formed a bullish order block, and moved upward.
Currently, price is trading around 1.34213. RSI is at 40.44, indicating selling pressure has weakened.
If RSI reclaims above 50 and price closes above the H1 order block, a bullish move toward 1.35328 is highly probable.
There is a strong possibility that price will move toward the upper order block.
If an H1 candle closes above the upper order block,
Final Target: 1.35328
Stop Loss: Below the lower order block at 1.33728

SILVER BULLISH CONTINUATION|LONG|
✅SILVER remains in a strong bullish structure after the impulsive rally, with shallow pullbacks holding above the demand zone. As long as price stays supported, continuation toward higher liquidity and premium targets is favored. Time Frame 5H.
LONG🚀
✅Like and subscribe to never miss a new idea!✅

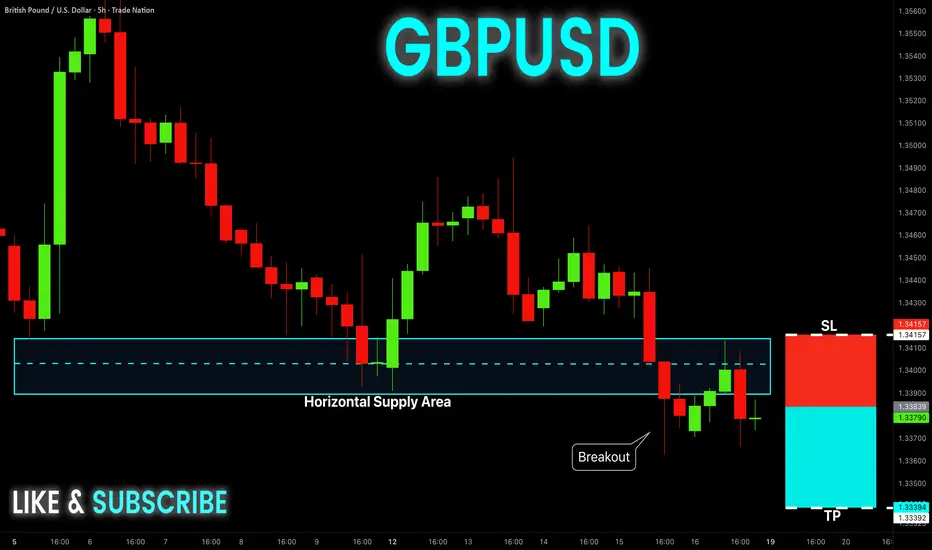
GBP-USD Free Signal! Sell!
Hello,Traders!
GBPUSD delivered a clean break below the horizontal supply, confirming bearish market structure shift. Weak pullbacks into the broken zone suggest sell-side control, with downside liquidity resting below recent lows.
--------------------
Stop Loss: 1.3415
Take Profit: 1.3339
Entry: 1.3384
Time Frame: 5H
--------------------
Sell!
Comment and subscribe to help us grow!
Check out other forecasts below too!
Disclosure: I am part of Trade Nation's Influencer program and receive a monthly fee for using their TradingView charts in my analysis.
USDJPY FREE SIGNAL|LONG|
✅USDJPY is respecting bullish market structure after a strong displacement higher, with premium being accepted above prior supply. Shallow pullbacks signal smart money continuation, favoring upside toward external liquidity highs.
———————————
Entry: 158.00
Stop Loss: 157.49
Take Profit: 158.70
Time Frame: 6H
———————————
LONG🚀
✅Like and subscribe to never miss a new idea!✅

EUR-NZD Bearish Bias! Sell!
Hello,Traders!
EURNZD Price has delivered a clean break below the key demand base, signaling a shift in control and confirming bearish intent. Weak pullbacks suggest sellers remain active, with downside liquidity now the primary draw toward lower imbalance zones. Time Frame 5H.
Sell!
Comment and subscribe to help us grow!
Check out other forecasts below too!
Disclosure: I am part of Trade Nation's Influencer program and receive a monthly fee for using their TradingView charts in my analysis.

$BNB Bull Run Rapidly & Price Hit $1,515 Q2 in 2026On January 15, 2026, BNB Chain executed its 34th quarterly BNB token burn, permanently removing 1,371,803.77 BNB, valued at approximately $1.277 billion, from circulation.
The event highlights BNB's deflationary model enhancing scarcity, potentially impacting market dynamics and long-term asset valuation amid BNB Chain's ongoing ecosystem growth initiatives.
BNB Chain conducted its 34th quarterly token burn on January 15, 2026, permanently removing 1,371,803.77 BNB. This action aligns with the network's goal of reaching a 100 million BNB supply cap using a deflationary model. The 34th BNB Burn highlights the impact on the ecosystem.
Fermi Hardfork Live on Mainnet
Meanwhile, the Fermi hard fork upgrade is now live on BNB Smart Chain. Developers activated the upgrade on mainnet on Jan. 14, 2026, at 02:30 UTC, supported by the v1.6.4 client release.
Following the Fermi mainnet activation, block time dropped from 0.75 seconds to 0.45 seconds, improving transaction speed and dApp responsiveness.
Fermi also adds more parameter updates, improvements, and bug fixes to the BNB network.
Additionally, Fermi introduces updated voting rules for fast finality through BEP-590 to support frequent block production.
Essentially, Fermi makes the network faster without compromising reliability. It follows other major updates, including Lorentz, Pascal, and Maxwell.
BNB Price Outlook, What to Expect
BNB, the native digital asset of the BNB Chain, is currently showing improvement in its price. Over the past 24 hours, BNB price increased by 0.9% to $938.2, with a market cap of $127.9 billion.
Considering its latest move, BNB now moves closer to hitting the $1,000 mark. BNB closed higher after breaking above the $920 key resistance.
If the move continues, analysts have predicted that the BNB price may head toward the next resistance zone between $1050 and $1080.
The potential launch of a BNB ETF is one key factor that could fuel the move towards $1,000. Just a few hours after Grayscale announced the filing of its incoming spot BNB ETF, the BNB price posted 2% gains.
#Write2Earn #BinanceSquareFamily #Binance #BNB #SUBROOFFICIAL
Disclaimer: This article is for informational purposes only and does not constitute financial advice. Always conduct your own research before making any investment decisions. Digital asset prices are subject to high market risk and price volatility. The value of your investment may go down or up, and you may not get back the amount invested. You are solely responsible for your investment decisions and Binance is not available for any losses you may incur. Past performance is not a reliable predictor of future performance. You should only invest in products you are familiar with and where you understand the risks. You should carefully consider your investment experience, financial situation, investment objectives and risk tolerance and consult an independent financial adviser prior to making any investment.

GOLD Bullish Continuation! Buy!
Hello,Traders!
XAUUSD Price remains supported by a strong demand zone after a decisive BOS, confirming bullish market structure. Current consolidation suggests accumulation, with smart money likely targeting higher liquidity and continuation toward premium levels. Time Frame 5H.
Buy!
Comment and subscribe to help us grow!
Check out other forecasts below too!
Disclosure: I am part of Trade Nation's Influencer program and receive a monthly fee for using their TradingView charts in my analysis.

NZDJPY LOCAL LONG|
✅NZDJPY Price is holding above a key ICT demand zone after a strong impulse, suggesting bullish continuation. Shallow pullbacks into discount are likely to attract buyers targeting higher liquidity. Time Frame 4H.
LONG🚀
✅Like and subscribe to never miss a new idea!✅

EURNZD BEARISH BREAKOUT|SHORT|
✅EURNZD Clean bearish ICT breakout below the supply zone signals a confirmed shift in market structure. Price acceptance under the level shows smart money control, with minor pullbacks likely to be sold into before continuation toward downside liquidity. Time Frame 4H.
SHORT🔥
✅Like and subscribe to never miss a new idea!✅

DXY Free Signal! Buy!
Hello,Traders!
DXY has delivered a strong SMC breakout from the horizontal demand, confirming a bullish shift in market structure. Clean displacement and follow-through show aggressive buy-side control, with prior sell-side liquidity fully absorbed. Continuation toward higher liquidity pools remains favored.
--------------------
Stop Loss: 99.160
Take Profit: 99.599
Entry: 99.343
Time Frame: 5H
--------------------
Buy!
Comment and subscribe to help us grow!
Check out other forecasts below too!
Disclosure: I am part of Trade Nation's Influencer program and receive a monthly fee for using their TradingView charts in my analysis.

NZD-CHF Will Keep Growing! Buy!
Hello,Traders!
NZDCHF continues to respect bullish SMC structure after a clean reaction from the horizontal demand area. Price is holding above prior sell-side liquidity, showing strong absorption and follow-through buying.Time Frame 2H.
Buy!
Comment and subscribe to help us grow!
Check out other forecasts below too!
Disclosure: I am part of Trade Nation's Influencer program and receive a monthly fee for using their TradingView charts in my analysis.

SILVER Will Keep Growing! Buy!
Hello,Traders!
SILVER remains firmly bullish after an impulsive expansion from the demand zone. Structure continues to print higher highs and higher lows, showing strong buyer control. Any brief dips are likely accumulation phases before continuation into overhead buy-side liquidity. Time Frame 4H.
Buy!
Comment and subscribe to help us grow!
Check out other forecasts below too!
Disclosure: I am part of Trade Nation's Influencer program and receive a monthly fee for using their TradingView charts in my analysis.

BTCUSD FREE SIGNAL|LONG|
✅BTCUSD Strong bullish displacement from the demand zone confirms ICT market structure shift. Price respected mitigation on the pullback, showing acceptance above the key level. With sell-side liquidity already cleared, continuation toward buy-side targets remains the higher-probability path.
—————————
Entry: 95,186$
Stop Loss: 94,242$
Take Profit: 96,624$
Time Frame: 6H
—————————
LONG🚀
✅Like and subscribe to never miss a new idea!✅

ETHUSDT H1 HTF Range Resistance and Bearish Continuation Setup📝 Description
BINANCE:ETHUSDT is consolidating below a descending HTF resistance trendline after failing to reclaim prior highs. Price is reacting inside a weak corrective structure, with upside moves lacking impulsive continuation and holding below key premium levels.
________________________________________
📈 Signal / Analysis
Primary Bias: Bearish while price remains capped below the H1 range high and descending trendline
Preferred Setup:
• Entry: 3,299
• Stop Loss: Above 3,307
• TP1: 3,286
• TP2: 3,274
• TP3: 3,253 (HTF liquidity / lower FVG)
________________________________________
🎯 ICT & SMC Notes
• Price trading below descending HTF resistance
• Upside moves classified as corrective retracements
• Liquidity resting below recent equal lows
• HTF FVG below remains unfilled and acts as a draw
________________________________________
🧩 Summary
As long as CRYPTOCAP:ETH fails to break and hold above the descending resistance and range high, the structure favors continuation toward lower liquidity pools and HTF PD arrays.
________________________________________
🌍 Fundamental Notes / Sentiment
Market sentiment remains cautious, with no clear bullish catalyst supporting sustained upside, increasing the probability of technical pullback continuation.
________________________________________
⚠️ Risk Disclosure
Trading involves substantial risk and may result in capital loss. This analysis is for educational purposes only and does not constitute financial advice. Always apply proper risk management, predefined stop-loss levels, and disciplined position sizing aligned with your trading plan.
