EURUSD - M15 Supply Zone RetestThe current price action shows that the market is expected to first fill the Fair Value Gap (FVG) area, which acts as a price inefficiency zone demanding liquidity clearance. After the FVG is filled, the price is anticipated to retest the Higher Time Frame (HTF) Supply Zone, which serves as a strong resistance area.
Following the retest of the supply zone, the prevailing downtrend is likely to resume, pushing the price downwards towards the HTF Demand Zone. This demand zone is identified as a key support level where buying interest is expected to emerge, potentially halting the decline temporarily or initiating a reversal.
This trading plan emphasizes waiting patiently for the FVG fill as a prerequisite step before looking for a supply zone retest confirmation to enter short positions targeting the demand zone below, aligning with the overall bearish trend continuation.
Smartmoneyconcept

GBPJPY 15-Minute Analysis with Supply and Demand Zones1. Market Context
The price recently experienced a strong upward move followed by a rejection at the Higher Time Frame (HTF) Supply Zone near the 200.051 level.
Key levels have been identified including an HTF Supply Zone (resistance area) and HTF Demand Zone (support area).
2. Price Structure and Key Levels
The chart marks a weak high (x-weak high) near the supply zone which indicates possible exhaustion of upward momentum.
A break of structure (x-bos) was followed by a retracement to the supply zone.
The HTF Demand Zone around 198.070 marks a strong support area from which price might potentially rebound.
3. Trading Plan and Execution
Entry: Consider a short (sell) position near the HTF Supply Zone (around 199.8 to 200.05) after confirmation of bearish rejection or reversal patterns.
Target: Set the take profit near the HTF Demand Zone (around 198.07), which represents a strong support level.
Stop Loss: Place a stop loss just above the HTF Supply Zone to protect against unexpected breakouts.
Trade Management: Expect a possible retest or small pullback after the initial move from the supply zone before continuing the downward trend.
4. Outlook and Strategy
The primary expectation is a downward movement from the supply zone to the demand zone.
Watch for price action cues such as bearish engulfing candles or strong rejection wicks at the supply zone to confirm entry.
If price breaks above the HTF Supply Zone strongly, reconsider the bearish bias for possible trend shifts.

GBP_NZD LOCAL SHORT|
✅GBP_NZD made a retest of the
Local horizontal resistance level of 2.2580
And as you can see the pair is already
Making a local pullback from
The level which sends a clear
Bearish signal to us therefore
We will be expecting a
Further bearish correction
SHORT🔥
✅Like and subscribe to never miss a new idea!✅
Disclosure: I am part of Trade Nation's Influencer program and receive a monthly fee for using their TradingView charts in my analysis.

GBP-USD Local Long! Buy!
Hello,Traders!
GBP-USD is about to retest
The horizontal support
Level below at 1.3383
And as this is a strong
Support level we will be
Expecting a local bullish
Rebound and a move up
Buy!
Comment and subscribe to help us grow!
Check out other forecasts below too!
Disclosure: I am part of Trade Nation's Influencer program and receive a monthly fee for using their TradingView charts in my analysis.

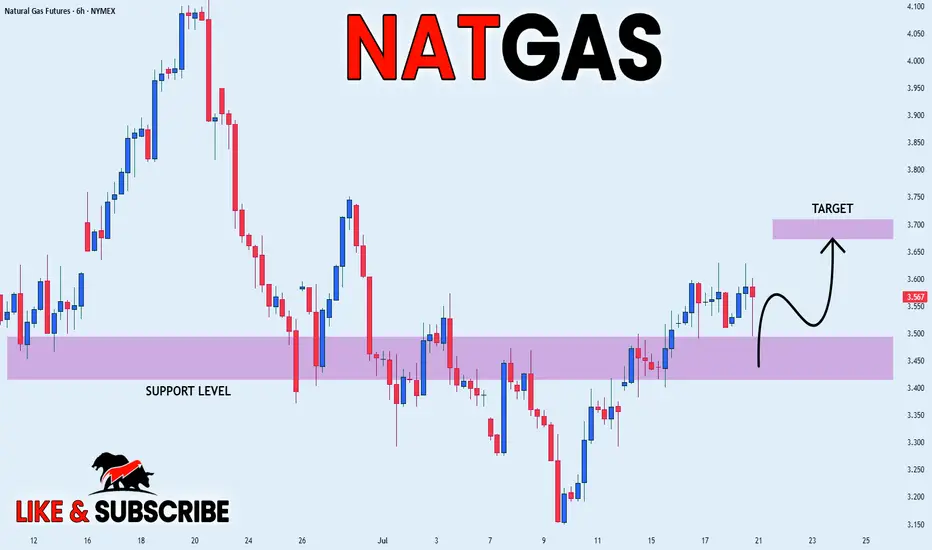
NATGAS REBOUND AHEAD|LONG|
✅NATGAS is going up now
And the price made a bullish
Rebound from the horizontal
Support level around 3.50$
So we are bullish biased and
We will be expecting a
Further bullish move up
LONG🚀
✅Like and subscribe to never miss a new idea!✅
Disclosure: I am part of Trade Nation's Influencer program and receive a monthly fee for using their TradingView charts in my analysis.
AUD-CHF Risky Short From Falling Resistance! Sell!
Hello,Traders!
AUD-CHF is trading in a
Downtrend along the falling
Resistance line so we are
Bearish biased and after
The potential retest of the
Falling resistance we will
Be expecting a further
Bearish move down
Sell!
Comment and subscribe to help us grow!
Check out other forecasts below too!
Disclosure: I am part of Trade Nation's Influencer program and receive a monthly fee for using their TradingView charts in my analysis.

CHF-JPY Resistance Ahead! Sell!
Hello,Traders!
CHF-JPY keeps growing in
An uptrend and the pair is
Locally oversold so after the
Retest of the horizontal
Resistance of 186.000
From where we will be
Expecting a local bearish
Pullback on Monday
Sell!
Comment and subscribe to help us grow!
Check out other forecasts below too!
Disclosure: I am part of Trade Nation's Influencer program and receive a monthly fee for using their TradingView charts in my analysis.

NZD_JPY PULLBACK EXPECTED|SHORT|
✅NZD_JPY has been growing recently
And the pair seems locally overbought
So as the pair has approached
A horizontal resistance of 88.900
Price fall is to be expected
SHORT🔥
✅Like and subscribe to never miss a new idea!✅
Disclosure: I am part of Trade Nation's Influencer program and receive a monthly fee for using their TradingView charts in my analysis.

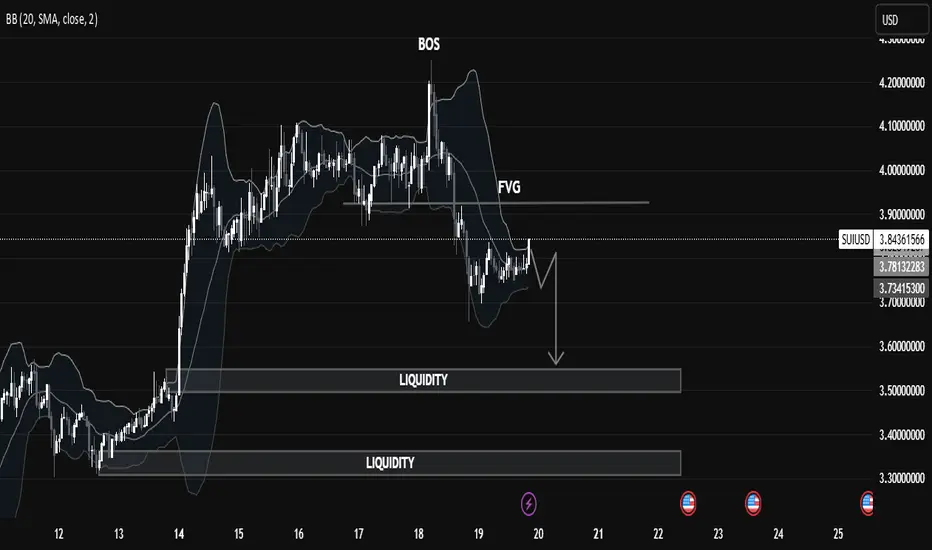
SUIUSD Liquidity Trap in Motion: Price Targeting Deeper Pools🧠 Market Structure Insight (SMC Framework)
🔍 1. Break of Structure (BOS):
The most recent BOS around the $3.95 level marked a bull trap, indicating a transition from bullish momentum to a distribution phase. This suggests institutional players offloaded liquidity at premium prices before initiating a markdown.
🕳️ 2. FVG (Fair Value Gap):
A visible Fair Value Gap (Imbalance) remains unmitigated above the current price action. This zone acted as a supply area, where price sharply moved down, leaving inefficiency in its trail—now serving as a potential point of rejection if revisited.
📌 Liquidity Zones:
Upper Liquidity Cleared: Price has swept highs before reversal (a sign of engineered liquidity grab).
Double Liquidity Pools Below:
First pool: Around $3.55 - $3.60
Second pool: Deep liquidity around $3.30 - $3.35
These levels are highly attractive for Smart Money to target next, suggesting continuation to the downside.
📉 Current Price Behavior:
Market is consolidating in a tight range just below FVG, signaling potential re-accumulation of sell orders.
The chart pattern suggests a potential lower high forming, likely to precede a bearish leg towards liquidity zones.
Bollinger Bands show compression, hinting at volatility expansion soon.
🎯 Trade Outlook (Not Financial Advice):
🔻 Bearish Bias:
Unless price breaks above the FVG zone with strong bullish momentum, the probability favors a bearish continuation targeting:
1st Target: ~$3.55
2nd Target (Deeper liquidity grab): ~$3.30
A rejection from FVG followed by a BOS to the downside would serve as confirmation for this bias.
📚 Educational Takeaway:
This chart is a clean illustration of Smart Money Concepts in play:
BOS > FVG > Liquidity Sweep
Price respects institutional footprints: grab liquidity, fill imbalances, then drive toward untouched liquidity zones.
Recognize market intent through structure shifts and imbalance reaction.
AUD_NZD GROWTH AHEAD|LONG|
✅AUD_NZD fell down sharply
But a strong support level was hit at 1.0910
Thus I am expecting a rebound
And a move up towards the target of 1.0930
LONG🚀
✅Like and subscribe to never miss a new idea!✅
Disclosure: I am part of Trade Nation's Influencer program and receive a monthly fee for using their TradingView charts in my analysis.

EUR-NZD Will Grow! Buy!
Hello,Traders!
EUR-NZD is making a local
Bearish correction while trading
In an uptrend along he rising
Support so after the pair hits
The support line a local bullish
Rebound is to be expected
Buy!
Comment and subscribe to help us grow!
Check out other forecasts below too!
Disclosure: I am part of Trade Nation's Influencer program and receive a monthly fee for using their TradingView charts in my analysis.

NZD-JPY Local Short! Sell!
Hello,Traders!
NZD-JPY has hit a horizontal
Resistance level of 88.851
And we are already seeing
A bearish reaction so we will
Be expecting a local
Bearish move down
On Monday!
Sell!
Comment and subscribe to help us grow!
Check out other forecasts below too!
Disclosure: I am part of Trade Nation's Influencer program and receive a monthly fee for using their TradingView charts in my analysis.

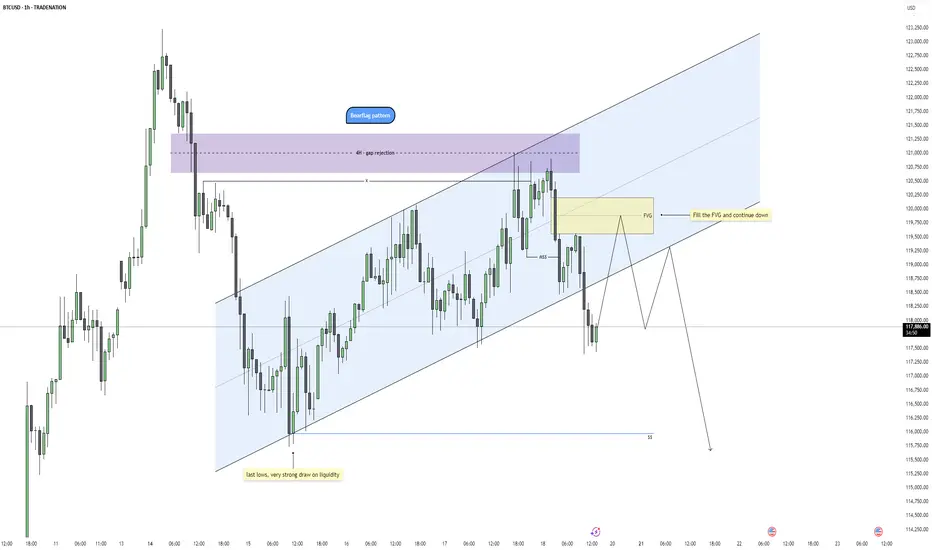
Bitcoin - Bearflag Structure Taking ShapeBitcoin is showing signs of weakness after a clean rejection from a 4H fair value gap, where price also swept the previous swing high. This aligns well with a broader bearish context as the market failed to sustain above the upper bounds of the trend channel, indicating potential exhaustion of the bullish correction.
Rejection Zone and Fair Value Gap
The rejection took place precisely within a 4H imbalance, adding confluence to the idea that this was a premium retracement in a bearish leg. The high formed inside that zone has now been swept, setting up conditions for distribution. A smaller 1H fair value gap was also left behind during the displacement move down, creating a clean area for price to return to and potentially react from.
Channel Structure and Bearflag Formation
Structurally, price has been climbing in a rising channel that resembles a bearflag pattern. The recent market structure shift broke the channel low, confirming that the rising structure is likely corrective. The rejection from the top of the flag and the subsequent breakdown align with a typical bearflag setup, suggesting a continuation move to the downside.
Short-Term Retracement Expectation
Before the next leg down, price may retrace to fill the unmitigated fair value gap while possibly sweeping the minor swing high that caused the current drop. This retracement would offer a premium shorting opportunity in alignment with the bearish bias, especially if internal structure remains weak on the lower timeframes during the return to the FVG.
Draw on Liquidity and Price Objective
The main objective for this setup is a sweep of the last equal lows near 115950, which represents a strong draw on liquidity. If the bearflag setup plays out fully, this area is highly vulnerable and could be the next significant target once the FVG is filled and lower timeframe distribution confirms.
Conclusion
Price has rejected from a 4H imbalance and swept liquidity to the upside, forming a clean bearflag structure. As long as price remains below the recent high and fills the 1H FVG without invalidating the shift, the path of least resistance looks to be down toward the liquidity resting below 115950. I’ll be watching for signs of weakness during the return to the FVG for a potential short trigger.
Disclosure: I am part of Trade Nation's Influencer program and receive a monthly fee for using their TradingView charts in my analysis.
___________________________________
Thanks for your support!
If you found this idea helpful or learned something new, drop a like 👍 and leave a comment, I’d love to hear your thoughts! 🚀
USD_JPY STRONG UPTREND|LONG|
✅USD_JPY is in a strong
Long-term uptrend now
And the pair is accumulating
For the next leg up so we will
Be expecting a bullish continuation
On Monday!
LONG🚀
✅Like and subscribe to never miss a new idea!✅
Disclosure: I am part of Trade Nation's Influencer program and receive a monthly fee for using their TradingView charts in my analysis.

EUR_AUD WILL GROW|LONG|
✅EUR_AUD is trading in an uptrend
With the pair set to retest
The rising support line
From where I think the growth will continue
LONG🚀
✅Like and subscribe to never miss a new idea!✅
Disclosure: I am part of Trade Nation's Influencer program and receive a monthly fee for using their TradingView charts in my analysis.

CAD-JPY Will Keep Growing! Buy!
Hello,Traders!
CAD-JPY keeps trading in
An uptrend and there is a
Rising support below so
We are bullish biased
And we will be expecting
A further bullish move up
Buy!
Comment and subscribe to help us grow!
Check out other forecasts below too!
Disclosure: I am part of Trade Nation's Influencer program and receive a monthly fee for using their TradingView charts in my analysis.

NZD/USD Technical Analysis | Smart Money Perspective🧠 NZD/USD Technical Analysis | Smart Money Perspective
On the current NZD/USD chart, price is trading around 0.5960, positioned between a clearly defined resistance zone (0.6130–0.6150) and a support zone (0.5890–0.5900).
We can observe the following key technical elements:
🔹 1. Liquidity Sweep
Price recently broke below the previous swing low near 0.5900, tapping into a pool of sell-side liquidity. This movement is commonly interpreted as a liquidity grab, where institutions manipulate price to trigger retail stop losses before reversing.
🔹 2. Double Bottom Formation
The chart indicates a potential double bottom forming at the support level — a classic accumulation signal. This pattern suggests buyers may be stepping in after liquidity has been taken out, anticipating a reversal.
🔹 3. Fair Value Gap (FVG)
An FVG (imbalance) is visible in the range of 0.5985 to 0.6015. This inefficiency was created by a sharp bearish move, leaving price action unbalanced. Price is now expected to retrace into this area to rebalance orders — a common smart money behavior.
🔹 4. Market Structure Outlook
If the double bottom confirms with a bullish break of structure above 0.5980, we could expect a continuation toward:
First Target: FVG zone around 0.6015
Second Target: Major resistance near 0.6150, where past distribution occurred.
✅ Conclusion
This setup combines key smart money concepts:
Liquidity grab below support
Accumulation phase at demand
FVG as target
Potential bullish market structure shift
Traders should monitor price action around the support zone for confirmation (e.g., bullish engulfing or break of short-term highs) before entering long positions. Targets remain at the FVG and resistance zones, but risk management is essential in case of a deeper sweep or macroeconomic catalyst.

ETHUSD Smart Money Breakdown – Price Rejection from Premium ZoneEthereum has shown a strong impulsive rally after multiple Breaks of Structure (BOS) from early June, signaling a clear shift in market sentiment from bearish to bullish. Each BOS indicates that demand zones have been respected and liquidity has been efficiently used to fuel higher prices — a classic signature of institutional involvement.
🧠 Smart Money Insight
As price aggressively rallied into the resistance zone ($3,600–$3,800), the market entered a premium pricing area, where smart money typically offloads positions and hunts liquidity from late buyers. This area has historically been a high reaction zone — and as seen on the chart, ETH shows signs of buyer exhaustion, suggesting a possible short-term reversal.
🔁 Anticipated Market Behavior
A corrective move is likely from this resistance, and the first target for retracement lies in the support zone around $3,000–$3,200. This level aligns with:
Previous BOS retest area
Fair value imbalance fill
Mid-range equilibrium
If momentum continues downward, the next zone of interest will be the strong support region at $2,200–$2,400, which served as a major accumulation zone. That’s where large orders previously entered the market — and a strong reaction is expected again.
📊 Market Structure Summary:
BOS Confirmations: Validated bullish structure
Liquidity Grab: At resistance – potential sweep and reversal
Premium Zone Rejection: Smart money short opportunity
Discount Zone Targets: Support & strong support zones
✅ Conclusion
ETH is at a critical decision point. If price holds below resistance with continued bearish pressure, a retracement is not only healthy — it's expected. Traders should wait for confirmation of lower timeframe structure breaks before entering shorts, and target the $3,000 zone first, with eyes on $2,200 if momentum persists.

CAD_JPY BULLISH BIAS|LONG|
✅CAD_JPY is trading along
The rising support
And as the pair will soon retest it
I am expecting the price to go up
To retest the supply levels
Above at 108.708
LONG🚀
✅Like and subscribe to never miss a new idea!✅
Disclosure: I am part of Trade Nation's Influencer program and receive a monthly fee for using their TradingView charts in my analysis.

EUR-AUD Strong Uptrend! Buy!
Hello, Traders!
EUR-AUD is trading along
The rising support line in a
Strong uptrend so we we are
Bullish biased and as the pair
Is going down to retest the
Support we will be expecting
A rebound and a move up
Buy!
Comment and subscribe to help us grow!
Check out other forecasts below too!
Disclosure: I am part of Trade Nation's Influencer program and receive a monthly fee for using their TradingView charts in my analysis.

EUR_NZD LONG FROM RISING SUPPORT|
✅EUR_NZD is trading in an uptrend
Along the rising support line
Which makes me bullish biased
And the pair is about to retest the rising support
Thus, a rebound and a move up is expected
With the target of retesting the level above at 1.9544
LONG🚀
✅Like and subscribe to never miss a new idea!✅
Disclosure: I am part of Trade Nation's Influencer program and receive a monthly fee for using their TradingView charts in my analysis.

USD-JPY Will Keep Growing! Buy!
Hello,Traders!
USD-JPY is trading in an
Uptrend along the rising
Support line and the pair
Already made a bullish
Rebound and is consolidating
In a local range so as we
Are bullish biased we will
Be expecting a further
Bullish move up
Buy!
Comment and subscribe to help us grow!
Check out other forecasts below too!
Disclosure: I am part of Trade Nation's Influencer program and receive a monthly fee for using their TradingView charts in my analysis.

CRUDE OIL BEARISH BREAKOUT|SHORT|
✅CRUDE OIL broke the rising
Support line which is now a resistance
And the price made a retest an a pullback
So we we are bearish biased and we
Will be expecting a further
Bearish move down
SHORT🔥
✅Like and subscribe to never miss a new idea!✅
Disclosure: I am part of Trade Nation's Influencer program and receive a monthly fee for using their TradingView charts in my analysis.
