CAD_JPY STRONG UPTREND|LONG|
✅CAD_JPY is trading in an uptrend
Along the rising support line
Which makes me bullish biased
And the pair is already making
A bullish rebound from the support
So a further move up is expected
With the target of retesting the
Level above at 107.705
LONG🚀
✅Like and subscribe to never miss a new idea!✅
Smartmoneyconcept

USOIL FREE LONG SIGNAL|
✅CRUDE OIL retested the strong support level of 65.14$
After trading in a local downtrend from some time
Which makes a bullish rebound a likely scenario
With the Take Profit of 65.93 and SL of 64.69$
LONG🚀
✅Like and subscribe to never miss a new idea!✅

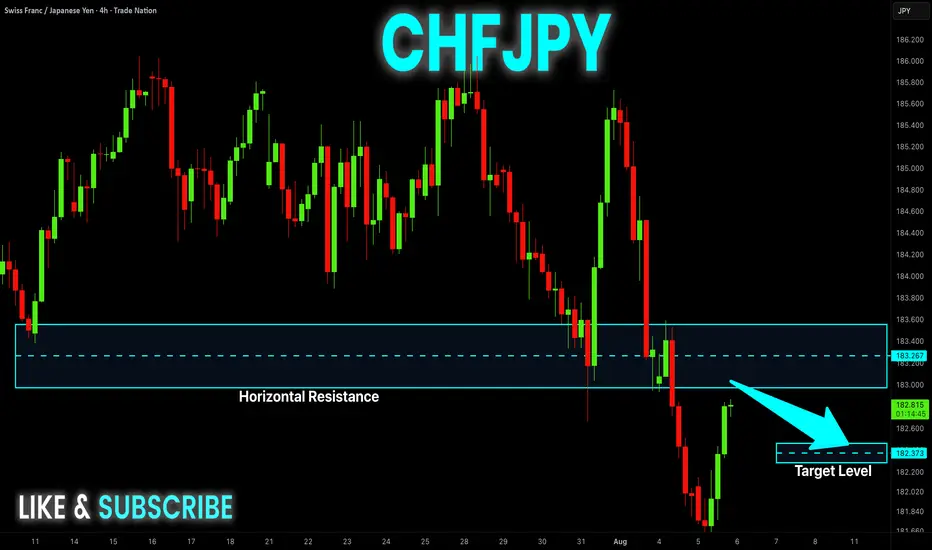
CHF-JPY Potential Short! Sell!
Hello,Traders!
CHF-JPY is making a rebound
But we are bearish biased
And after the pair hits the
Horizontal resistance of 183.400
We will be expecting a
Local bearish correction
Sell!
Comment and subscribe to help us grow!
Check out other forecasts below too!
Disclosure: I am part of Trade Nation's Influencer program and receive a monthly fee for using their TradingView charts in my analysis.
NZD_JPY LOCAL SHORT|
✅NZD_JPY went up sharply
But a strong resistance level was hit at 87.100
Thus I am expecting a pullback
And a move down towards the target of 86.937
SHORT🔥
✅Like and subscribe to never miss a new idea!✅

EUR-NZD Short From Resistance! Sell!
Hello,Traders!
EUR-NZD keeps growing
But the pair is locally overbought
So after the pair hits a horizontal
Resistance of 1.9680 we will
Be expecting a local correction
Sell!
Comment and subscribe to help us grow!
Check out other forecasts below too!
Disclosure: I am part of Trade Nation's Influencer program and receive a monthly fee for using their TradingView charts in my analysis.

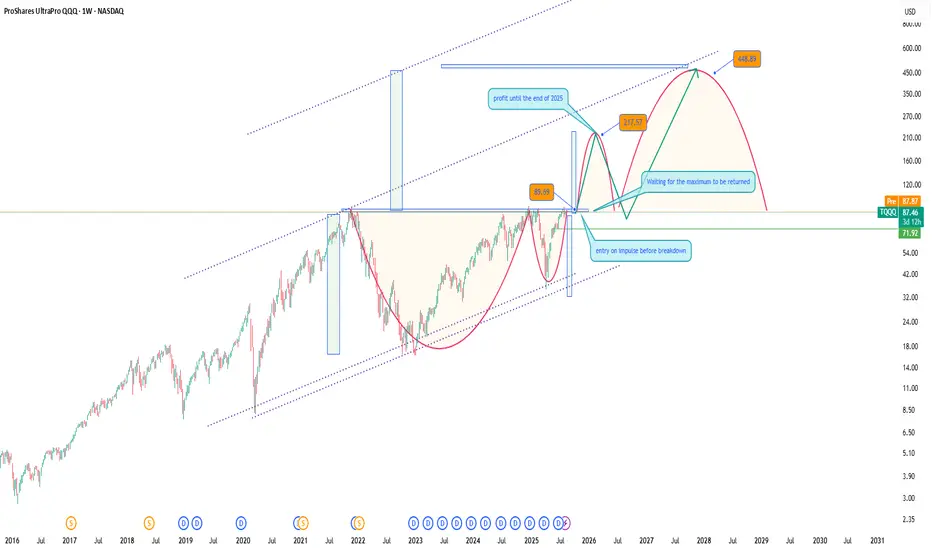
ProShares UltraPro QQQ (TQQQ) LONGThe Technology Sector Continues to Break Records
The tech sector keeps setting new highs, and alongside individual stocks, it's a great idea to consider investing in an ETF that mirrors the profits of the NASDAQ 100 index. One of the most attractive options is TQQQ - it’s more affordable than the index itself, yet offers similar growth potential aligned with the entire tech sector.
I expect continued growth through the end of the year, assuming the geopolitical landscape remains relatively stable.
From a technical standpoint, those looking to minimize risk might prefer to wait for a retest of previous highs. However, my approach is to gradually build a position both before the breakout and after the retest of the highs.
A classic technical analysis pattern -the cup formation, also supports the bullish case for entry. As George Soros wrote in his book: “What moves the market : our expectations or the events themselves?” I’d say it’s both. The key is not to miss the wave.
P.S. Don’t forget: with TQQQ, you also receive dividends - a nice bonus while riding the trend.
GBP_NZD BULLISH BREAKOUT|LONG|
✅GBP_NZD broke the key structure level of 2.2500
While trading in an local downtrend
Which makes me bearish
And I think that after the retest of the broken level is complete
A rebound and bearish continuation will follow
SHORT🔥
✅Like and subscribe to never miss a new idea!✅

GBP-JPY Bearish Bias! Sell!
Hello,Traders!
GBP-JPY is going down
And the pair made a breakout
Of the key horizontal level
Of 195.500 so we are
Bearish biased and we
Will be expecting a
Further bearish move down
Sell!
Comment and subscribe to help us grow!
Check out other forecasts below too!
Disclosure: I am part of Trade Nation's Influencer program and receive a monthly fee for using their TradingView charts in my analysis.

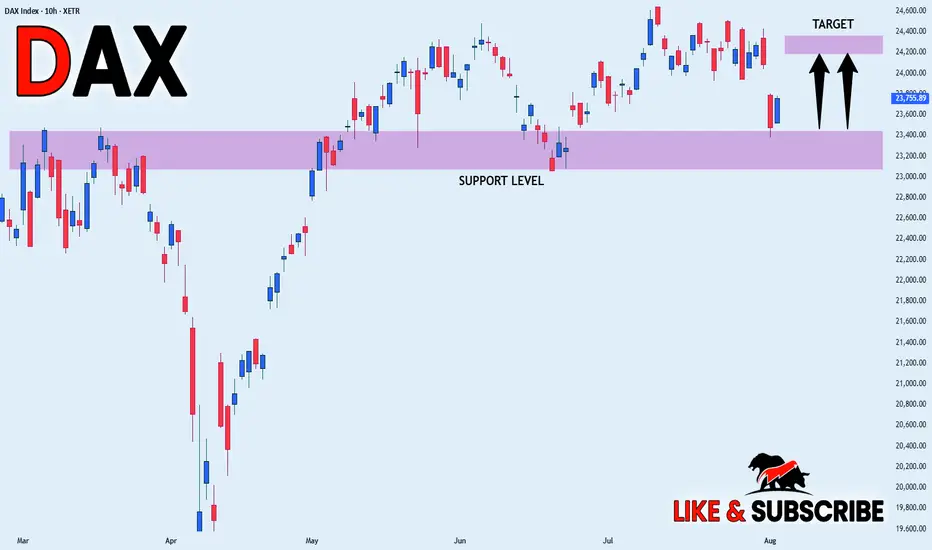
DAX WILL GROW|LONG|
✅DAX is trading in an
Uptrend and the index made
A bullish rebound from the
Horizontal support of 23,400
Which reinforces our bullish
Bias and we will be expecting
A further bullish move up
LONG🚀
✅Like and subscribe to never miss a new idea!✅
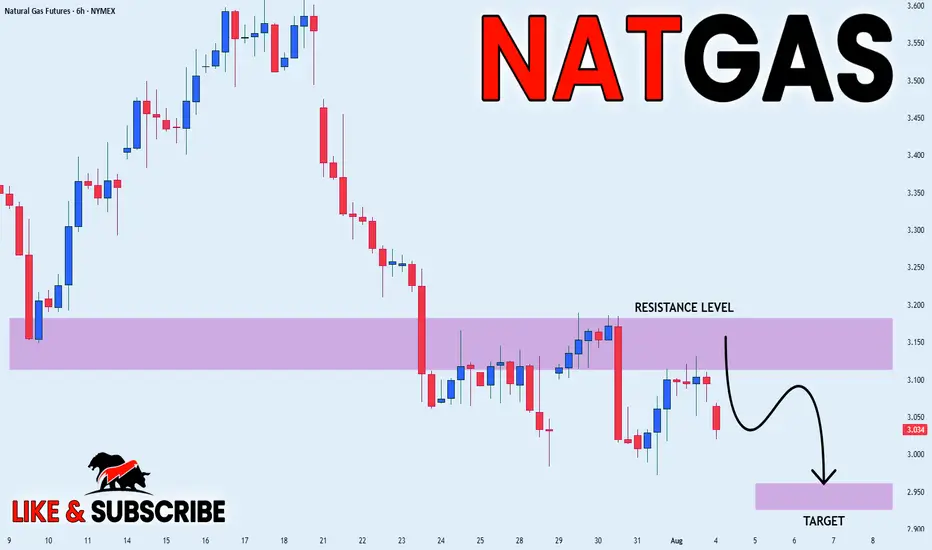
NATGAS Risky Long! Buy!
Hello,Traders!
NATGAS keeps falling down
In a strong downtrend
And Gas is locally oversold
So after the price hits the
Horizontal support of 2.860$
We will be expecting a
Local bullish correction
Buy!
Comment and subscribe to help us grow!
Check out other forecasts below too!
Disclosure: I am part of Trade Nation's Influencer program and receive a monthly fee for using their TradingView charts in my analysis.

EUR_JPY SUPPORT AHEA|LONG|
✅EUR_JPY is going down now
But a strong support level is ahead at 169.757
Thus I am expecting a rebound
And a move up towards the target of 170.400
LONG🚀
✅Like and subscribe to never miss a new idea!✅
Disclosure: I am part of Trade Nation's Influencer program and receive a monthly fee for using their TradingView charts in my analysis.

EUR-CHF Resistance Ahead! Sell!
Hello,Traders!
EUR-CHF went up sharply
And the pair is locally
Overbought so after it
Hits the horizontal resistance
Above at 0.9367 we will be
Expecting a local bearish correction
Sell!
Comment and subscribe to help us grow!
Check out other forecasts below too!
Disclosure: I am part of Trade Nation's Influencer program and receive a monthly fee for using their TradingView charts in my analysis.

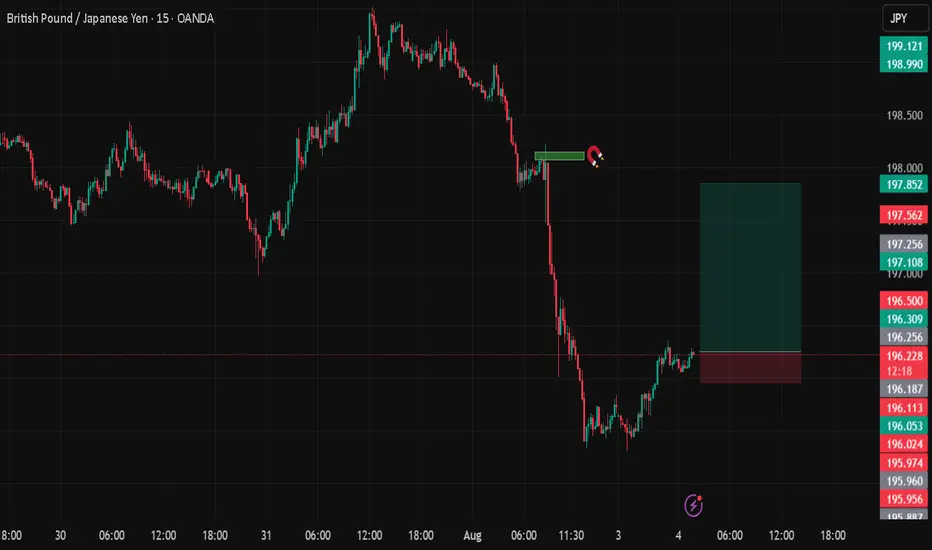
GBPJPYDate:
August 3,2025
Session:
Tokyo Session
Pair:
GBPJPY
Bias:
Long
Fridays New York open left a liquidity pool. I see todays Asia or London session sweeping that area.
Entry:196.254
Stop Loss:195.957
Target:197.847
RR:5.32
XAUUSD Technical Analysis – Bullish Continuation SetupXAUUSD Technical Analysis – Bullish Continuation Setup
📊 Market Structure Overview:
The chart shows a clear bullish structure shift, marked by multiple Break of Structure (BOS) events that validate strength from buyers. After forming equal lows and a liquidity sweep at the strong support zone, price has aggressively moved higher, breaking through minor resistance levels and showing clear bullish intent.
🧱 Key Technical Elements:
🔹 1. Strong Support Zone (Demand Rejection)
Price respected the strong demand zone between $3,260 – $3,280, where aggressive buying was seen after forming a bullish engulfing breakout. This zone aligns with previous demand and a major BOS, confirming institutional buying interest.
🔹 2. Bullish Order Flow & Break of Structure (BOS)
Multiple BOS levels across July and early August highlight a sequence of higher highs and higher lows, indicating trend continuation.
The most recent BOS after July 30 shows an impulsive break, confirming bullish dominance and clean order flow.
🔹 3. Fair Value Gaps (FVGs)
Bullish FVG (Mid-July): Price respected and bounced from this zone, showing previous imbalance was filled and used as a base for continuation.
New FVG (Above $3,420): The current upside target lies within this area, acting as a magnet for price due to unfilled orders.
🔹 4. Buy-Side Liquidity & Target Zone
The market is approaching a buy-side liquidity zone around $3,385, a key short-term target where previous highs and stop orders are likely pooled.
If liquidity above $3,385 is taken efficiently, price may expand into the FVG zone between $3,420 – $3,460.
🔹 5. Bullish Confirmation & Momentum
The candle structure shows a clean bullish impulsive move, followed by minor consolidation—likely a bullish flag/pennant indicating potential for further continuation.
Momentum is favoring buyers, and short-term consolidation above $3,340 is healthy for continuation.
🔐 Liquidity & Institutional Narrative
Equal Lows (EQL) and FVG fills suggest prior liquidity was swept and used to fuel institutional long positions.
The recent BOS confirmed that smart money has shifted bias toward longs, and price is now targeting remaining inefficiencies to the upside.
The clear alignment of BOS, liquidity sweep, and bullish FVGs reinforces a strong institutional footprint on this move.
🔍 Key Levels to Watch:
Level Type Price Zone (USD)
🔺 Resistance / FVG 3,420 – 3,460
🎯 Immediate Target 3,385
📉 Short-Term Support 3,340 – 3,320
🛡️ Major Demand Zone 3,260 – 3,280
📌 Conclusion & Outlook:
XAUUSD has initiated a strong bullish leg from the demand zone, confirming accumulation and structural reversal. Price is now moving toward the buy-side liquidity target of $3,385, with potential continuation toward the FVG resistance zone of $3,420–$3,460.
As long as price remains above the $3,320 structure support, the bullish bias remains intact. Any pullbacks should be seen as buying opportunities, especially on lower timeframe confirmations.

NATGAS WILL FALL|SHORT|
✅NATGAS has retested a key resistance level of
And as the pair is already making a bearish pullback
A move down to retest the demand level below at 1.3434 is likely
SHORT🔥
✅Like and subscribe to never miss a new idea!✅
NZD-CAD Will Go UP! Buy!
Hello,Traders!
NZD-CAD made a retest
Of the horizontal support level
Of 0.8125 from where we
Are already seeing a nice
Bullish rebound so we will
Be expecting a further
Bullish move up
Buy!
Comment and subscribe to help us grow!
Check out other forecasts below too!
Disclosure: I am part of Trade Nation's Influencer program and receive a monthly fee for using their TradingView charts in my analysis.

BTC Hits Premium Zone – Bearish Reversal Loading? BTC Hits Premium Zone – Bearish Reversal Loading?
🧠 Technical Breakdown:
🔹 1. Previous Market Structure & CHoCH
The chart shows a clear shift in structure (CHoCH) on the left, which marked the start of the bearish leg.
Break of Structure (BOS) confirms continuation of lower highs and lower lows until recent liquidity grab near the $112,551 zone.
Equal highs and liquidity above were taken out, making the move into the Premium Order Block zone highly significant.
🔹 2. Liquidity and Fair Value Gap (FVG) Zones
A major Liquidity + FVG zone was left unmitigated between $113,000–$112,000, and price is likely to revisit it.
This aligns with the target zone at $112,890, which is highlighted as a magnet for price to rebalance the inefficiency.
🔹 3. Order Block & Premium Supply Zone
A well-defined Order Block is marked just below the resistance zone near $115,166–$116,021.
Price is currently retracing into this zone, suggesting a potential reaction point for smart money to re-enter shorts.
Volume is expected to pick up here, and a reversal could initiate if price fails to break above this supply.
🔹 4. Volume Profile and Market Imbalance
Volume clusters are heaviest near the $114,000–$114,300 range, indicating high activity and previous accumulation/distribution.
Thin volume near the $112,551 zone further confirms price may drop quickly if rejection happens.
🔹 5. Support & Liquidity Sweep
Support zone around $112,551 is a previous liquidity pool and weak low that has not been fully cleared.
Price is likely to revisit this zone in the short term to clear liquidity and complete market rebalancing.
🔐 Institutional Narrative:
Smart money engineered a liquidity sweep to the downside, then caused a retracement into premium.
Now, BTC/USD is positioned in a high-risk zone where sell-side institutions may enter to push price lower.
If this order block holds, expect a rejection toward $112,890, followed by possible deeper continuation into the liquidity void below.
📌 Key Levels:
Level Price (USD)
Strong Resistance Zone 115,166 – 116,021
Order Block (Sell Area) 114,800 – 116,000 (approx.)
Immediate Support 113,000 – 112,551
Target (Liquidity Zone) 112,890
Weak Low (Final Sweep) 112,000
📉 Trade Outlook & Strategy:
🔺 If price reacts bearishly at Order Block:
Look for lower timeframe BOS/CHoCH confirmation.
Entry: Short on rejection at or near $115,000–$115,500
Target 1: $112,890
Target 2: $112,000 (extended liquidity sweep)
Stop-loss: Above $116,200 (invalidates bearish OB)
🔻 If price breaks and closes above $116,021 with momentum:
Structure flips bullish, and the OB is invalidated.
Look for long setups on retracement to $114,000 zone.
🧭 Conclusion:
BTC/USD is currently trading within a Premium Zone, testing a strong Order Block below key resistance. Price may face a bearish reaction, targeting the liquidity zone at $112,890. Smart money footprints suggest a potential trap for breakout buyers, and if momentum fades, we can expect a downside reversal to sweep remaining liquidity.

SILVER Move Down Ahead! Sell!
Hello,Traders!
SILVER is about to retest
A horizontal resistance level
Of 37.21$ and its a strong
Key level so after the retest
We will be expecting a
Local pullback
Sell!
Comment and subscribe to help us grow!
Check out other forecasts below too!
Disclosure: I am part of Trade Nation's Influencer program and receive a monthly fee for using their TradingView charts in my analysis.

NZD_CAD REBOUND AHEAD|LONG|
✅NZD_CAD has been falling recently
And the pair seems locally oversold
So as the pair retested a horizontal support of 0.8125
And made a rebound
Price growth is to be expected
LONG🚀
✅Like and subscribe to never miss a new idea!✅

GOLD CORRECTION AHEAD|SHORT|
✅GOLD is going up now
But a strong resistance level is ahead at 3377$
Thus I am expecting a pullback
And a move down towards the target of 3352$
SHORT🔥
✅Like and subscribe to never miss a new idea!✅
Disclosure: I am part of Trade Nation's Influencer program and receive a monthly fee for using their TradingView charts in my analysis.

EUR-USD Will Fall! Sell!
Hello,Traders!
EUR-USD will hit the
Horizontal resistance of 1.1620
On Monday after making a
Powerful move up on Friday
And as the pair is locally
Overbought a local bearish
Correction is to be expected
Sell!
Comment and subscribe to help us grow!
Check out other forecasts below too!
Disclosure: I am part of Trade Nation's Influencer program and receive a monthly fee for using their TradingView charts in my analysis.

BITCOIN LONG FROM SUPPORT|
✅BITCOIN has retested a key support level of 112k
And as the coin is already making a bullish rebound
A move up to retest the supply level above at 115k is likely
LONG🚀
✅Like and subscribe to never miss a new idea!✅
Disclosure: I am part of Trade Nation's Influencer program and receive a monthly fee for using their TradingView charts in my analysis.

NZD-CHF Risky Long! Buy!
Hello,Traders!
NZD-CHF keeps falling and
Will hit the horizontal support
Of 0.4738 on Monday from
Where we will be expecting
A local rebound and a
Bullish move up
Buy!
Comment and subscribe to help us grow!
Check out other forecasts below too!
Disclosure: I am part of Trade Nation's Influencer program and receive a monthly fee for using their TradingView charts in my analysis.
