S&P 500 Shows Indecision Near All-Time HighS&P 500 Shows Indecision Near All-Time High
As the S&P 500 chart shows, this morning the price approached yesterday’s high at A, but then sharply reversed downward (indicated by the arrow), forming a lower low at B.
This resembles a Double Top pattern, which can be interpreted as market indecision near the all-time high. Traders are weighing risks and opportunities that depend on US actions in Venezuela:
- Bullish factor: access to the country’s resources could act as a growth driver for the US economy. Yesterday, financials and energy sectors were the strongest performers.
- Bearish factor: related to geopolitical risks and the potential involvement of the US in a protracted conflict.
E-mini S&P 500 Technical Analysis
On 29 December, we noted the indecision of bulls around the 6934 level, as the price showed no signs of firmly holding the record highs. We also considered a scenario in which the S&P 500 might decline.
Since then, the trend has largely been bearish, and a descending channel can be drawn, with:
- The median (dashed line) passing through lower highs.
- Yesterday’s move into the upper half of the channel appearing aggressive, given the sharp surge from 6888.
This level may act as support for bulls on their way toward the upper boundary of the channel.
On the other hand, a bearish break of the 6888 level:
- would provide an additional signal of demand indecision;
- would reinforce the descending channel’s relevance as a market reference.
This article represents the opinion of the Companies operating under the FXOpen brand only. It is not to be construed as an offer, solicitation, or recommendation with respect to products and services provided by the Companies operating under the FXOpen brand, nor is it to be considered financial advice.
Standardandpoor500

The S&P 500 Index Trades Near Its All-Time HighThe S&P 500 Index Trades Near Its All-Time High
As indicated by the S&P 500 index chart:
→ After breaking above the resistance line (shown in red) in the third week of December, the equity market formed an upward trend, consistent with the typical characteristics of the Santa Claus Rally.
→ At the opening of trading in the final week of the year, the market is showing downward momentum. The index has slipped towards the 6,920 area, reflecting the sentiment of remaining market participants ahead of key news releases: the FOMC meeting minutes on 30 December and US labour market data on 31 December.
Technical Analysis of the S&P 500 Chart
Price action analysis points to a lack of conviction among bulls. After breaking above the 11 December high near the 6,934 level, further progress was limited, with the price failing to show signs of firm consolidation at record highs.
At the same time, bears became more active, as evidenced by the long upper shadow (marked by the arrow). Their pressure proved effective, resulting in a break below the median line of the ascending channel.
It cannot be ruled out that bearish momentum will continue, pushing the S&P 500 index down towards a support zone formed by:
→ the psychological 6,900 level and the 24 December low near 6,907;
→ the lower boundary of the Santa Claus Rally ascending channel.
This article represents the opinion of the Companies operating under the FXOpen brand only. It is not to be construed as an offer, solicitation, or recommendation with respect to products and services provided by the Companies operating under the FXOpen brand, nor is it to be considered financial advice.

SPX500 at Range Highs — Breakout or Another Rejection?Summary:
SPX500 has rallied back into a well-defined resistance zone after a fake downside penetration from demand. Price is once again compressing near range highs, making this area critical for the next directional move.
Technical Breakdown:
Market Structure: Price remains in a broader range, respecting clear demand (lower purple zone) and resistance (upper purple zone). Higher lows from the recent demand reaction show short-term bullish momentum within the range.
Key Levels:
The range box midline (~6,767) has acted as a clean equilibrium level with multiple reactions — price acceptance above it favors buyers.
The recent fake penetration below mid-range support (highlighted on your chart) suggests sell-side liquidity was swept before aggressive buying stepped in.
Resistance Behavior: The upper zone has at least three clear touches, confirming it as strong supply. Each test shows slowing momentum, signaling decision time.
Candlestick Context: Strong bullish impulses from demand with shallow pullbacks indicate active buyers, but no confirmed breakout close above resistance yet.
Fundamental Context:
With US indices supported by expectations of looser financial conditions in 2026 and resilient corporate earnings, dips continue to attract buyers. However, year-end positioning and macro data sensitivity keep upside capped near key technical levels.
Key Price Levels (3-touch validation):
Resistance: 6,900–6,920 (range highs, multiple rejections)
Mid Support: ~6,765–6,770 (range equilibrium, role flip level)
Demand Zone: 6,560–6,600 (major buy-side reaction area)
Upside Target (on breakout): 6,980–7,000
Downside Target (on rejection): 6,650 then 6,580
Takeaway:
➡️ Bullish if price accepts and closes above 6,920, opening the door for range expansion higher.
➡️ Bearish / mean-reversion if resistance holds and price loses 6,765, targeting the demand zone again.
#SP500 #Indices #PriceAction #TradingView #MarketStructure #SupplyAndDemand

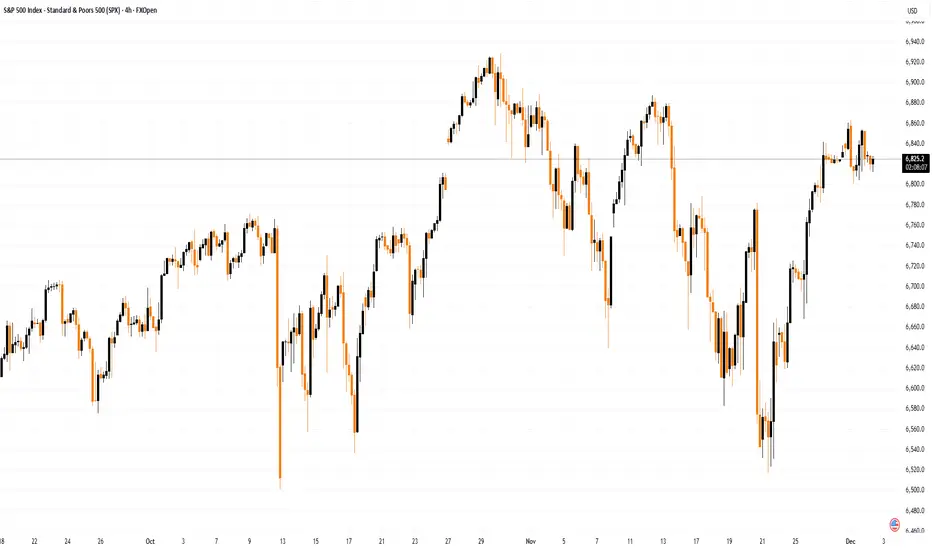
S&P 500 Index: Chart Analysis After Friday’s Sell-OffS&P 500 Index: Chart Analysis After Friday’s Sell-Off
Trading on 12 December was overshadowed by a sharp decline in the S&P 500, with the session low approaching December’s previous trough.
Among the key fundamental drivers behind Friday’s drop was the market reaction to Broadcom’s quarterly report. Shares (AVGO) plunged more than 10%, possibly as investors aggressively took profits in tech stocks, concerned that the AI hype may be overheated.
A review of the 4-hour chart of the S&P 500 suggests that Friday’s negative sentiment may have begun to ease, as the index is now recovering. Overall, this presents an interesting picture from a price-action perspective.
Technical Analysis of the S&P 500 Chart
Five days ago, we noted that an ascending channel had formed in early December, which could be interpreted as cautious optimism ahead of key news.
However, Fed-related announcements triggered a surge in volatility (as we described, “the calm before the storm”), pushing prices beyond both boundaries of the blue channel:
→ The failure to hold above the upper boundary can be seen as bulls lacking confidence to challenge the all-time high. The false break around 6929 looks like a trader trap.
→ Conversely, bears may have been unable to suppress buying near Friday’s low, as indicated by the long lower wicks on the candles (highlighted by the arrow).
The chart now shows a complex Megaphone pattern (marked A–F).
It is possible that the coming week will be characterised by consolidation following Wednesday–Friday’s swings, with market sentiment increasingly influenced by the approaching holiday period.
This article represents the opinion of the Companies operating under the FXOpen brand only. It is not to be construed as an offer, solicitation, or recommendation with respect to products and services provided by the Companies operating under the FXOpen brand, nor is it to be considered financial advice.

S&P 500 Index: Chart Analysis Ahead of Fed NewsS&P 500 Index: Chart Analysis Ahead of Fed News
On 2 December, we noted that the final month of the year is traditionally favourable for the S&P 500 index, as:
→ since around the 1950s, December has been positive in more than 70% of cases;
→ the average monthly gain is approximately +1.0%.
Today, with traders worldwide focused on the Federal Reserve’s interest rate decision and Chair Powell’s subsequent press conference, there is reason to highlight another statistic. According to media reports, in 20 out of 20 instances when equity markets were near record highs and the Fed cut rates, the S&P 500 rose over the following 12 months.
Given the current backdrop — proximity to all-time highs and expectations of rate cuts — it is possible that this could become the 21st such case.
An analysis of price action on the 4-hour chart of the S&P 500 suggests that the stock market is reflecting nervous anticipation of the news, as the index is trading at roughly the same levels as at the start of December.
Technical Analysis of the S&P 500 Chart
From the demand side:
→ the price has managed to hold firmly above the 6785 level (which may act as support going forward) and has broken above a previously formed descending channel (shown in red);
→ an ascending channel formed in early December, which can be interpreted as cautious optimism ahead of the news.
From the supply side:
→ the late-October record high may act as psychological resistance;
→ yesterday’s decline (indicated by the arrow) suggests that bears are ready to act more aggressively if given a catalyst.
Overall, taking the above into account, it is reasonable to suggest that the S&P 500 market is in a “calm before the storm” phase. Be prepared for volatility spikes later today, starting from 22:00 GMT+3.
This article represents the opinion of the Companies operating under the FXOpen brand only. It is not to be construed as an offer, solicitation, or recommendation with respect to products and services provided by the Companies operating under the FXOpen brand, nor is it to be considered financial advice.

S&P500: Futures Stuck in Tight Range S&P 500 futures traded mostly sideways yesterday, remaining confined within a tight range. In our primary scenario, however, we anticipate that magenta wave (4) will soon resume its downward move. During this phase, the index is expected to initially break below the support levels at 6540 and 6371 points. We then look for the final low of the wave (4) correction to occur within our green Long Target Zone between 6163 and 5912 points. Once this low is established, the subsequent wave (5) should propel prices above resistance at 6952, marking the peak of the broader blue wave (III). Immediately after, we expect the onset of magenta wave (1), which should kick off a significant corrective phase. However, if the index continues to fall below the Long Target Zone, our alternative scenario may come into play (probability: 31%). In that case, it would suggest that the alternative blue wave alt.(III) has already completed and the major correction is already in progress.

S&P 500 Index: Early December Chart AnalysisS&P 500 Index: Early December Chart Analysis
December is traditionally a favourable month for the S&P 500 :
→ Since the 1950s, December has ended higher in over 70% of years.
→ Average monthly gain is around +1.0%.
Will the index rise in 2025? Much depends on the Federal Reserve meeting on 10 December, as well as other factors, including geopolitical developments. Interest is also piqued by an upcoming statement from Trump at the White House (today, 22:00 GMT+3), though the topic remains undisclosed.
Technical Analysis of the S&P 500 Chart
Demand-side perspective:
→ The rebound from November’s low was aggressive, rising roughly +5% in 10 days.
→ Price climbed above the blue trendline that has acted as support since summer.
→ The recent dip (marked by the red trajectory) could be a temporary correction, forming a Bull Flag pattern.
Supply-side perspective:
→ The red trajectory has not yet been breached.
→ Recent price movements show a strong bearish Head and Shoulders pattern, along with signs of a Quasimodo formation, emerging around the attempt to break the upper boundary.
In the short term, the former resistance at 6785 may now act as support. Overall, the S&P 500 is likely to adopt a wait-and-see stance, adjusting as economic news, delayed by the government shutdown, is released.
This article represents the opinion of the Companies operating under the FXOpen brand only. It is not to be construed as an offer, solicitation, or recommendation with respect to products and services provided by the Companies operating under the FXOpen brand, nor is it to be considered financial advice.
S&P500: Poised for Further Pullback The S&P 500 futures are currently trading just above support at 6,540 points, but are expected to see a temporary pullback within magenta wave (4). In our primary scenario, we anticipate the sell-off will extend into the green Long Target Zone between 6,163 and 5,912 points. From this area, we expect the start of wave (5), which would complete the magenta five-wave sequence and push the index higher—ideally above resistance at 6,952 points. This move would also mark the final high of the broader blue wave (III). However, if selling pressure intensifies and the Long Target Zone is breached, our alternative scenario will come into play (probability: 31%). In this case, blue wave alt.(III) would already be complete, and the index would enter a significantly deeper correction phase.

S&P500: Slightly higherS&P 500 futures edged slightly higher in yesterday’s session. The index appears to remain within the upward trajectory of magenta wave (5), which is expected to continue pushing higher. Once this wave reaches its peak, the larger blue wave (III) should also complete. Afterward, we anticipate a corrective phase in the form of magenta wave (A), which could put renewed pressure on the index. However, if prices reverse course and fall below the support level at 6,371, our alternative scenario will come into play. In that case, alternative wave alt.(4) would likely extend further downward, targeting a low within the corresponding alternative zone between 6,055 and 5,822 points (probability: 30%).

S&P500: Rebound S&P 500 futures managed to stage a modest rebound in yesterday’s session and are now showing renewed upward momentum. In our primary scenario, we expect magenta wave (5) to continue climbing and to ultimately mark a final high that completes the larger blue wave (III). Afterward, we anticipate a corrective phase via magenta wave (A), which should pull the index toward support at 6,371 points. However, if prices drop directly below the 6,371 points support, our alternative scenario will come into play. In that case, the alternative wave alt.(4) would likely extend further downward, finding its low within the magenta alternative Target Zone between 6,055 and 5,822 points.

S&P500: Rising?S&P 500 futures edged slightly lower in yesterday’s session but are expected to remain within the upward trajectory of magenta wave (5), which, under our primary scenario, is likely to continue moving higher. This advance would also complete the larger blue wave (III). Afterward, we anticipate a corrective phase in magenta wave (A), which should put renewed pressure on the index. At the same time, we are monitoring our alternative scenario, which suggests that magenta wave alt.(3) has not yet concluded. If prices drop below the support level at 6,371 points, this scenario will come into play. In that case, wave alt.(4) would likely extend further downward, reaching its low within the magenta alternative Target Zone between 6,055 and 5,822 points (probability: 30%).

S&P 500 Index Shows Elevated VolatilityS&P 500 Index Shows Elevated Volatility
On the 4-hour chart of the S&P 500 Index (US SPX 500 mini on FXOpen), the ATR indicator with standard settings has not fallen below the 30 mark, signalling higher current market volatility compared to previous periods. Traders’ decisions are being influenced by the ongoing government shutdown, developments around a potential US-China tariff deal, and an increasingly active earnings season. Market sentiment has also been shaped by renewed concerns over regional bank stability and profit-taking in AI-related stocks.
Looking ahead, the new week is also expected to bring heightened volatility, as:
→ US Treasury Secretary Scott Bessent and Chinese Vice Premier He Lifeng are set to meet in the coming days, paving the way for a potential meeting between Presidents Trump and Xi later this month.
→ Attention will also turn to quarterly results from Netflix, Coca-Cola, Tesla, IBM, and Intel. With key US economic data releases suspended due to the government shutdown, investors are likely to look to corporate earnings for direction.
Technical Analysis of the S&P 500 Chart
Major turning points on the 4-hour S&P 500 chart, highlighted in bold, outline a broad ascending channel that reflects the market’s expanded price swings.
From a bullish perspective:
→ The price remains in the upper half of the channel.
→ Market sentiment is improving, with prices moving closer to last week’s highs during the European session.
→ As indicated by the arrow, a wide bullish engulfing pattern formed near the lower boundary of the channel, confirming strong buying interest around the 6,560 level.
From a bearish standpoint:
→ Selling pressure was particularly aggressive near 6,720, pushing the price lower on 10 October.
→ Last week, this level once again acted as resistance, suggesting that bears maintain control there, limiting near-term upside potential.
Given these dynamics, traders may wish to adjust their strategies to account for the prevailing volatility. Should positive headlines emerge on US-China trade progress, supported by upbeat corporate forecasts, the S&P 500 could make a push towards the upper channel boundary, potentially setting a new record near the 6,800 mark.
This article represents the opinion of the Companies operating under the FXOpen brand only. It is not to be construed as an offer, solicitation, or recommendation with respect to products and services provided by the Companies operating under the FXOpen brand, nor is it to be considered financial advice.

S&P500: Rebound Offers Relief, But Downtrend Likely to ContinueThe S&P 500 managed to recover somewhat, which helped to partially offset the recent sell-offs. However, we continue to expect the ongoing wave (4) in magenta to extend further to the downside. We anticipate that the low of this wave will be reached within the similarly colored long Target Zone (6,055 points – 5,822 points), before a new upward move begins that should push the index above resistance at 6,812 points. At that level, the magenta five-wave sequence should be completed, and the high of the higher-level wave (III) in blue should be established. Given recent price action, we have added a bearish alternative scenario to the chart. This scenario suggests that the most recent high has already marked the end of the large wave alt.(III) in blue, and that the index has since entered the corrective wave alt.(IV) . If support at 5,528 points is breached, this scenario will be triggered. Long positions within the magenta Target Zone could therefore be protected with a stop set 1% below the lower edge of the zone to limit risk.

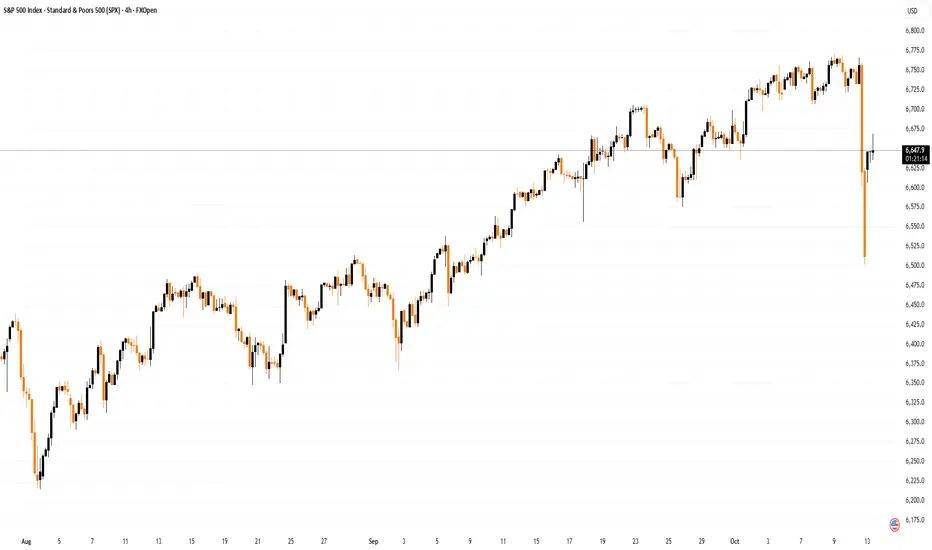
Trump’s Decision Shakes Global Financial MarketsTrump’s Decision Shakes Global Financial Markets
On Friday, 10 October, President Trump made an unexpected statement about the possible introduction of 100% tariffs on Chinese goods, triggering sharp price swings across global markets:
→ Stock markets: The S&P 500 index tumbled by more than 3%, hitting its lowest level in over a month.
→ Currency markets: The US dollar slumped sharply against other major currencies.
However, on Sunday, Donald Trump softened his tone on Truth Social, suggesting that trade relations with Beijing “will be absolutely fine”. Vice President JD Vance echoed this sentiment, adding that the United States is ready for talks if China is “prepared to act reasonably”.
This shift in rhetoric from US officials helped markets recover, with the S&P 500 index rebounding sharply at Monday’s open, reclaiming much of Friday’s losses.
Technical Analysis of the S&P 500 Chart
In our previous analysis of the 4-hour S&P 500 chart (US SPX 500 mini on FXOpen) on 4 October, we identified an upward channel (shown in blue) and expressed several concerns:
→ The price was approaching the upper boundary of the channel, where long positions are often closed for profit.
→ The latest peak slightly exceeded the October high (A), suggesting a potential bearish divergence.
→ The news blackout caused by the government shutdown created an “information vacuum”, which could quickly turn sentiment negative if filled with adverse developments.
The lower boundary of the blue channel offered only temporary support near 6,644 points on Friday before the price broke downwards. Doubling the channel width provides a projected target near 6,500, which coincides with Friday’s low.
Given these factors, it can be assumed that the lower line of the blue channel now acts as the median of a broader range following Friday’s sell-off. This suggests that in the coming days, the S&P 500 index may stabilise as demand and supply find temporary balance along this line.
Looking further ahead, the situation may resemble that of early April, when after a panic-driven market drop (also triggered by Trump’s tariff comments), the S&P 500 not only fully recovered but went on to reach new highs.
Key Levels:
→ 6,705 – a level that has acted as both support and resistance this autumn;
→ 6,606 – the boundary of the bullish gap.
This article represents the opinion of the Companies operating under the FXOpen brand only. It is not to be construed as an offer, solicitation, or recommendation with respect to products and services provided by the Companies operating under the FXOpen brand, nor is it to be considered financial advice.
$SPX500 Swing Trade: Bullish SMA Setup!📈 S&P 500 CFD: Thief’s Bullish Pullback Plan 🤑💰
🚨 Swing/Day Trade Setup: S&P 500 Index CFDSteal profits with this 200 SMA Pullback Plan using the "Thief" layered entry strategy! 📊💸 Below is a detailed breakdown combining technicals, fundamentals, and market sentiment to help you navigate this bullish opportunity. Let’s dive in! 🐂
🎯 Trading Plan Overview
Asset: S&P 500 Index CFD ( FOREXCOM:SPX500 )
Bias: Bullish 🐂
Strategy: Pullback to 200 SMA with layered "Thief" limit orders for entries
Why This Plan?
Technicals: The S&P 500 is riding record highs with strong momentum, supported by the 200 SMA as a dynamic support level.
Fundamentals: Cooling inflation (PPI -0.1% vs. +0.3% expected), 100% Fed rate cut probability, and robust corporate earnings (+10% in 2025, +13% in 2026) fuel bullish sentiment.
Sentiment: Neutral Fear & Greed Index (51/100) with low volatility (VIX ~15.04) and AI-driven institutional flows (e.g., Oracle +30%).
📊 Thief’s Technical Setup
Entry Strategy:
Use the Thief Layered Entry approach with multiple buy limit orders to catch pullbacks:
🔔 Buy Limit 1: $6,460
🔔 Buy Limit 2: $6,480
🔔 Buy Limit 3: $6,500
🔔 Buy Limit 4: $6,520
💡 Pro Tip: Adjust layer levels based on your risk tolerance and market conditions. You can enter at any price level or add more layers for flexibility!
Entry Trigger: Pullback to the 200 SMA for optimal risk-reward.
Stop Loss (SL):
Suggested "Thief" SL: $6,440 (below key support).
⚠️ Note: Adjust your SL based on your risk management and strategy. Trade at your own risk, dear Traders!
Take Profit (TP):
Target: $6,700 (near resistance, potential overbought zone, or "police barricade" trap).
🚨 Note: Escape with profits before resistance hits! Set your TP based on your goals—don’t blindly follow mine. Take money at your own risk!
📡 Real-Time Market Data (10 Sept 2025, UTC+1)
Daily Change: +37.43 points (+0.57%)
YTD Performance: Record highs driven by AI optimism and Fed rate cut expectations.
😰😊 Fear & Greed Index
Current Sentiment: Neutral (Score: 51/100)
Breakdown:
📈 Market Momentum: Bullish (S&P 500 above 125-day MA).
🌬️ Volatility (VIX): Low (~15.04), signaling calm markets.
🛡️ Safe Haven Demand: Moderate (bonds lagging stocks).
💰 Junk Bond Demand: Slight greed (narrowing yield spreads).
⚖️ Options Activity: Balanced put/call ratio.
🏛️ Macro & Fundamental Analysis
Producer Price Index (PPI): August PPI fell -0.1% (vs. +0.3% expected), easing inflation concerns.
Fed Rate Cut: 100% probability of a 25-50 bps cut in September 2025.
Labor Market: Weaker-than-expected (911K jobs revised down through March 2025).
Corporate Earnings: Strong outlook (+10% growth in 2025, +13% in 2026).
Key Drivers:
🚀 AI investment surge (e.g., Oracle +30%, Nvidia strength).
🌍 Geopolitical risks (Poland-Russia tensions, Middle East concerns).
📉 Trade policy uncertainties (Trump tariff threats).
🐂🐻 Sentiment Analysis
Institutional Outlook: Cautiously optimistic
🏦 Deutsche Bank & Wells Fargo: S&P 500 targets at 7,000+ by 2026.
💡 Focus: AI capex and earnings resilience.
Retail Trader Mood: Mixed but leaning bullish
📈 Meme stock activity (e.g., GameStop +10%).
₿ Crypto correlation (Bitcoin at $111.9K, Solana at 7-month highs).
⚡ Why This Plan Stands Out
Technical Edge: The 200 SMA pullback is a proven strategy for swing/day traders, offering high-probability entries.
Thief Strategy: Layered limit orders maximize flexibility and reduce risk of missing the move.
Macro Support: Cooling inflation, Fed rate cuts, and AI-driven earnings create a bullish backdrop.
Sentiment Boost: Neutral sentiment with low volatility supports steady upside potential.
Risks to Watch: Geopolitical shocks, overvaluation concerns, and seasonal market weakness.
🔍 Related Pairs to Watch (in USD)
Nasdaq 100 CFD ( NASDAQ:NDX ): Tracks tech-heavy AI stocks driving S&P 500 momentum.
VIX ( TVC:VIX ): Monitor volatility spikes for potential reversals.
US 10-Year Treasury Yield ( TVC:TNX ): Impacts risk sentiment and stock valuations.
FX:USDJPY : Correlates with risk-on/risk-off market moves.
Bitcoin ( BITSTAMP:BTCUSD ): Tracks retail sentiment and risk appetite.
🚨 Key Takeaways
🏆 S&P 500 at record highs, supported by soft PPI and Fed cut expectations.
😎 Neutral sentiment with a greedy tilt if macro data improves.
🤖 AI trade dominates institutional flows, powering bullish momentum.
📅 Watch upcoming CPI data and Fed meeting for next catalysts.
✨ “If you find value in my analysis, a 👍 and 🚀 boost is much appreciated — it helps me share more setups with the community!”
#SPX500 #SwingTrading #DayTrading #ThiefStrategy #Bullish #TechnicalAnalysis #Macro #AI #FedRateCut #TradingIdeas

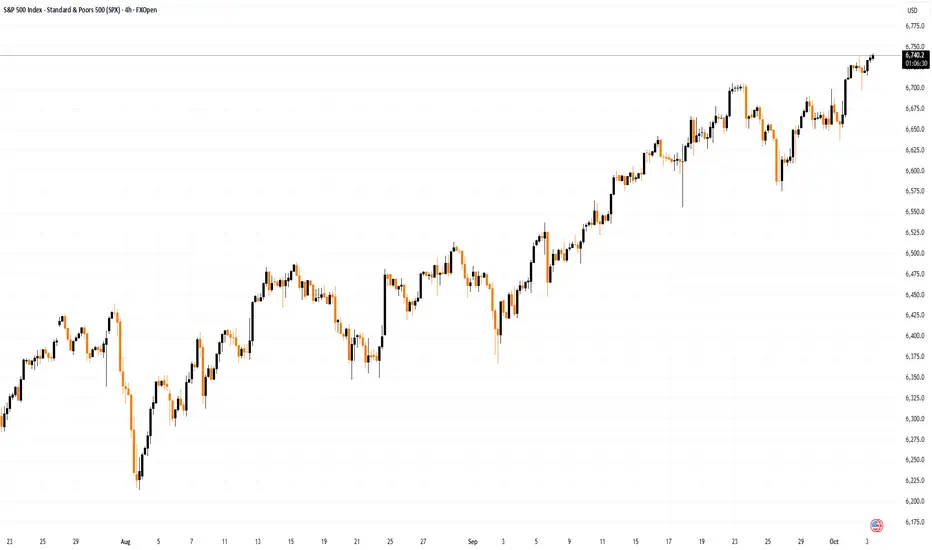
The S&P 500 index remains positive against all oddsThe S&P 500 index remains positive against all odds
We noted on 29 September that, amid the US shutdown, sentiment in the S&P 500 index market remained positive, and highlighted factors supporting further growth.
Today, the S&P 500 index reached a fresh all‑time high: on Friday morning the price rose above 6 740 points. This confirms the continued optimism among market participants. Today this is supported by news related to the creators of ChatGPT.
According to media reports, OpenAI:
→ has reached a valuation of $500 billion following a deal in which current and former employees sold shares worth around $6.6 billion;
→ is expanding cooperation with semiconductor manufacturers in South Korea, which is expected to sustain the company’s high growth rate.
Thus, OpenAI’s successes are boosting investor optimism ahead of the upcoming earnings season.
These and other positive developments might have been overshadowed by the regular Non‑Farm Employment Change report (and other US labour market data), but the Bureau of Labour Statistics is closed due to the shutdown.
Technical analysis of the S&P 500 chart
Recent data on the 4‑hour chart of the S&P 500 index underline sustained optimism, as the price develops within a previously established ascending channel, highlighted in blue.
From a bullish perspective:
→ bulls showed strength by breaking a local resistance level at 6 700, which later acted as support (indicated by an arrow);
→ local peaks allow for steeper upward trendlines to be drawn;
→ if the move from A→B is seen as the main impulse and B→C as a correction, the correction appears shallow, as the reversal upwards occurred from the 0.382 Fibonacci level, highlighting strong demand.
From a bearish perspective:
→ the price is approaching the upper boundary of the channel, where profit‑taking by long holders is typical;
→ the current peak on the e‑mini S&P 500 chart slightly exceeds the October high (A), suggesting the potential for a bearish divergence;
→ the absence of news creates an “information vacuum” that could significantly influence market sentiment if filled with negative data.
Nonetheless, optimism persists, with Tom Lee (Fundstrat) forecasting that the S&P 500 index will exceed 7 000 points by year‑end.
This article represents the opinion of the Companies operating under the FXOpen brand only. It is not to be construed as an offer, solicitation, or recommendation with respect to products and services provided by the Companies operating under the FXOpen brand, nor is it to be considered financial advice.
S&P500: More Upside Likely Before PullbackThe North American Mass Index kicked off the new week with some momentum, extending its climb within the ongoing magenta wave (3). For now, we anticipate this upward trend could continue before reaching a new high. Afterward, we expect a pullback as part of the subsequent wave (4), likely bringing the index into the magenta long Target Zone between 6,283 and 5,781 points. In our view, this price range offers attractive opportunities for long positions, as wave (5) is expected to follow—potentially pushing the index significantly higher and completing the larger blue wave (III). To protect newly established long positions, a stop can be set 1% below the lower boundary of the Target Zone.

The S&P 500 Index Remains Positive Against the OddsThe S&P 500 Index Remains Positive Against the Odds
Today, the S&P 500 Index is trading close to a new all-time high, having opened Monday above 6,675 points. This reflects continued optimism among market participants despite factors such as:
→ The risk of a U.S. government shutdown on 1 October.
Today, President Trump will meet with Democratic and Republican leaders in Congress to try to prevent a halt to government funding. However, Reuters reports that chances of reaching an agreement are slim. At the same time, Bank of America analysts remain calm, noting that a shutdown would shave only around 0.1% off GDP per week, and historically such closures have had little impact on financial markets.
→ Jerome Powell’s hawkish stance at the September Federal Reserve meeting.
Nevertheless, most market participants expect the Fed to make another move towards cutting rates at its next meeting on 29 October. The publication of the PCE index on Friday increased this likelihood, as the figures came in line with forecasts, reducing the risk of a renewed inflation surge.
Technical Analysis of the E-mini S&P 500 Chart
On 17 September, analysing the 4-hour chart of the S&P 500 Index, we noted:
→ the price continues to fluctuate within an ascending channel, highlighted in blue;
→ the long body of the bullish candle on 11 September points to strong buyer pressure, indicating an imbalance, or, in Smart Money Concept terminology, a Fair Value Gap (FVG).
At present, the channel remains relevant, but it has expanded — bullish sentiment has shifted the key line (marked in orange) from resistance to support. At the same time, the FVG zone has confirmed its role as support.
Possible developments: the chart indicates a buyer advantage:
→ strong demand near the channel’s median (evident in the long lower shadows from Friday, marked with an arrow);
→ buying activity has been strong enough to push the price back (for now) within the ascending channel.
If buyer dominance continues, this could lead to a new all-time high, testing the upper boundary of the channel. From a bearish perspective:
→ the psychological level of 6,700 could act as resistance;
→ continued growth at Monday’s open could push the RSI indicator into overbought territory, creating potential for a correction.
However, as long as the S&P 500 Index remains above the orange support line, there is reason to believe that the bulls remain in control.
This article represents the opinion of the Companies operating under the FXOpen brand only. It is not to be construed as an offer, solicitation, or recommendation with respect to products and services provided by the Companies operating under the FXOpen brand, nor is it to be considered financial advice.

S&P 500 Index (SPX) Weekly TF – 2025
Chart Context:
Tools Used: 3 Fibonacci Tools:
1. One **Fibonacci retracement** (from ATH to bottom)
2. Two **Trend-Based Fibonacci Extensions**
* Key Levels and Zones:
* **Support Zone** (Fib Confluence): \~4,820–5,100
* **Support Area (shallow pullback)**: \~5,500–5,600
* **Resistance & TP Zones:**
* TP1: **6,450** (Fib confluence & -61.8%)
* TP2: **6,840** (-27%)
* TP3: **7,450–7,760** (Major Confluence)
Technical Observations:
* SPX is approaching a **critical resistance** near previous ATH (\~6,128) with projected upward trajectory.
* The **green dashed path** suggests a rally continuation from current \~6,000 levels to TP1 (\~6,450), TP2 (\~6,840), and eventually TP3 (\~7,450–7,760), IF no major macro shock hits.
* The **purple dotted path** suggests a potential retracement first to \~5,600 (shallow correction) or deeper into \~5,120 or even 4,820 zone before continuing the bullish rally.
* The major support zone around **4,820–5,120** includes key Fib retracement levels (38.2% and 61.8%) from both extensions and historical breakout levels.
Fundamental Context:
* US economy shows **resilience** amid soft-landing narrative, though inflation remains sticky.
* The **Federal Reserve** is expected to cut rates in **Q3–Q4 2025**, boosting equity valuations.
* Liquidity expansion and dovish outlook support risk assets, including **equities and crypto**.
* However, **AI-driven tech rally** may be overstretched; a correction could follow earnings disappointments or macro surprises (e.g., jobs or CPI shocks).
Narrative Bias & Scenarios:
**Scenario 1 – Correction Before Rally (Purple Path)**
* If SPX faces macro pushback (e.g., high CPI, hawkish Fed), expect retracement to:
* 5,600 = Fib -23.6% zone
* 5,120–4,820 = Major Fib Confluence Zone
* These would act as **accumulation zones**, setting up next leg up toward TP1 and beyond.
* **Effect on Gold**: May rise temporarily due to risk-off move.
* **Effect on Crypto**: Could stall or correct, especially altcoins.
**Scenario 2 – Straight Rally (Green Path)**
* If Fed confirms cuts and macro remains soft:
* SPX breaks ATH (\~6,128)
* Hits TP1 (\~6,450), TP2 (\~6,840)
* Eventually reaches confluence at **TP3 (7,450–7,760)**
* **Effect on Gold**: May struggle; investor preference for equities.
* **Effect on Crypto**: Strong risk-on appetite, altseason continuation.
Indicators Used:
* 3 Fibonacci levels (retracement + 2 extensions)
* Trendlines (macro and local)
* Confluence mapping
Philosophical/Narrative Layer:
This phase of the market resembles a test of collective confidence. Equity markets nearing ATHs while monetary easing begins reflect a fragile optimism. The Fibonacci levels act as narrative checkpoints — psychological as much as mathematical. Will we rally on faith or fall for rebalancing?
Bias & Strategy Implication:
Bias: Bullish with caution
* Strategy:
* Await **confirmation breakout >6,128** for fresh long entries
* Accumulate on dips in the **5,100–5,500** zone if correction unfolds
* Use **TP1, TP2, TP3** as staged exits
Related Reference Charts:
* BTC.D Analysis – Bearish Bias:
* TOTAL:Bullish Bias
*TOTAL3 – Bullish Bias:
* US10Y Yield – Falling Bias Impact:https://www.tradingview.com/chart/US10Y/45w6qkWl-US10Y-10-Year-Treasury-Yield-Weekly-TF-2025/

S&P 500 Index Holds Near Record High Ahead of Fed AnnouncementS&P 500 Index Holds Near Record High Ahead of Fed Announcement
At 21:00 GMT+3 today, the Federal Reserve will announce its interest rate decision, followed by Jerome Powell’s press conference. The rate is widely expected to be cut from 4.25%–4.50% to 4.00%–4.25%.
This will conclude a prolonged intrigue fuelled by President Trump:
→ his constant criticism of Powell for pursuing an “overly tight” policy;
→ the decision to dismiss Federal Reserve Board member Lisa Cook, which markets perceived as direct pressure on the regulator’s independence.
In anticipation of the outcome, traders are showing optimism. The S&P 500 index reached a new all-time high yesterday, climbing above 6,640 points. This morning the price pulled back slightly, which can be interpreted as a short-term correction ahead of a key event. Effectively, the market has already priced in the expected policy easing, viewing it as a catalyst for further growth.
Technical Analysis of the S&P 500 Chart
Six days ago, when analysing the 4-hour chart of the S&P 500 (US SPX 500 mini on FXOpen), we noted that:
→ the price was oscillating within an upward channel (marked in blue);
→ in September, the index has been following a steep bullish trajectory (marked in orange), with its lower line showing signs of support.
Since then, favourable inflation data helped the bulls break above the channel’s upper boundary (highlighted with an arrow).
Possible scenarios:
Bullish perspective:
→ The breakout candle above the blue channel has a long body, signalling strong buying momentum – an imbalance, also known in Smart Money Concept (SMC) as a Fair Value Gap (FVG).
→ The local level of 6,600, once resistance, has now turned into support; the next target could be the psychological level of 6,700.
→ The price is consolidating above the blue channel’s upper boundary, indicating robust demand.
Bearish perspective:
→ The upper boundary of the orange channel may act as resistance.
→ The RSI indicator, although off overbought territory, remains close to it – potentially deterring buyers from entering at elevated prices.
Taking all of this into account, the current balance could easily be disrupted once the Fed announces its rate decision – arguably the most significant event of the month in the economic calendar. Be prepared for spikes in volatility, as sharp moves in either direction are possible.
This article represents the opinion of the Companies operating under the FXOpen brand only. It is not to be construed as an offer, solicitation, or recommendation with respect to products and services provided by the Companies operating under the FXOpen brand, nor is it to be considered financial advice.

S&P 500 Hits Record High Ahead of CPI ReportS&P 500 Hits Record High Ahead of CPI Report
Today at 15:30 GMT+3, the Consumer Price Index (CPI) report will be released.
In anticipation of the figures, traders remain optimistic – the S&P 500 index reached a new all-time high yesterday, climbing above 6,560 points.
The bullish sentiment is driven by:
→ Expectations of an interest rate cut in September, which is believed to provide a positive boost to the US economy (and increase corporate profits).
→ A sharp rally in Oracle (ORCL) shares. The company announced it had signed four multibillion-dollar contracts with three different clients.
Technical Analysis of the S&P 500
On the 4-hour chart of the S&P 500 index, the price continues to move within an ascending channel, shown in blue.
From a bearish perspective:
→ the price is near the upper boundary of the channel, which has acted as resistance for several weeks;
→ the RSI indicator is close to the overbought zone, which may discourage buyers from entering at higher prices;
→ yesterday’s candle had a long upper shadow (marked with an arrow), indicating increased selling pressure.
From a bullish perspective:
→ the local level of 6,520, after being broken, has switched from resistance to support;
→ in September, the price has followed a steep upward trajectory (marked with orange lines), with the lower line showing signs of support.
Taking this into account, we could assume that the market is in a short-term state of balance while awaiting the release of inflation data – arguably the key event of the week in the economic calendar.
Favourable figures could encourage the bulls to attempt a breakout above the upper boundary of the channel, lifting the S&P 500 to a new all-time high. Be prepared for spikes in volatility.
This article represents the opinion of the Companies operating under the FXOpen brand only. It is not to be construed as an offer, solicitation, or recommendation with respect to products and services provided by the Companies operating under the FXOpen brand, nor is it to be considered financial advice.

In September, the S&P 500 Index Reached a New All-Time HighIn September, the S&P 500 Index Reached a New All-Time High
September is a month that statistically has the worst reputation for the S&P 500. However, in 2025 things may be different, as today the index hit a record high, rising above 6,520 points.
Bullish sentiment is being driven by:
→ expectations of an interest rate cut in September, which is believed will give the US economy a positive boost (and increase corporate profits);
→ yesterday’s release of the ISM Services PMI (actual = 52.0, forecast = 50.9), which pointed to industrial growth;
→ strong corporate results – for example, Broadcom (AVGO) published a solid report yesterday.
Technical Analysis of the S&P 500 Chart
Analysing the 4-hour chart of the S&P 500 on 28 August, we:
→ identified a support zone below 6,370;
→ noted several bearish signals and suggested that 6,500 could act as psychological resistance (with a potential false bullish breakout).
Indeed, since then (as shown by the blue arrows):
→ the price made a false breakout above 6,500;
→ then dropped to 6,370 to test the support zone;
→ after which it turned upwards again, forming a broad bullish engulfing pattern.
New data allows us to refine the position of the short-term channel (marked in blue), with the following perspectives:
→ Bearish view: the price is close to the upper boundary of the channel, which already showed resistance this morning (highlighted by the red arrow) – the candlestick has a long upper shadow.
→ Bullish view: yesterday’s rally demonstrated signs of imbalance in favour of buyers (as detailed in the description of the Fair Value Gap pattern), and the breakout above 6,500 looks genuine (since the price is consolidating above it).
Both viewpoints seem to be well-reasoned, but the market is unlikely to remain in balance, as today (15:30 GMT+3) the release of US labour market data is scheduled – arguably the key event of the week in the economic calendar.
Depending on the figures, the S&P 500 might:
→ attempt to break through the upper boundary;
→ or retreat towards the median of the blue channel.
Be prepared for volatility spikes.
This article represents the opinion of the Companies operating under the FXOpen brand only. It is not to be construed as an offer, solicitation, or recommendation with respect to products and services provided by the Companies operating under the FXOpen brand, nor is it to be considered financial advice.

S&P500: Short-Term Pullback Before Next RallyS&P futures initially slipped yesterday but managed to stabilize soon. Our primary outlook is that the ongoing turquoise wave B will continue to move higher, likely topping out just below resistance at 6,675 points. After that, we expect wave C to drive the index directly into the magenta long Target Zone between 6,082 and 5,650 points, where the low of the wave (4) correction should be established. From there, the impulsive wave (5) is expected to begin, pushing the index above the 6,675 points resistance and completing the broader blue wave (III). Alternatively, there is a 35% chance that the index could break out directly above 6,675 points without first reaching the magenta Target Zone. In this scenario, the index would already be forming the alternative wave alt.(5) in magenta.
