SELLIING GBPAUD BASED OF A RISING CHANNEL IN A DOWNTRENDThis 2hr chart shows we are the top of a rising channel in the recent downtrend that GA started. Can it be a good time for sellers more or we break and retest lower before we actually see more aggressive selling? Be a reactant and not a predictor!
Support and Resistance

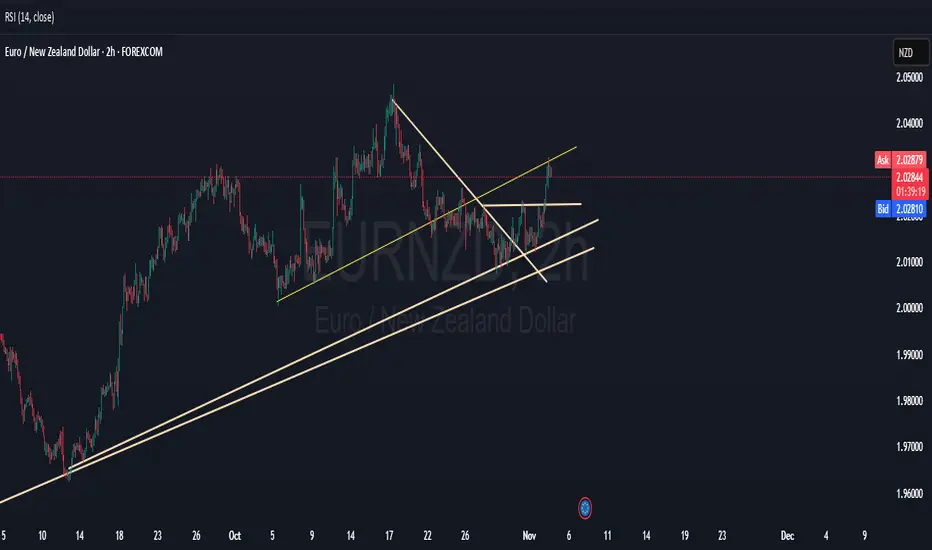
MAYBE EURNZD SHORTS CAN BE 100PIPS?From a break and retest perspective, EURNZD is poised for a sell. Only react to market and not predict. Stay safe out there and KNOW YOUR RISK APPETITE
BANKNIFTYBanknifty levels are based on imbalances
1. gapup 58300 long
2. 58300-58050 trade breakout
3. gapdown 58050 short

NIFTYNifty levels are based on imbalances
1. gapup 25800 long
2. 25800-25600 trade reversal
3. gapdown 25600 short

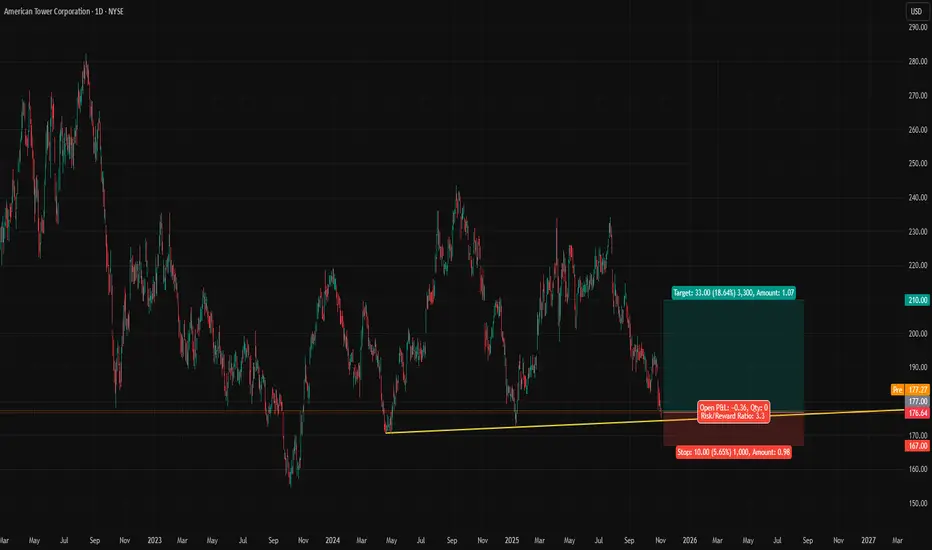
AMT Near Support with Solid Enough FundamentalsToday, I recheck my stock portfolio and open up some liquidty and look for new trade options. AMT catch my eye. Forward P/E is falling, below historical averages, nice earnings report, weaker investment, incoming rate cuts. Not a perfect stock pick overall but it is hard to catch perfect stocks at low prices. There was some insider trading, mostly in the first half of the year but it seems to be ended after July and price fell around 20%. I think the downward pressure might end and despite the rate cut for December is not a sure thing, FED is still in cutting cycle.
Technically, AMT is at a good place, close to key support. It has low - risk higher return potential. I will switch it with NYSE:GS that I took profit from.
Nifty trying to find a bottom from where it can bounce back.Nifty is trying to search bottom from where it can relaunch. The slide of Nifty continued today where it lost 165 points to close the day at 25597. The next substantial support is near 25527, 25452 and 25314. 25314 is the 50 days EMA or Mother line support. If this support is not held, it can slide further towards 25159, 24872 or even 24634 in unlikely circumstances. Resistance for Nifty remains at 25639, 25791, 25910 and 26072. Once Nifty is able to establish a bottom for relaunch the march upwards can start again. 25314 remains a very clear major level to watch for below it Nifty will become weak.
Disclaimer: The above information is provided for educational purpose, analysis and paper trading only. Please don't treat this as a buy or sell recommendation for the stock or index. The Techno-Funda analysis is based on data that is more than 3 months old. Supports and Resistances are determined by historic past peaks and Valley in the chart. Many other indicators and patterns like EMA, RSI, MACD, Volumes, Fibonacci, parallel channel etc. use historic data which is 3 months or older cyclical points. There is no guarantee they will work in future as markets are highly volatile and swings in prices are also due to macro and micro factors based on actions taken by the company as well as region and global events. Equity investment is subject to risks. I or my clients or family members might have positions in the stocks that we mention in our educational posts. We will not be responsible for any Profit or loss that may occur due to any financial decision taken based on any data provided in this message. Do consult your investment advisor before taking any financial decisions. Stop losses should be an important part of any investment in equity.

Likely Crypto Bottom After 10/10 Liquidation CascadeOn 10/10/2025 crypto had its largest liquidation cascade in history, since then the market has been extremely choppy and sentiment is generally very low despite good news and no fundamental changes
Now the lows are being retested/swept on many alts
This likely marks the bottom and I think we'll rally soon as we continue to see more institutional/TradFi inflows due to clearer regulations, rate cuts, tokenization, new altcoin ETFs, etc.
Fundamentally 2026 (and the rest of 2025) should continue to be bullish, and I think crypto is gonna start to catch up to the Gold/Nasdaq moves after underperforming for the past several months

BTCUSD Slopping down. Bearish OutlookHello
BTCUSD Daily Analysis:
- The price is currently below the 100 EMA, which remains above the 200 EMA, indicating a bearish trend overall.
- The 21 and 50 EMAs are also below the 100 EMA, reinforcing the bearish pressure over the 200 EMA.
The key resistance level then is 109,588.
- Currently, bearish movements are driven by pressure around the 111,732 area. However, the trend has not yet reversed.
🧩 The level of 100,689 acts as support. As long as this level holds, the bullish trend remains intact.
- If the price breaks below 100,689, there is potential for the trend to shift to bearish.
Overall:
🎙️A break below 100,689 could signal a trend reversal, while holding above this level may keep the bullish outlook alive.
Happy Trading;
K.
__
Not trading advice.

$BIST:AGYO potential for short & long termBIST:AGYO ⏳ waiting for downtrend invalidation & retest with 2 scenarios.
no entry unless confirmed.
not a financial advice - DYOR

BTC/USD poised to navigate deeper water?Following a 4.6% fall in October, November is already down by 5.2%, with today’s movement dipping a toe under key support between US$104,866 and US$107,692 (1M levels). This follows a rejection of resistance at US$116,344-US$114,530 (composed of 1M and 1W levels), and suggests the major cryptocurrency is headed back under US$100,000.
Below US$104,866-US$107,692, which could serve as resistance soon, limited support is evident until between US$93,902 (3M) and US$97,578 (1M). Therefore, further bearish scenarios could soon unfold.
Written by the FP Markets Research Team

EURUSD - Looking To Sell Pullbacks In The Short TermH1 - Strong bearish move.
No opposite signs.
Currently it looks like a pullback is happening.
Expecting bearish continuation until the two Fibonacci resistance zones hold.
If you enjoy this idea, don’t forget to LIKE 👍, FOLLOW ✅, SHARE 🙌, and COMMENT ✍! Drop your thoughts and charts below to keep the discussion going. Your support helps keep this content free and reach more people! 🚀
-------------------------------------------------------------------------------------------------------------------

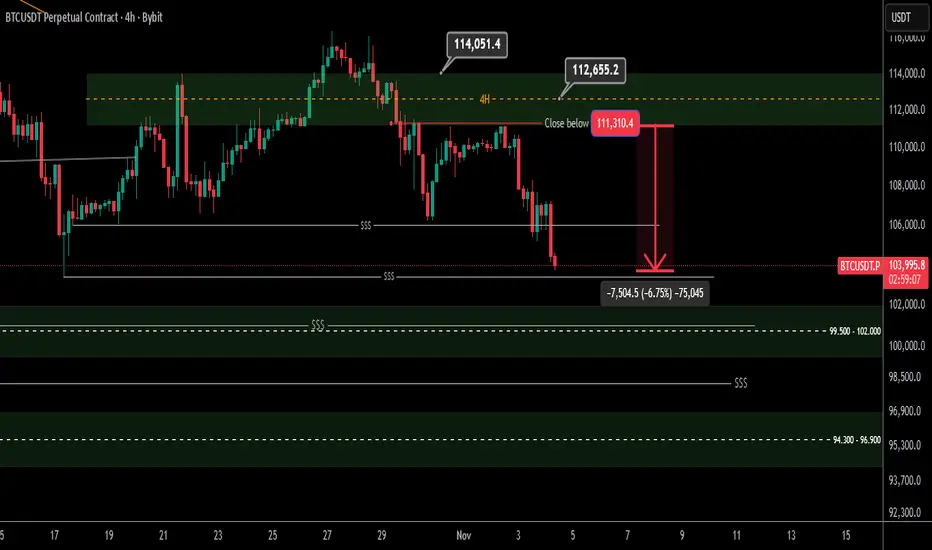
Bitcoin 4 Hour Update
Hello Traders
Bitcoin moved towards lower liquidity as expected and so far we have made a loss and profit of about $7000. This will continue to be a bearish structure to gather liquidity and important support below all these liquidity levels will be the 96k/94k range where we will look for a trigger buy
Analysis link and entry range:
EURUSD downside target: 1.139-1.146On the daily chart, EURUSD is trending downwards, with the bears in control. Currently, the price is trading below the downtrend line. Intraday, watch for resistance around 1.1540; a rebound encountering resistance could present a shorting opportunity, with support levels at the 1.139-1.146 area.

NZDJPY-1H Short Setup/RiskyChartLiquidity Taken: The 4-Day LQ above 88.80 got swept — institutions likely filled sell orders there.
CHoCH: Price flipped structure below 88.30 confirming intraday bearish intent.
BOS: Previous 1H BOS supports downside continuation.
Targets:
PMH → PWH → PDL liquidity zones aligned near 87.60 and 87.40
Expect price to rebalance the inefficiency (gray zone) before continuation.
Invalidation: A sustained break above 88.90 (4D LQ area) invalidates bearish bias.

Bitcoin’s price is at one of its most critical moments yet!👋🏻 Hey everyone! Hope you’re doing great! Welcome to SatoshiFrame channel.
✨ Today we’re diving into the 4-Hour Bitcoin analysis. Stay tuned and follow along!
👀 On the 1-hour timeframe of Bitcoin, we can observe that after failing to break above its key resistance zone, BTC moved toward the multi-timeframe lows. Losing those lows created a selling pressure, pushing the price to retest its fundamental support levels. Currently, I’ve identified two critical zones in my analysis — a breakout from either one could provide a solid trading opportunity.
⌛ Bitcoin’s volume shows a strong bias toward sell positions, to the point where buyers are barely preventing the higher timeframes from entering oversold conditions. However, if this selling pressure and volume persist, Bitcoin could break the lower boundary of its recent daily range and continue downward. Volume data gives us the best insight into market behavior, allowing us to build effective scenarios.
✍️ There are two potential scenarios for Bitcoin that I’ll briefly summarize below — both can be used as setups for positioning.
🟢 Long Scenario: If Bitcoin breaks above the resistance zone at $108,072, completes a pullback, and shows an increase in buying volume with momentum entering the market, we can open a long position. This setup looks somewhat risky, so it’s better to enter with a smaller position size. The best trigger for a long entry is located around $111,180.
🔴 Short Scenario: If Bitcoin breaks below the key support level at $105,732, it could offer a short position setup — provided that selling pressure and bearish momentum continue. After the breakdown, we’ll need to wait for a pullback before entering the trade.
❤️ Disclaimer : This analysis is purely based on my personal opinion and I only trade if the stated triggers are activated .

Potential outside week and bullish potential for AZJEntry conditions:
(i) higher share price for ASX:AZJ above the level of the potential outside week noted on 3rd October (i.e.: above the level of $3.28).
Stop loss for the trade would be:
(i) below the low of the outside week on 29th September (i.e.: below $3.17), should the trade activate.

Updated BTC Box - BTC Box 2.0Hella levels to this shit.
BTC's been struggling in the upper box for a while.
Previously achieved a look below and fail but could not go beyond the box's midpoint.
To summarize a bullish event occurred without producing a bullish result. That is objectively bearish to me.
I would like to see how BTC reacts to the previous lows and if we revisit that old bear trap from a year ago.
Maybe we get another look below and fail but I will continue to evaluate.
For now I just want to share the updated levels.

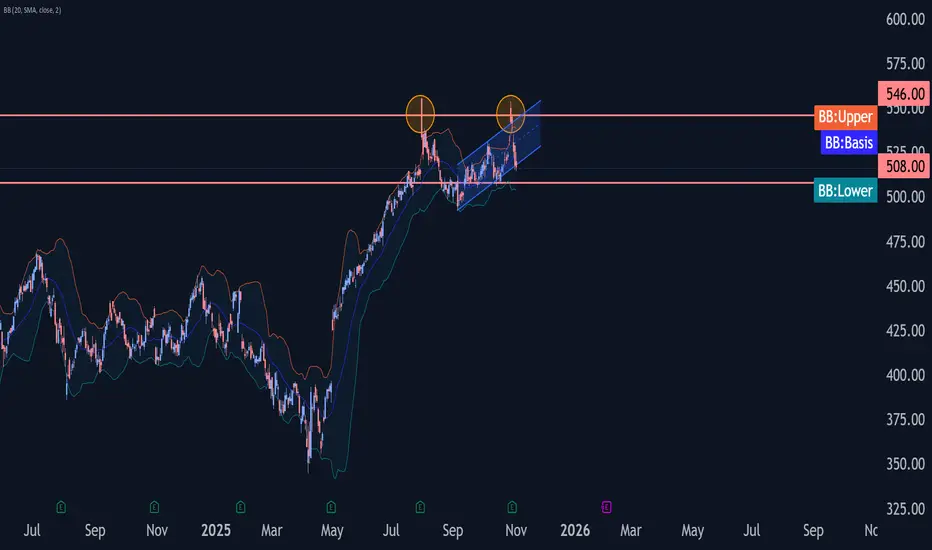
Microsoft Wave Analysis – 3 November 2025- Microsoft reversed from resistance zone
- Likely to fall to support level 508.00
Microsoft recently reversed down from the resistance zone between the key resistance level 546.00 (which stopped impulse wave (1) in July), resistance trendline of the daily up channel from September and the upper daily Bollinger Band.
The downward reversal from resistance level 546.00 started the active short-term ABC correction 2.
Having just broken the aforementioned up channel from September, Microsoft can be expected to fall to the next support level 508.00, target price for the completion of the active ABC correction 2.
NATGAS Will Keep Growing! Buy!
Hello,Traders!
NATGAS Price has broken out above the horizontal demand area with strong momentum, confirming bullish order flow. A clean displacement shows potential continuation toward the 4.50$ target zone. Time Frame 5H.
Buy!
Comment and subscribe to help us grow!
Check out other forecasts below too!
Disclosure: I am part of Trade Nation's Influencer program and receive a monthly fee for using their TradingView charts in my analysis.

Can gold prices go long amid a narrow stalemate?#XAUUSD TVC:GOLD OANDA:XAUUSD
Gold prices continued to fluctuate narrowly throughout the evening⚖️, with the hourly and 2-hour moving averages converging in the 4010-4005 range, as both bulls and bears awaited a clear directional decision from the market.📊
However, from a technical perspective, gold prices have failed to break below the 4-hour moving average support at 3995 and the daily MA5 at 3985📈. These are crucial short-term support levels🚀, and the fact that gold prices haven't broken them confirms strong buying support below💪. This suggests that any short-term decline should be viewed as a technical correction rather than a market reversal.🤔
Therefore, although the short-term direction is not yet clear, considering the support formed by the 4-hour moving average and the daily MA5, I remain bullish and await a breakout from the consolidation pattern in gold prices🐂.
There may not be much clear information tonight, so let's take a look at the performance of gold prices in the Asian session👀. In summary, the current trend is still in an upward channel. As long as the 3995-3985 level holds, I will maintain a bullish view. On the upside, pay attention to the short-term resistance at 4020-4030🤩.

EURUSDHe have a 1:3 R:R with this set up targeting the recent low. He have broken structure to the downside so I expecting that to continue. This trade is based off the 5 minute timeframe.

$BTCUSD Wyckoff accumulation in progress?BITSTAMP:BTCUSD Looking to see if this transforms to Wyckoff accumulation pattern.
Prices went under the neckline but bounced back. I entered long when prices bounced to $106,400 betting the neckline will hold.
If the neckline holds and prices take out resistances from the above, then Wyckoff accumulation pattern would be confirmed.
Range bound until either resistance breaks ($114K - 116K) or the neckline breaks ($106K)

PSU internal money shift likely?psu bank in strong trend and now with strong results and momentum
the selling volume a day ago and buying volume today show a different story for this script .however a short sell may trigger below 870 for 830 and 810 & 785 target areas .
