SOL 2D BULLISH, Entry points New HH coming up?So guy as we have seen a downtrend SOL from 180 price resistance and so now price trading on very critical area. We have fvg on 2D around 120-123 and still haven’t not been taken. So there is two scenarios and mostly like price will reject from fvg and head toward to W fvg which we have Above on Weekly TF. The confirmation will be respect to fvg and overall market conditions. Also I am bearish on SOL 2 weekly TF, which we should not forget. If price respect to fvg and overall market conditions was bullish then we can enter around 120-130 and TP will be 210-220
Support and Resistance

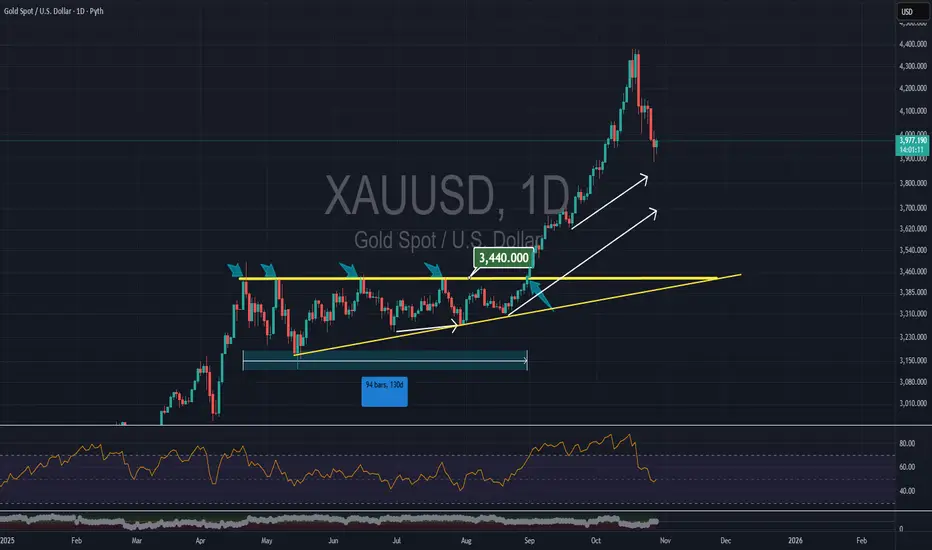
XAUUSD: Gold Battles the Key 4000 ZoneXAUUSD: Gold Battles the Key 4000 Zone
Hey everyone! Let's dive into Gold (XAUUSD) on the 4-hour chart, where we've seen some dramatic moves recently.
What We've Seen:
Gold made a strong run earlier in the month, but was firmly rejected twice at the 4400 mark, forming a clear "Double Top" pattern (marked with red circles). This led to a significant pullback, pushing price down through several support levels.
Currently, Gold has found some footing after hitting a low and is now attempting to recover.
The Current Battleground: 4000 Key Zone
Price is currently retesting the crucial 4000 Key Zone (highlighted in blue). This level acted as support previously, was broken, and is now being challenged again. The immediate task for buyers is to "Observe the price action if it can break the recent swing high" (marked with the purple circle) just below 4000, which has been acting as immediate resistance.
Scenario 1: Bullish Reclaim & Push Higher (If 4000 Holds Strong)
If Gold can successfully reclaim and hold above this 4000 Key Zone, it would be a strong bullish signal. This could open the door for:
A push towards the 4150 to 4250 1st Resistance zone, where sellers might step in again.
A more sustained recovery attempt, potentially aiming higher if that resistance is overcome.
Scenario 2: Rejection & Further Downside (If 4000 Proves Too Strong)
However, if the 4000 Key Zone acts as strong resistance and Gold fails to break above that recent swing high, we could see:
A reversal back towards the 3900 Immediate Support level.
Should 3900 fail to hold, the next significant support would be the 3800 to 3850 Next Support area.
In Summary:
The 4000 Key Zone is the pivotal point right now. Watch how price reacts here and whether it can overcome that immediate swing high resistance. This will largely dictate Gold's direction in the short term.
Disclaimer:
The information provided in this chart is for educational and informational purposes only and should not be considered as investment advice. Trading and investing involve substantial risk and are not suitable for every investor. You should carefully consider your financial situation and consult with a financial advisor before making any investment decisions. The creator of this chart does not guarantee any specific outcome or profit and is not responsible for any losses incurred as a result of using this information. Past performance is not indicative of future results. Use this information at your own risk. This chart has been created for my own improvement in Trading and Investment Analysis. Please do your own analysis before any investments.

Silver at the CrossroadsOn the daily chart of XAG/USD (Silver), the price is currently hovering just above the 50-day moving average (SMA 50), which has acted as strong dynamic support in previous pullbacks (highlighted in blue circles). This level around 45 USD is once again being tested, forming a potential higher low within the broader uptrend.
If silver successfully holds above the SMA 50 and confirms bullish momentum, the next upside targets lie near 50 USD, followed by 53–54 USD, where previous supply pressure emerged. Sustained volume and momentum could even drive an extension toward 56 USD.
However, a decisive break below 45 USD would invalidate the bullish structure and likely trigger a deeper correction. In that case, price could fall toward 42 USD, and if selling pressure persists, even retest the 40 USD region.
Short-term outlook: Watch for confirmation of a bounce from the 50-day moving average.
Long-term outlook: Trend remains bullish above 45 USD, but caution is warranted until clear reversal signals appear.
🎯 Targets: 50 → 53–54 USD
⛔ Stop-loss: Close below 45 USD

Bitcoin consolidated after a strong bullish trendBitcoin’s price has recently consolidated after a strong bullish trend. The market found significant support, suggesting that the current pullback is more of a pause than a reversal. Sellers attempted to push prices lower, but the retracement remains shallow — indicating that buyers are still defending every dip.
Technical Structure:
Price is holding above key support levels, showing strong accumulation interest. The recent consolidation appears to be a healthy correction within the broader uptrend. The structure shows higher lows forming, which supports the ongoing bullish bias. a breakout from the support zone could trigger renewed upside momentum.
If BTC maintains this structure and continues reacting positively from the support area, the next upside targets are projected around 118K – 122K
You may find more details in the chart.
Trade wisely best of Luck Buddies.
Ps; Support with like and comments for better analysis Thanks for Supporting.

Ethereum $ETH still has weekly demand in control. Will it rally?Ethereum CRYPTOCAP:ETH still has weekly demand in control. Will it rally higher? Waiting for some more bullish price action or a pullback to the weekly demand lower at $2,600.

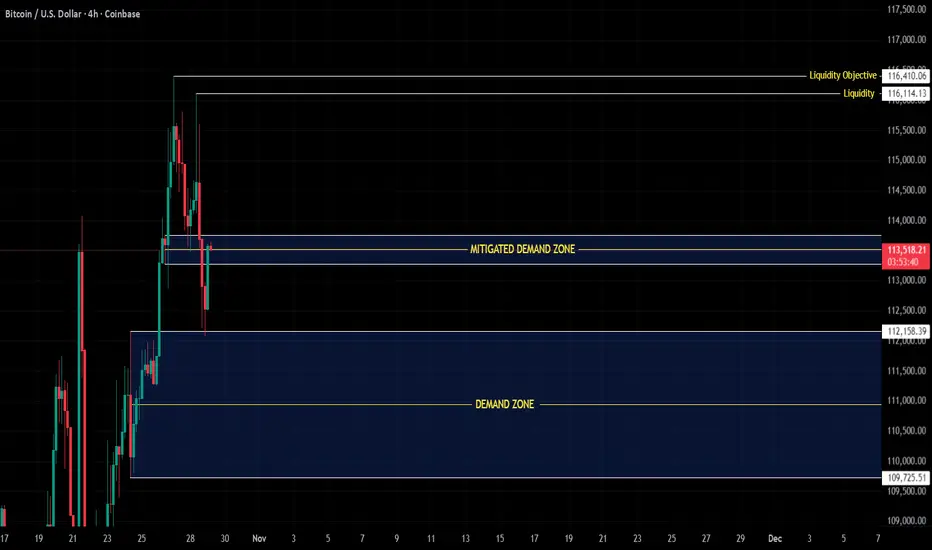
4H Structure Update-Demand Mitigated ,Next Liquidity in Sight
COINBASE:BTCUSD CRYPTO:BTCUSD BINANCE:BTCUSD KRAKEN:BTCUSD
$BTC/Price has reacted strongly from the deeper demand zone (112.15K – 109.70K), showing a clean bullish CHOCH followed by a confirmed BOS on the lower timeframes — signaling early structural alignment for potential continuation.
This reaction confirms mitigation, not reversal, as long as 109.70K remains protected.
Momentum and structure across micro and mid timeframes have now turned bullish, indicating renewed intent from buyers.
The next liquidity objective sits between 116.11K – 116.41K, where previous imbalance and resting liquidity align.
That zone also holds reversal potential, as price may face reaction or redistribution once it reaches those highs.
For now, this remains a healthy corrective phase within the bullish macro structure —
a controlled absorption and expansion sequence in play.
Structure first. Liquidity second.
Confirmation always. 💎
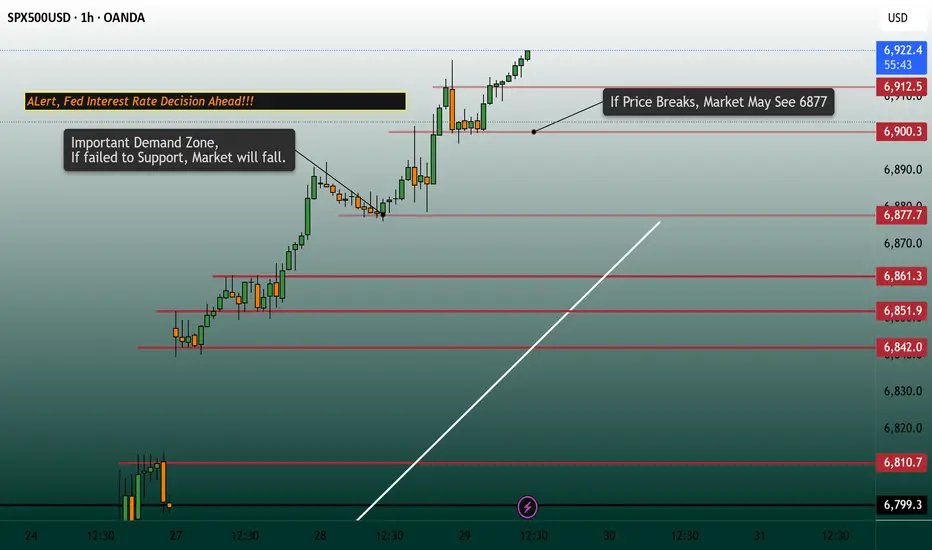
SPX | Daily Analysis #8 - 29 October 2025Hello and welcome back to DP
Market Review:
Over the past two days, as mentioned in our #7 analysis, “a sustained move above 6,860 may signal further bullish momentum toward the upside.”
This scenario played out as expected, with price reaching the 6,900 area for the first time. However, short sellers are now stepping in, attempting to fade the rally and fill the gap.
Currently, all eyes are on the upcoming Federal Reserve interest rate decision and Chairman Powell’s comments. Both China and the U.S. have remained relatively quiet, keeping market attention focused on monetary policy.
Meanwhile, President Trump stated yesterday that he intends to replace Powell in the coming months. Powell has previously clarified that the President does not have direct authority to remove the Fed Chair, so this statement adds a layer of political uncertainty.
According to CME FedWatch, there is about a 95% probability of a 25 bps rate cut being announced.
1H–4H Technical Analysis:
The 6,900 area is currently acting as a strong resistance zone, followed by the 6,878 support area.
• Bears have entered around 6,900–6,917, attempting to push prices lower.
• Bulls, however, are showing resilience and defending the zone.
If price fails to hold above 6,900, we could see a pullback toward 6,878.
Should 6,878 fail to hold, a sharper decline toward the gap zone could occur.
Given the interest rate decision, expect high volatility — with sharp moves both up and down before and after the announcement.
If you’re planning to trade this event, manage your stop loss carefully and avoid overexposure.
Disclaimer:
This content is for informational purposes only and does not constitute financial or investment advice. © DIBAPRISM
Amir D.Kohn
$HBAR 1DCRYPTOCAP:HBAR Technical Outlook (1H & 1D)
On both the 1H and 1D charts, CRYPTOCAP:HBAR has confirmed a Double Bottom pattern around the 0.155–0.16 support level, followed by a strong breakout above the neckline.
Price is now retesting the FVG 1H / 1D support zone ($0.19) — a healthy retracement that could serve as a base for continuation.
As long as price holds above this support, the structure remains bullish, with potential targets at T1: $0.218, T2: $0.23, T3: $0.245, and T4: $0.255.
Momentum indicators show a brief cooldown after the breakout, which often signals a re-accumulation phase before the next leg up.
Invalidation would occur if price closes below the $0.185 area.

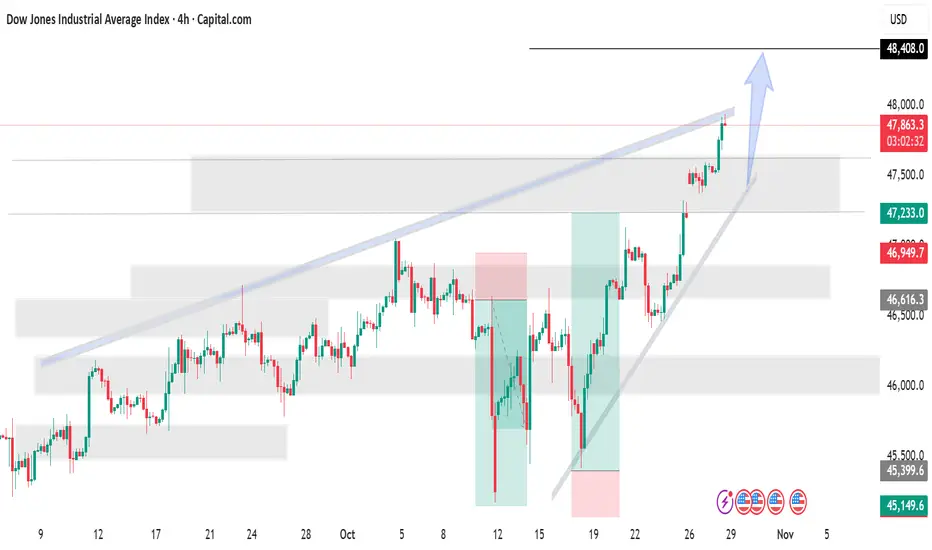
US30 ForecastThe Dow Jones Industrial Average Index is showing strong bullish momentum breaking above the ascending channel resistance. Price is holding above the 47,800 support zone and aiming toward the next key resistance near 48,400. The clear uptrend structure and breakout projection suggest further upside continuation, with buyers maintaining firm control.
"Thank you for your support! If you found this idea valuable or learned something new, please consider liking and leaving a comment. I’d really appreciate hearing your feedback and thoughts."
USNAS100 ForecastThe US100 chart shows strong bullish momentum, breaking above key resistance levels. Price is expected to retrace slightly toward the 25,750–25,500 support zone before resuming its upward move toward the 26,400–26,500 target area. Overall trend remains bullish with higher highs and higher lows formation.
"Thank you for your support! If you found this idea valuable or learned something new, please consider liking and leaving a comment. I’d really appreciate hearing your feedback and thoughts."

Gold A waiting for rebound raising hopes for a potential tradeGold prices regained some lost ground on Tuesday after breaking below the key 4,000 support level. Following a sharp 32% decline in the previous session, the market is showing signs of stabilization. The rebound was supported by encouraging progress in U.S.–China trade negotiations, as both countries agreed to withdraw threats of 100% tariffs. Additionally, optimism has increased ahead of Thursday’s meeting between U.S. President Donald Trump and Chinese President Xi Jinping, raising hopes for a potential trade deal.
Technical Outlook:
From a technical perspective, the recent decline suggests that gold prices may retest the 3,925 / 3,900 support zone. It’s important to monitor this area closely — a clear break below could open the door for deeper downside movement. On the upside, if the bulls manage to reclaim and hold above 4,050, the market could see a short-term recovery toward the 3,985 / resistance area.
You may find more details in the chart.
Trade wisely best of Luck Buddies.
Ps; Support with like and comments for better analysis Thanks for Supporting.

DeGRAM | GOLD seeks to decline📊 Technical Analysis
● Price trends inside a descending channel, posting lower highs after rejections at ~4045; latest pullback broke intraday base and points toward mid-channel.
● Bearish structure with failed bounce at prior support (~3950) keeps momentum down; next magnet sits near 3855 (channel/HTF support confluence).
💡 Fundamental Analysis
● Short-term bearish: stronger USD and improved risk appetite recently weighed on gold after the retest of record highs, triggering corrective pressure.
✨ Summary
● Bias: short toward 3950 → 3855, invalidation above 4045. Key levels: 4045 (res), 3950/3855 (supports).
-------------------
Share your opinion in the comments and support the idea with a like. Thanks for your support!

Gold — Key Resistance Zone in PlayShort-Term View (15m Chart):
Gold (XAUUSD) is approaching a critical resistance zone between $4,000 and $4,020, which has previously acted as both support and supply. The price is now testing this area after a short-term recovery from the $3,920 region.
If the price gets rejected from this zone, it could trigger a bearish continuation, targeting $3,950 → $3,900 as the next key supports. A break and close below $3,960 would confirm bearish momentum resuming.
However, if bulls manage to break and hold above $4,020, that would indicate short-term strength and may open the path for a move toward $4,080 → $4,120.
Risk Levels:
• 🟩 Bullish Setup: Buy above $4,025, stop loss $3,985, targets $4,080 / $4,120.
• 🟥 Bearish Setup: Sell below $3,960, stop loss $4,025, targets $3,900 / $3,860.
Summary:
Gold is now testing a make-or-break resistance. A breakout above $4,020 could signal the start of a relief rally, while rejection here would likely confirm the continuation of the broader downtrend.

GBPNZD - Looking To Sell Pullbacks In The Short TermH1 - Strong bearish move.
No opposite signs.
Expecting bearish continuation until the two Fibonacci resistance zones hold.
If you enjoy this idea, don’t forget to LIKE 👍, FOLLOW ✅, SHARE 🙌, and COMMENT ✍! Drop your thoughts and charts below to keep the discussion going. Your support helps keep this content free and reach more people! 🚀
-------------------------------------------------------------------------------------------------------------------

USOIL Crudeoil bullish forecast down trend breakdout🚨 USOIL (Crude Oil) Technical Update 🚨
🕒 Timeframe: 1H
📉 After a clear downtrend breakout, price has shown a strong bullish consolidation breakout from the key support zone at $60.700.
🔥 Momentum is shifting bullish, signaling potential continuation to the upside.
🎯 Technical Targets:
$61.300 — Initial resistance / short-term target
$62.000 — Mid-term bullish objective
$62.800 — Extended target / next major resistance
📊 Outlook:
As long as price holds above $60.700, buyers remain in control. Watch for sustained volume and candle confirmation for further continuation.
#USOIL #CrudeOil #TechnicalAnalysis #Forex #Commodities #Trading #Breakout #BullishMomentum 💪📈

Why I'm Suspicious Of This Bitcoin BounceThe rebound in bitcoin I warned about last week has come to fruition. Yet despite its recovery above the 200-day EMA, I remain bearish on the higher timeframes. Looking at bitcoin futures, I explain why I think bears are lurking above and may be happy to fade into rallies towards 120k.
Matt Simpson, Market Analyst at City Index and Forex.com

EUR/USD - Sell Trade setup🔥 EUR/USD 1H Forecast – Bears Back in Control! 🔥
Alright, traders — buckle up 😎
🧠 Market Structure
Price just tapped into that 1H supply zone around 1.16500, rejected hard, and is now breaking short-term structure to the downside. The clean liquidity sweep above highs flipped into bearish momentum — classic distribution setup 👇
You can clearly see a lower-high forming under the trendline, confirming HTF bearish order flow still dominates.
💣 Technical Breakdown
🧱 Supply Zone (Entry Zone): 1.1645 – 1.1660
🎯 Target Zone (Demand): 1.1550 – 1.1560
📉 Internal Structure: Break of short-term demand + retest = continuation leg
🧭 Trendline: Dynamic resistance still holding from previous swing highs
⚡ Momentum: Strong bearish candles + clean imbalance below
🩸 Game Plan
If price retests the minor 1.1630–1.1640 pocket, that’s a potential re-entry short zone for continuation toward the daily demand sitting near 1.1550.
Stops ideally above the 1.1660 wick, aiming for a 1 : 4 R-R toward the next liquidity pool.
🧩 Bias
🔻 Bearish — HTF confirms downside control, with lower-timeframe structure following through.
🧠 Quick Take
The bulls had their snack stop 🍪 at 1.1650 — now it’s time for bears to eat. If we get a clean retest, expect momentum to drive EUR/USD toward that 1.1550 low sweep before any potential bounce.

AT ENTRY Price is at our sell entry, let see how it goes because if it fails then we will likely see more buys during FOMC, but I strongly believe it will sell

GBPUSD has a chance to form a double top patternOn the daily chart, GBPUSD has formed a potential double top pattern, with short-term bears in control. Currently, attention should be paid to the support level around 1.314. If this level is broken, further declines are expected, with the first downside target around 1.300 and the second around 1.270.

GOLD volatilityThe daily RSI for Gold is approaching to oversold area and this make make volatility in Gold for the next few weeks
DeGRAM | GBPUSD is declining in the descending channel📊 Technical Analysis
● GBP/USD continues to trade within a descending channel, facing consistent rejection near 1.3380–1.3430 resistance.
● The pair is forming lower highs, with price action pointing toward renewed selling pressure targeting 1.3270 and possibly deeper channel support.
💡 Fundamental Analysis
● The pound remains under pressure as U.K. inflation expectations ease and Fed officials reaffirm a cautious stance on rate cuts, supporting the dollar.
✨ Summary
● Short bias below 1.3380; targets 1.3270–1.3220. Technical weakness and macro divergence reinforce medium-term bearish momentum.
-------------------
Share your opinion in the comments and support the idea with a like. Thanks for your support!

GOLD → Sell-off due to uncertainty FX:XAUUSD is falling, the trend is downward, and we have confirmation of this. Profit-taking is leading to a decline, which is causing buyers to exit the market...
Caution ahead of the Fed: Markets are pricing in a 25 bp rate cut, but the main thing is the tone of the statement and Powell's comments on further steps. The USD is not ready to continue its growth and is starting to look downwards. The US government shutdown continues, adding uncertainty, which supports gold.
However, an important issue is the trade deal between the US and China; a positive outcome could put pressure on gold.
Gold is balancing between hopes for a trade truce and risks from Fed policy.
Support levels: 3895, 3820
Resistance levels: 3943, 3975, 4015
Since the opening of the session, the price has fallen by 2.3%, which is an intraday range. The 3900-3895 area may see a reaction in the form of a false breakdown and a correction to the imbalance zone before a possible further decline.
Best regards, R. Linda!

AUDUSD → Attempt to reverse the trend to bullish FX:AUDUSD is forming a correction after breaking through the resistance of the downward channel. The market needs a trading range or consolidation above 0.6526.
The dollar is consolidating but is not ready to continue growing. Pressure on the currency is emerging ahead of the Fed meeting. This may support the growth of the Australian dollar.
The currency pair is entering a distribution phase after consolidation. The breakout of 0.6526 triggered a break of the downward channel resistance. An attempt to change the trend is forming. If the bulls keep the price above 0.6526, this could trigger further growth.
Resistance levels: 0.6567, 0.661
Support levels: 0.6526, 0.6493
At the moment, an attempt to change the trend has been initiated. Consolidation and distribution are a good sign, but above the previously broken trend line, a trading range should form, which will confirm the fact of a change in the local trend.
Best regards, R. Linda!
