Gold Price Update – Clean & Clear ExplanationGold is trading in a clear bullish structure price has been respecting an ascending channel, forming higher highs and higher lows, which confirms that buyers are firmly in control of the market.
After a strong impulsive move to the upside, price faced profit-taking near the recent highs, followed by a healthy pullback. This retracement is holding above the previous breakout zone and rising trendline, indicating that bullish momentum remains intact and the move looks corrective rather than a trend reversal.
The grey zones on the chart highlight key demand and supply areas. Price is currently reacting positively from a strong demand zone, which aligns with the trendline support—this confluence strengthens the probability of another upside continuation.
As long as price holds above the support area around 4,288–4,278, buyers are expected to step in. A sustained hold above this zone could push price toward the first target near 4,332, and if bullish momentum continues, the second target around 4,357 becomes achievable.
Overall, this structure suggests buy-on-dip opportunities while price remains above the key support. A break and close below the demand zone would weaken the bullish outlook, but until then, the trend favours further upside continuation.
If you find it helpful please like and comments for this post and share thanks.
Support and Resistance

ETH is targeting 3500$ or 2500$?Wait for breakout here on blue zone or if it hold gain is cooking.
As observed on the chart, Ethereum is testing a critical multi-confluence support zone (marked in blue). The significance of this level is derived from three key technical factors:
Fibonacci Support : It aligns with the 0.5 to 0.618 retracement zone on the 4-hour chart, a common area for trend reversals.
Channel Support : This zone coincides with the lower boundary of the prevailing price channel.
Psychological Support : It reinforces the major round-number support at $3,000.
Scenarios:
Bullish: A sustained hold and bullish reaction from this confluence support could catalyze an upward move toward $3,500 and higher.
Bearish : A decisive breakdown below this zone (as indicated by the bearish projection on your chart) would invalidate the support structure and target a decline toward the $2,450 area.
This zone represents a clear inflection point where the market's next medium-term direction is likely to be determined.
DISCLAIMER: ((trade based on your own decision))
<<press like👍 if you enjoy💚

GBPUSD: Bullish! Wait To Buy The Dip!Welcome back to the Weekly Forex Forecast for the week of Dec 15 - 19th.
The GBP is stronger against a weakened USD, after the Fed cut the interest rate. It made gains in the second half of last week, and I expect that trend to continue into this week.
Be patient. Wait for the pullback for liquidity before the move up.
Enjoy!
May profits be upon you.
Leave any questions or comments in the comment section.
I appreciate any feedback from my viewers!
Like and/or subscribe if you want more accurate analysis.
Thank you so much!
Disclaimer:
I do not provide personal investment advice and I am not a qualified licensed investment advisor.
All information found here, including any ideas, opinions, views, predictions, forecasts, commentaries, suggestions, expressed or implied herein, are for informational, entertainment or educational purposes only and should not be construed as personal investment advice. While the information provided is believed to be accurate, it may include errors or inaccuracies.
I will not and cannot be held liable for any actions you take as a result of anything you read here.
Conduct your own due diligence, or consult a licensed financial advisor or broker before making any and all investment decisions. Any investments, trades, speculations, or decisions made on the basis of any information found on this channel, expressed or implied herein, are committed at your own risk, financial or otherwise.

EURUSD Retest to support reversal to bullishEUR/USD has shown a strong bullish shift after spending several weeks trading inside a descending channel. Price respected the lower and upper boundaries of this channel for a long time, confirming a controlled bearish-to-neutral structure.
Recently, however, the market broke decisively above the channel, signalling a trend reversal from bearish to bullish after the breakout, price rallied strongly and is now consolidating above the former resistance zone, which has turned into key support around 1.1700–1.1720,
Technically this area is very important because holding above it confirms bullish strength and healthy continuation rather than a false breakout we could see next upper side target 1.18003 to 1.18500
You may find more details in the chart,
Trade wisely best of luck buddies.
Ps; Support with like and comments for better analysis thanks for supporting,.

EURCAD SHORTMarket structure bearish on HTFs DW
Entry at Weekly and Daily AOi
Weekly Rejection at AOi
Previous Weekly Structure Point
Daily Rejection at AOi
Previous Daily Structure Point
Daily EMA retest
Around Psychological Level 1.62000
H4 Candlestick rejection
TP: WHO KNOWS!
Entry 100%
REMEMBER : Trading is a Game Of Probability
: Manage Your Risk
: Be Patient
: Every Moment Is Unique
: Rinse, Wash, Repeat!
: Christ is King.

GBPUSD Outlook Bullish for now on GU. Price currently reacting from a support zone after breaking it and sweeping the low above it. There's high chance it'll take price higher this week. Demand zone coupled with IMB below it is also active and will be used if current zone fails.
Manage risk

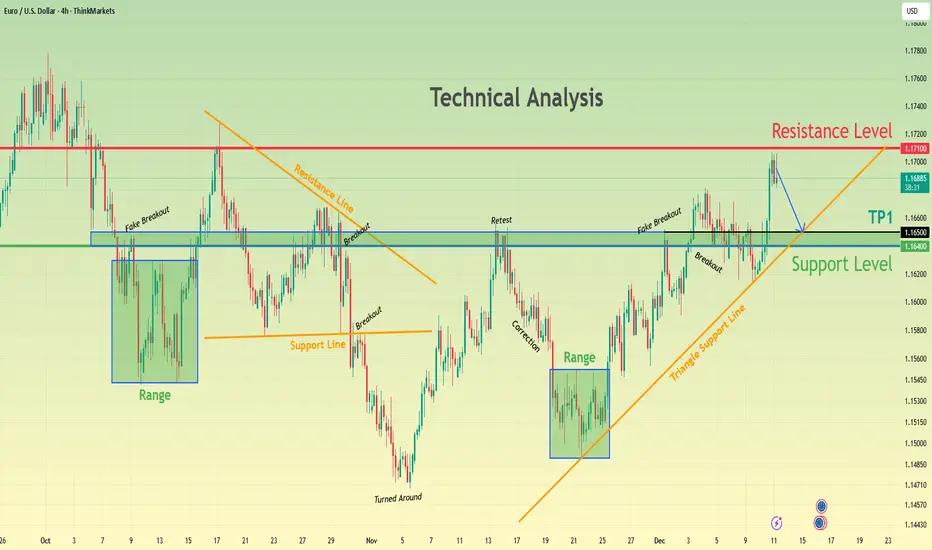
EURUSD Consolidates Below Resistance — Bears Aim for 1.1650Hello traders! Here’s my outlook on the current EURUSD setup. After a prolonged consolidation phase, the pair repeatedly respected the Support Level around 1.1640–1.1650, where buyers have consistently stepped in to defend the zone. This area has acted as a strong demand region, forming multiple ranges and triggering previous upward reversals. Each fake breakout below support confirmed that sellers failed to gain control, allowing price to rebound back into structure. Currently, EURUSD is trading within an ascending structure supported by the Triangle Support Line, which has guided price higher following the major turnaround. Along the way, several breakouts and retests validated bullish momentum as the pair pushed toward the key Resistance Level at 1.1710. This resistance remains the main barrier where price previously rejected and rotated lower. At this moment, EURUSD is approaching the Resistance Level again. If buyers maintain control and continue respecting the rising support line, the primary scenario is a pullback toward TP1 → 1.1650, where a major decision point awaits. This area has proven to be a reliable support level and aligns with previous retests, making it a critical zone for potential bullish continuation. A clean breakout above 1.1710 would open the door for a stronger upward move, signaling renewed bullish strength. However, if price breaks below the Triangle Support Line and falls under 1.1640, the bullish structure becomes invalid, and the market may return to deeper corrective levels. For now, the trend remains moderately bullish as long as price holds above support and stays within the rising structure. Please share this idea with your friends and click Boost 🚀
BTC 1H diagonal compression into Monday: brace for volatatilityI’m tracking a validated descending channel (2 magenta lines) from the Oct highs and two rising supports (2 green lines) from the Nov/Dec base. Price is now pinned near the convergence around 90.6k.
Why the “double lines” matter
The outer lines define the macro boundaries (where reactions repeatedly happened).
The inner lines act like a “decision lane” (where price keeps getting rejected/held).
Together this often produces compression to expansion (volatility tends to increase once the market chooses a side).
What I’m watching (behavior > prediction):
Bullish resolution: 1H close above the upper magenta + next candles hold above (no instant reclaim back under).
Then I treat magenta as support on retest. Upside targets become the next horizontal supply zones (92–94k).
Bearish resolution: 1H close below the lower green + retest fails (closes stay below).
Then I treat green as resistance; downside opens toward 89k first, then deeper supports (mid/low 80s).
Chop warning: wicks through lines with no follow-through = liquidity runs, not confirmation. I don’t trade the wick. I trade the close + hold.
Here's how the lines helped me succesfully time a short recently:
Planned two days earlier, during previous chop at this level, and patiently waited for a retest:
Rule for the weekend / Monday open
I’m not betting on the timestamp of line intersections. I’m bracing for range expansion and waiting for acceptance/rejection on 1H closes.
Not financial advice. This is a volatility warning + structure map, not a signal.

Silver is in the Bullish directionHello Traders
In This Chart XAGUSD HOURLY Forex Forecast By FOREX PLANET
today XAGUSD analysis 👆
🟢This Chart includes_ (XAGUSD market update)
🟢What is The Next Opportunity on XAGUSD Market
🟢how to Enter to the Valid Entry With Assurance Profit
This CHART is For Trader's that Want to Improve Their Technical Analysis Skills and Their Trading By Understanding How To Analyze The Market Using Multiple Timeframes and Understanding The Bigger Picture on the Charts

DXY bullishDXY resumed upwards monday and tuesday, but fell again wednesday and thursday, into another a deeper level of horizontal supoort, then consolidated friday and is now bullish again, dxy resuming back up again. Next strong move up is still to come...

BITCOIN → Downward trend pressure. 86K - 84K?BINANCE:BTCUSDT.P sold off all the gains associated with Tuesday and Wednesday's news. Technically, a false breakout of resistance is forming against the backdrop of a downtrend. There is no fundamental support.
Bitcoin failed to consolidate above 91800 - 94200, a false breakout was formed, and the price returned to the range. There is an imbalance zone on the chart, which the price may test before falling (weak technical and fundamental background).
The trend is downward in the medium term. A countertrend correction is forming, within which the market is facing pressure in the 94K - 95K zone. Zone of interest is 91850. I expect a retest, liquidity capture, and another phase of selling down to 88K - 86K.
Resistance levels: 91850, 92500
Support levels: 89550, 87980, 86260
The price is in the trading range of 84K - 94K. Resistance has been tested, and a double top reversal pattern has formed. Currently, a distribution phase is forming relative to the specified pattern and consolidation at 91850 - 94200. A retest of the nearest resistance could trigger a rebound and cause the price to fall further to the next zone of interest.
Best regards, R. Linda!

BCHUSDT Bulls Beware? Price Just Triggered a Classic TrapYello Paradisers! have you noticed how BCHUSDT just tapped into a key resistance right after sweeping liquidity above previous highs? This could be the perfect bull trap, and what comes next might catch many traders off guard if they’re not prepared.
💎BCHUSDT has just taken inducement and is now reacting from a strong resistance zone. Price is currently moving within an ascending channel while also showing clear bearish divergence, a combination that increases the probability of a bearish move. This setup suggests that momentum is weakening despite higher price action, often a red flag for trend continuation.
💎Aggressive traders may already be looking to enter short from current levels. However, the more strategic and safer approach is to wait for another reaction from the resistance zone, ideally accompanied by a clear bearish candlestick pattern. That will give us a much higher probability entry with a more defined invalidation level. If this confirmation comes, we can then look to target the liquidity pools and support zones lying below.
💎That said, if BCHUSDT manages to break and close above the resistance zone with strength, it would completely invalidate our bearish scenario. In that case, it’s best to stay on the sidelines and wait for fresh price action to develop before taking any new trades. Chasing trades without structure is where most traders lose.
🎖Strive for consistency, not quick profits. Treat the market as a businessman, not as a gambler. Stay patient, disciplined, and focused only on high-probability setups, this is the only way you’ll make it long-term in this market.
MyCryptoParadise
iFeel the success🌴

GOLD Will Keep Growing! Buy!
Hello,Traders!
GOLD strong bullish displacement confirms a successful mitigation of the horizontal demand area, following a clear sell-side liquidity grab. Market structure remains bullish, with smart money defending the zone and favoring continuation toward the next overhead liquidity pool and marked target. Time Frame 5H.
Buy!
Comment and subscribe to help us grow!
Check out other forecasts below too!
Disclosure: I am part of Trade Nation's Influencer program and receive a monthly fee for using their TradingView charts in my analysis.

USDCAD REBOUND AHEAD|LONG|
✅USDCAD has swept sell-side liquidity and is reacting from a clean demand zone. Strong rejection and displacement suggest institutional buying, with price trading in discount and targeting next internal liquidity above. Expect a corrective push higher from this base. Time Frame 8H.
LONG🚀
✅Like and subscribe to never miss a new idea!✅

XAUUSD POSSIBLE SELL!XAUUSD had a good chance of returning to order block and possibly selling off from that zone. Just in the later hours of New York session on Friday, we saw how price significantly dropped after reaching a high of 4351. From the H1 perspective I’m still looking forward to seeing price drop from 4333

BTCUSDT: Bearish Drop to 84000?BINANCE:BTCUSDT is eyeing a bearish reversal on the 4-hour chart , with price forming lower highs within an upward channel, approaching resistance near cumulative long liquidation zones that could trigger downside momentum if sellers defend the levels amid recent volatility. This setup suggests a pullback opportunity after the rally, targeting lower support levels with overall risk-reward exceeding 1:4.
Entry between 91400–92700 for a short position. Targets at 87900 (first), 84000 (second). Set a stop loss at a close above 93180 , yielding a risk-reward ratio of more than 1:3.5 in total. Monitor for confirmation via a bearish candle close below entry with rising volume, leveraging the pair's channel dynamics.🌟
Fundamentally , Bitcoin has plunged below $90,000 on December 12, 2025, amid AI-related jitters dragging down Nasdaq and crypto stocks, with prices consolidating around $89,978 after a sharp fall from its $126,000 peak earlier this year. Despite a 1.9% daily crypto market cap increase to $3.23 trillion, sentiment remains cautious with fears of a price crash, as the asset oscillates in the $88,000–$93,000 range on Fed outlook but shows hourly downside after failing $92,735 resistance. Long-term forecasts eye drops to $80,000 by end-2026, with prediction markets skeptical of hitting $100,000 in 2025, though bulls maintain the uptrend for now. Bitcoin correlates with the S&P 500, which slipped today alongside Nasdaq due to AI bubble fears from Broadcom's results, potentially adding downward pressure on BTC. 💡
📝 Trade Setup
🎯 Entry (Short):
91,400 – 92,700
(Entries inside this zone remain valid with proper risk & capital management.)
🎯 Targets:
• 87,900 (first)
• 84,000 (second)
❌ Stop Loss:
A daily close above 93,180
⚖️ Risk-to-Reward:
More than 1:4 overall
💡 Your view?
Will BTC reject the 92K zone and unwind toward 84,000, or does crypto surprise with a squeeze first? 👇

Bitcoin falling trendline soon will break and Bulls will lead Bitcoin is currently trading within an ascending channel, encountering resistance near both the channel's upper boundary and a significant historical descending trendline. While this confluence of resistance has prompted a short-term pullback, the overall structure suggests a potential breakout attempt in the near term.
A decisive move above the falling trendline would signal a shift in market structure, likely invalidating the bearish momentum and transitioning the market into either a consolidation range or a renewed bullish phase .
Following a confirmed breakout, the technical setup would support the potential for further upward movement, with progress expected to become more sustained once this key resistance zone is cleared.
So get Ready also other paths mentioned on the chart too what may happen in your view comment below !!
DISCLAIMER: ((trade based on your own decision))
<<press like👍 if you enjoy💚

NIFTY Price Action Roadmap | December 3rd Week + Monday PlanThis video is a complete price action breakdown of NIFTY for the coming week.
Last week’s structure and levels played out well
in this video, I’ve continued the same approach and mapped out:
Key market structure
Important trendlines & horizontal levels
Bullish and bearish scenarios
Where the market may react, trap, or expand
Probable setups to focus on, without clutter or indicators
Charts are kept clean and simple, so the focus stays on how price is behaving, not on tools.
This is not prediction-based content.
It’s a framework to read the market as it unfolds and stay aligned with structure.
Sharing this purely for learning and clarity, so traders can understand what the market is actually doing not get distracted by noise.

PLTR Technical AnalysisAfter a strong bullish trend, PLTR is now showing signs of momentum weakening, with sharp swings and unstable highs.
The long-term ascending trendline (black) remains the key structural support, and price reaction around this level will define the next move.
The 50-day SMA is still holding, but volatility near resistance suggests growing uncertainty.
Bullish Scenario
If price holds the ascending trendline and breaks above recent resistance:
Targets
• Target 1: 195
• Target 2: 205
• Target 3: 215–220
Stop Loss
• Daily close below 175
Rationale:
Holding the trendline and breaking higher would confirm trend continuation and renewed bullish momentum.
Bearish Scenario
If price breaks below the ascending trendline and confirms the breakdown:
Targets
• Target 1: 160
• Target 2: 150
• Target 3: 140–145
Stop Loss
• Reclaim and daily close above 185
Rationale:
A trendline breakdown after multiple failed highs often triggers a deeper corrective phase.
Very Short Summary
• Above trendline → Bullish continuation
• Below 175 → Deeper correction likely

NZDUSD: Bullish Momentum For 2 Weeks! Buy The Dip!Welcome back to the Weekly Forex Forecast for the week of Dec. 15 -19th.
In this video, we will analyze the following FX market: NZDUSD
NZDUSD is bearish on the HTFs, but it has started moving higher against a weakened USD.
The Daily shows the order flow is bullish, so there is no reason to sell this market in the short term.
Wait for the pullback, and by the dip.
Enjoy!
May profits be upon you.
Leave any questions or comments in the comment section.
I appreciate any feedback from my viewers!
Like and/or subscribe if you want more accurate analysis.
Thank you so much!
Disclaimer:
I do not provide personal investment advice and I am not a qualified licensed investment advisor.
All information found here, including any ideas, opinions, views, predictions, forecasts, commentaries, suggestions, expressed or implied herein, are for informational, entertainment or educational purposes only and should not be construed as personal investment advice. While the information provided is believed to be accurate, it may include errors or inaccuracies.
I will not and cannot be held liable for any actions you take as a result of anything you read here.
Conduct your own due diligence, or consult a licensed financial advisor or broker before making any and all investment decisions. Any investments, trades, speculations, or decisions made on the basis of any information found on this channel, expressed or implied herein, are committed at your own risk, financial or otherwise.

CRUDE OIL Free Signal! Buy!
Hello,Traders!
CRUDE OIL has delivered a clean sell-side liquidity sweep into a well-defined horizontal demand area, followed by a strong bullish reaction. This displacement suggests smart money mitigation and absorption, favoring a corrective push higher toward the next liquidity pool.Time Frame 5H.
--------------------
Stop Loss: 56.98$
Take Profit: 58.07$
Entry: 57.47$
Time Frame: 3H
--------------------
Buy!
Comment and subscribe to help us grow!
Check out other forecasts below too!
Disclosure: I am part of Trade Nation's Influencer program and receive a monthly fee for using their TradingView charts in my analysis.

NZDUSD WILL GROW|LONG|
✅NZDUSD is holding above the rising ICT trendline after a shallow pullback, showing bullish order-flow continuation. Displacement remains intact with premium liquidity resting above recent highs. Expect a controlled retrace into support before continuation toward upside imbalance. Time Frame 5H.
LONG🚀
✅Like and subscribe to never miss a new idea!✅

XAUUSD Aggressive bullish. Gold (XAUUSD) – 30M Chart Summary
Gold showed a strong bullish impulse earlier, creating a weak high, followed by an aggressive sell-off that broke market structure, signaling a shift from bullish to bearish momentum.
After the drop, price found demand at the support zone (~4270–4280) and started consolidating.
The current price is reacting inside a Fair Value Gap (FVG) around 4290–4300, acting as a decision area.
Below the FVG: sellers remain in control, and price may revisit the support zone and possibly sweep liquidity below it.
Above the FVG with acceptance: price could retrace toward the premium area / weak high near 4350, but this would be corrective unless structure is reclaimed.
Overall bias is bearish to neutral, with consolidation likely until a clear break above the FVG or below support confirms the next move.
