NZDCAD WILL GO UP|LONG|
✅NZDCAD after tapping into a key demand zone, price shows early displacement to the upside. Liquidity below previous lows has been collected, hinting at bullish intent toward the next target area. Time Frame 4H.
LONG🚀
✅Like and subscribe to never miss a new idea!✅
Support and Resistance

USD-JPY Free Signal! Sell!
Hello,Traders!
USDJPY a double-top structure has formed near a key supply zone, indicating potential exhaustion of bullish momentum. Smart money may look to reverse liquidity buildup at this level toward lower targets.
-------------------
Stop Loss: 154.459
Take Profit: 153.560
Entry Level: 154.102
Time Frame: 2H
-------------------
Sell!
Comment and subscribe to help us grow!
Check out other forecasts below too!
Disclosure: I am part of Trade Nation's Influencer program and receive a monthly fee for using their TradingView charts in my analysis.

Expecting decrease in supply by end of yearBased on the current OPEC's report (October 2025) there is an increase in supply.
The supply will be reduced by the end of year.
In relation to the MFE and MAE we are getting closer to MAE.
We're heading to a discount price (ICT)
Add long position below 44USD

EURUSD: Support & Resistance Analysis For Next Week 🇪🇺🇺🇸
Here is my latest structure analysis and
important supports & resistances for EURUSD for next week.
Consider these structures for pullback/breakout trading.
❤️Please, support my work with like, thank you!❤️
I am part of Trade Nation's Influencer program and receive a monthly fee for using their TradingView charts in my analysis.

GOLD (XAUUSD): Support & Resistance Analysis for Next Week
Here is my structure analysis for Gold for next week.
Support 1: 3868 - 3927 area
Support 2: 3766 - 3830 area
Support 3: 3690 - 3736 area
Resistance 1: 4023 - 4109 area
Resistance 2: 4187 - 4245 area
Resistance 3: 4357 - 4383 area
Consider these structures for pullback/breakout trading.
❤️Please, support my work with like, thank you!❤️
I am part of Trade Nation's Influencer program and receive a monthly fee for using their TradingView charts in my analysis.

IOT: substantial bullish macro potentialMacro structure shows substantial bullish potential. Price has successfully retested the 2021 ATH area, reacted with a constructive-looking recovery, and is potentially forming a higher low on the weekly timeframe.
A successful breakout and follow-through above the May ’24 highs would increase the probability of a new mid- to long-term uptrend developing, with the next key resistance levels at 70 and 100.
Failure to confirm a breakout above 42—or alternatively, a breakdown below the 50-day MA—would shift the odds toward a deeper correction into the 30-25 macro support zone.
Chart (Daily):
Chart (Weekly):

ETHEREUM: $4,250 Target in Sight Amid Wide Consolidation 📈ETHEREUM is currently undergoing a consolidation phase.
The price is stuck within a wide horizontal channel on the 4-hour timeframe.
We see a strong positive bullish reaction at its support level, leading to a bounce and the formation of a minor resistance.
The violation of this minor resistance indicates a change of character, suggesting a high probability of local buyer dominance.
Our target is at 4250 range resistance.

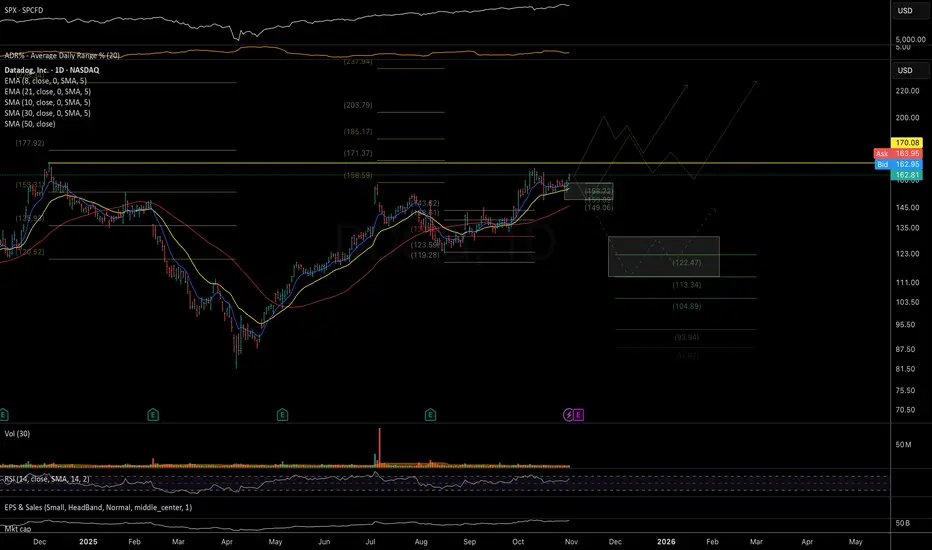
DDOG: interesting macro potential Interesting large multi-year VCP formation. Earnings are on Nov 6. While there’s still a chance that the correction from the June highs isn’t fully complete and that price is currently in a higher-degree bounce (running flat correction), I’ll be on the lookout for a potential (gap-up) earnings breakout.
If such a move occurs—especially if supported by a strong and positive catalyst—I’ll be watching for a delayed-reaction setup for a possible entry.
Chart:
Macro view:
Bullish potential detected for BOE (gap continuation)Entry conditions:
(i) higher share price for ASX:BOE along with swing up of indicators such as DMI/RSI (gap continuation play).
Depending on risk tolerance, the stop loss for the trade would be:
(i) below the previous potential support of $1.81 from the open of 29th October, or
(ii) below the low of the recent swing low of $1.775 of 29th October.

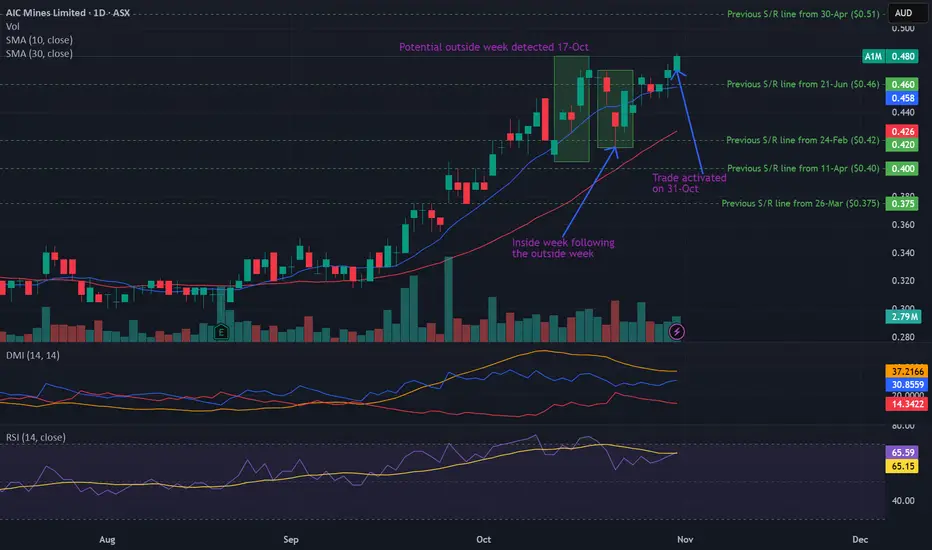
Potential outside week and bullish potential for A1MEntry conditions:
(i) higher share price for ASX:A1M above the level of the inside week following the potential outside week noted on 17th October (i.e.: above the level of $0.47).
Stop loss for the trade would be:
(i) below the low of the inside week on 22nd October (i.e.: below $0.415), should the trade activate.
BTCUSDBTC is at all time which the trend is still bullish although we can hit $150k but we won't ignore the fact that we have this trendline,rising wedge,moving average and psychological levels is indicating some bearish moves

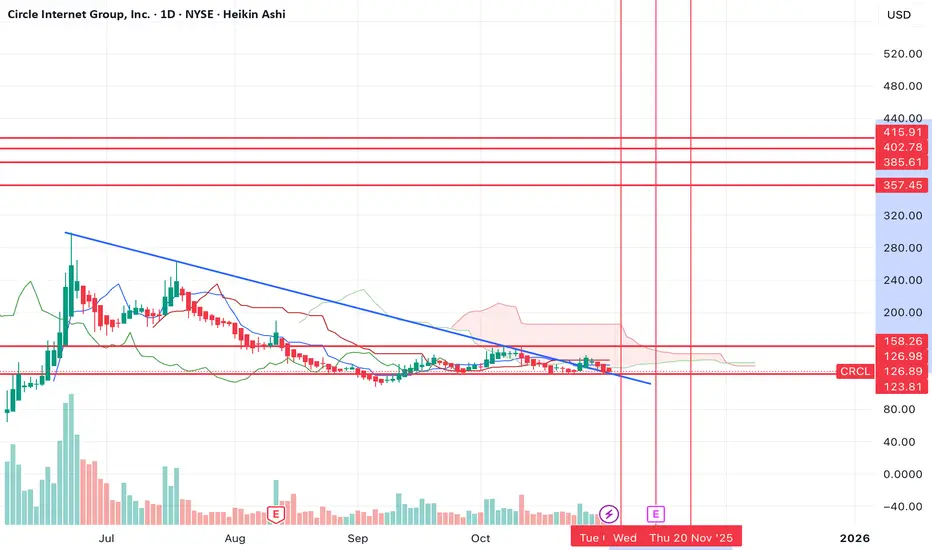
$CRCL set for a 150%+ move?Circle has broken out of a long term downtrend downtrend and has just retested the support. I think we're looking at a large move to the upside from here.
Would also coincide with similarities I'm seeing in altcoin charts.
I think the bullish move can take us to one of the upper resistances over the coming weeks.
Let's see how it plays out.
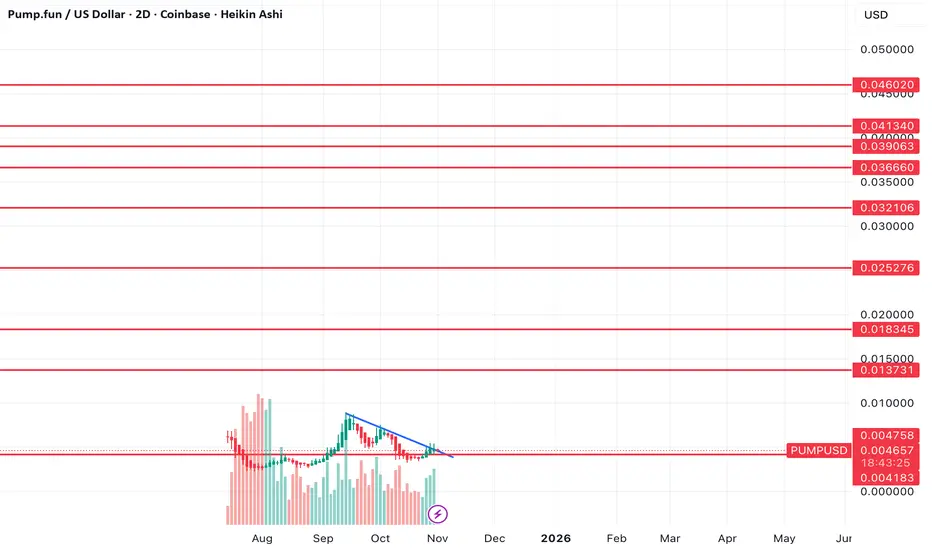
Is pump about to pump to new highs?Since September, Pump has corrected, however now it looks like we've broken and retested the downtrend and it looks set to move higher from here.
I've marked off key resistance levels on the way up.
Think we could see a pretty large move if this really gets going.
$OPUSD looks good for a long hereSince 2024, OP has been falling inside of a wedge, and it recently broke out and has now backtested it. We've also formed a capitulation low on Oct 6th, and now we look set to make a move higher.
I think we could see between a 2x-10x move from here potentially all the way up to the top of the range.
Let's see how it plays out over the comings weeks.

$GIGAUSD 200%-500% bounce incoming?Alts are starting to look really interesting down here.
If we look at the chart of Giga, it looks like we've had capitulation and have broken prior lows, however it also looks like a strong bottom/base is forming here and we could be setting up for a larger move higher.
We've been consolidating in a falling wedge and the next move at the top of the wedge should break it to the upside.
I've marked off key resistance levels that I think we can see a move to, however, I think it's possible we can head to the top resistance.
I'm long.

$SOUN Jade Lizard Trade 1/16/2026 ExpirationNASDAQ:SOUN
CALL CREDIT SPREAD, above price:
Buy SOUN $19 Call 1/16/2026
Sell SOUN $18 Call 1/16/2026
SHORT PUT, below price:
Sell SOUN $14 Put 1/16/2026
Credit to open: Approx $200 (TBD)
END RESULT SCENARIO #1: Share price between $18 and $14 @ expiration = Credit to open is max profit (best case scenario).
END RESULT SCENARIO #2: Share price above $19 @ expiration = Credit to open minus $100 (no risk to upside).
3) END RESULT SCENARIO #3: Share price at or below $14 = Assigned to purchase 100 shares. The result is now you own 100 shares at an avg cost of ~$12 per share.

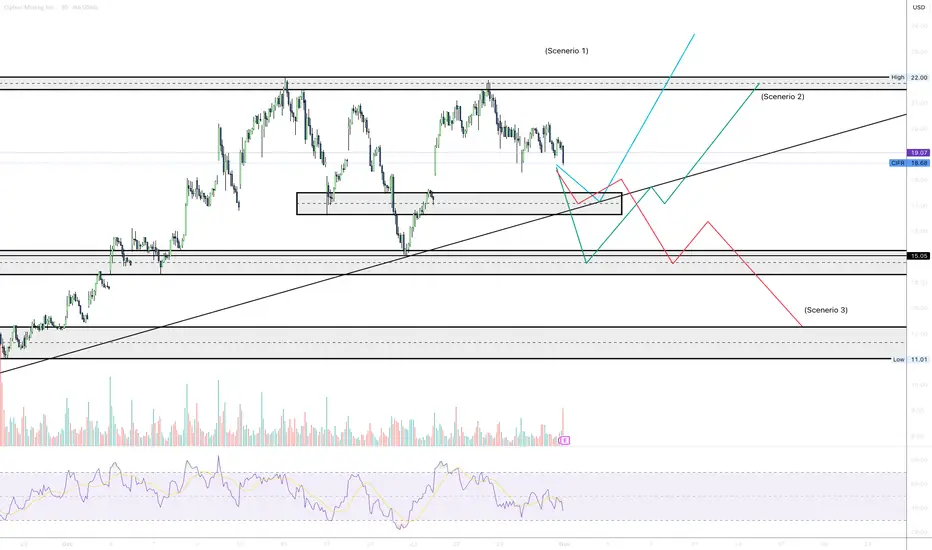
CIFR CHART ANALYSIS - WEEK OF NOVEMBER 3rd 2025 - 4HR TIMEFRAME4HR CHART ANALYSIS. Price continues to be bullish if price stays along the trend-line and stay above strong support (please refer to the chart).
CADJPY BULLISH BIAS|LONG|
✅CADJPY has retested a clean demand level after a corrective pullback, showing early signs of bullish continuation. Liquidity beneath the recent low is swept, hinting a push toward the target zone. Time Frame 4H.
LONG🚀
✅Like and subscribe to never miss a new idea!✅

USD-CHF Supply Level Above! Sell!
Hello,Traders!
USDCHF Price is approaching a horizontal supply area but hasn’t confirmed a retest yet. Smart money may seek liquidity sweep above before reacting lower toward the target zone. Time Frame 4H.
Sell!
Comment and subscribe to help us grow!
Check out other forecasts below too!
Disclosure: I am part of Trade Nation's Influencer program and receive a monthly fee for using their TradingView charts in my analysis.

KERNEX buy setupKERNEX buy setup : I take position in weekly candle basis. hold for 2-3-5 months until the trend is reversing. Please Note: This template is for informational purposes only and is not a substitute for professional legal advice.

rappid valves buy setuprappid valves buy setup: I take position in weekly candle basis. hold for 2-3-5 months until the trend is reversing. Please Note: This template is for informational purposes only and is not a substitute for professional legal advice.

nbcc weekly position takenI take position in weekly candle basis. hold for 2-3-5 months until the trend is reversing. Please Note: This template is for informational purposes only and is not a substitute for professional legal advice. #nbcc

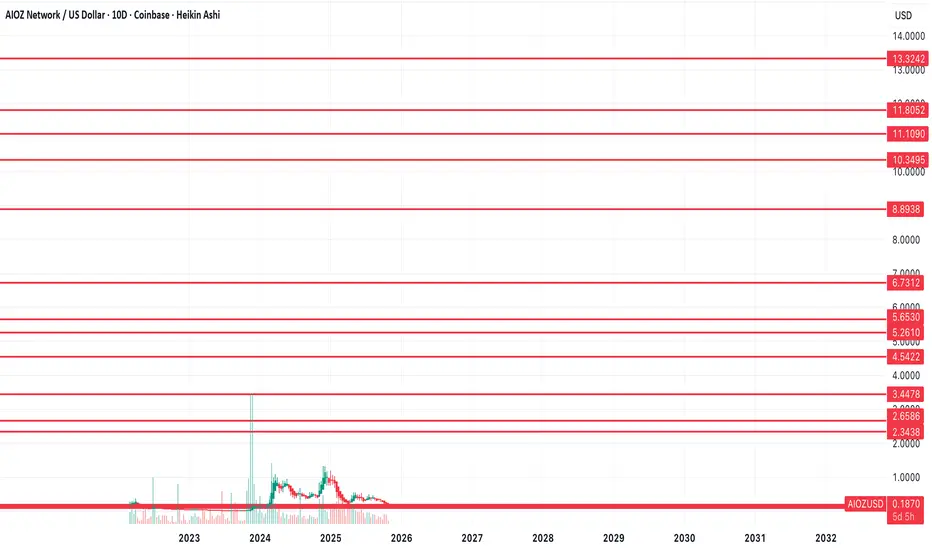
$AIOZ getting into long term buy levels$AIOZ is coming into my long term buy area here. I bought some at $.179, and it maybe can see one more move down to $.15 and have some lower supports on the chart incase of an extreme capitulation, but I'm accumulating from here on out as I think this could be a coin that sees over $10.
Let's see how it plays out.