BULLISHNESS LOOKS WEAKBears gaining momentum, it looks like bullishness is coming to an end but not confirmed yet, until price closes below 3993 by 12pm or for best confirmation by 4pm.
it's time to manage the trade because it could be a a range and a bullish continuation since it's still above 3999 or an impending bearishness so it's best to manage trade
Support and Resistance

Gold short idea result. Like I published at midnight I expected gold to reject the EMA and and the AOI that has been used as resistance 3 previous times. I closed my trade at a 1:2. The price is still bullish in the 4H. Price has rejected to close under the HL meaning buyers are still in control. Holding until NY session on a Friday is a bit risky since like I’ve said buyers are still in control and price can push up again to the AOI and possibly close above it before the weekend. If you entered short from the idea I posted midnight, I would highly suggest to close positions before NY session.

BULLISHNESS BECOMING WEAKBears gaining momentum, it looks like bullishness is coming to an end but not confirmed yet, until price closes below 3993 by 12pm or for best confirmation by 4pm.

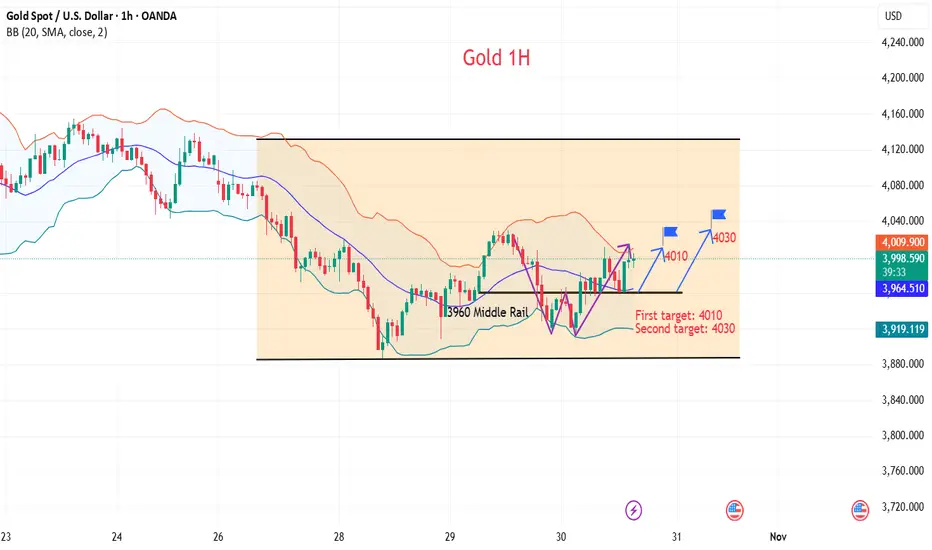
Gold has not fallen below the $4,000 mark, so what's next?
News:
The Federal Reserve cut interest rates by 25 basis points as expected on Wednesday. However, to the market's surprise, Powell released an extremely hawkish signal, stating that a December rate cut is "far from a certainty," which directly caused a market crash. US stocks fell from their highs, the dollar rose, and gold and silver markets plummeted. The Fed also postponed the pause in its balance sheet reduction program until December.
This has temporarily tightened market expectations for a December rate cut, meaning that the expectation of a rate cut has temporarily failed to materialize. However, there is still more than a month until mid-December, and with fluctuations in data, expectations are likely to rise again.
Specifically:
Gold hourly chart: Today's price action was relatively volatile, with poor continuity and high deceptiveness. For example, the large bearish candle at 11:00 AM led many to believe a breakdown and weakness, following the overnight decline. However, a small W-shaped rally broke through the morning's opening price level.
Trading strategy:
Buy:3965-3960, SL: 3950, TP: 3980-4010-4030
What’s Driving the USD/JPY Rally?This week is packed with critical economic events and data impacting the USD/JPY pair, pushing it up by around 0.87% to reach its highest level since February 2025.
Key drivers behind the rise:
Federal Reserve Meeting (Oct 29): The Fed cut interest rates by 25 basis points, but Chair Jerome Powell surprised markets during the press conference, stating that a December rate cut is far from certain. This statement strengthened the US dollar, driving it up by about 0.75% and extending its uptrend on the 4-hour chart.
Bank of Japan Meeting (Oct 30): The BoJ kept interest rates unchanged at 0.50%, with expectations that a hike this year is unlikely. Discussion of a potential increase in January 2026 was also considered improbable. As a result, the Japanese yen weakened across major currencies.
As a result, the USD/JPY pair saw a strong rally fueled by US dollar strength and yen weakness.
Technically, USD/JPY remains in an uptrend, with potential for a bounce from 150.458 to continue higher. To maintain its positive outlook, the pair must hold above 149.377 on the daily timeframe.

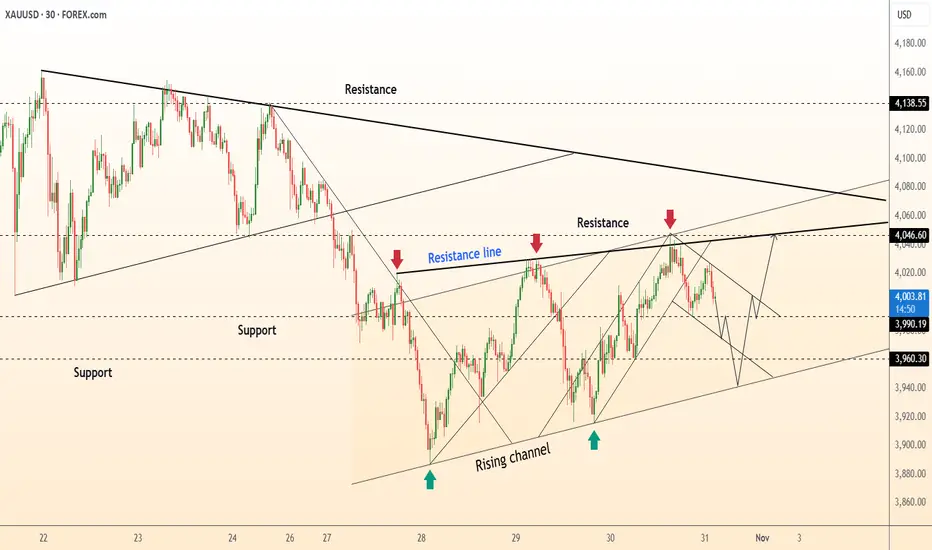
DeGRAM | GOLD is forming a new local ascending structure📊 Technical Analysis
● XAU/USD is forming a rising channel, holding firm above 3,960 support after rejecting from the resistance near 4,046.
● The pattern suggests a continuation of the uptrend as long as price sustains above the channel base, with potential breakout targets toward 4,138.
💡 Fundamental Analysis
● Gold remains supported by a softer dollar and cautious market sentiment ahead of key U.S. employment data, which could further boost safe-haven demand.
✨ Summary
● Long bias above 3,960; targets 4,046–4,138. Rising structure and weaker dollar fundamentals reinforce short-term bullish momentum.
-------------------
Share your opinion in the comments and support the idea with a like. Thanks for your support!
BITCOIN RALLY STARTEDI believe now after bitcoin re-tested the trendline which is a great support, the rally for November & December is on the way

EUR/USD: Bearish Pullback to 1.155?FX:EURUSD is flashing bearish signals on the 4-hour chart , where price is respecting a downward trendline with successive lower highs, indicating ongoing weakness and potential for further downside as sellers maintain control near the resistance zone. This setup points to a classic continuation pattern if the trendline holds as resistance.
Entry zone between 1.168-1.170 for a short position. Target at 1.155 near the support zone, offering a risk-reward ratio greater than 1:2.5 . Set a stop loss on a close above 1.1745 to protect against an upside break. Look for confirmation on a breakdown below the entry with rising volume, amid persistent USD strength over the EUR.
Fundamentally , this week features key GDP releases from the Eurozone (Q3 flash on October 29) and the US (Q3 advanced on October 30). Additionally, the upcoming meeting between Trump and Xi could lead to a US-China trade agreement or lack thereof, significantly impacting markets. 💡
📝 Trade Plan:
🎯 Entry Zone: 1.168 – 1.170 (short setup near resistance)
❌ Stop Loss: Close above 1.1745
✅ Target: 1.155 (support zone)
💎 Risk-to-Reward: Greater than 1:2.5, offering a high-quality short opportunity within the prevailing bearish trend.
What's your outlook on this setup? Drop your thoughts

XAU/USD: Bearish Decline to 3827?OANDA:XAUUSD is exhibiting bearish momentum on the 1-hour chart , with price respecting a downward trendline and pulling back toward the EMA 50 (1H) as dynamic resistance, creating a prime short opportunity near the highlighted entry zone amid ongoing consolidation. This setup suggests continuation of the downtrend if sellers push through toward lower supports. 🎯
Entry zone between 3979-4020 for a sell position. Target at 3827 near the support and take profit zone, yielding a risk-reward ratio greater than 1:2.5 . Set a stop loss on a close above 4035 to manage risk. 🌟 Await confirmation with a bearish close below the entry and rising volume, tapping into gold's sensitivity to USD strength.
Fundamentally , this week features the FOMC meeting on October 29, where the Fed's rate decision could bolster the dollar if hawkish tones prevail. Additionally, outcomes from the ongoing Trump-Xi trade talks—kicking off this week in Asia—could spark major market volatility, potentially pressuring gold if a US-China deal materializes. 💡
📝 Trade Plan:
🎯 Entry Zone: 3979 – 4020 (short setup near resistance)
❌ Stop Loss: Close above 4035
✅ Target: 3827 (support / take-profit zone)
💎 Risk-to-Reward: Greater than 1:2.5, offering an excellent downside opportunity for disciplined traders.
What's your view on this gold drop? Comment below! 👇

A 1200% gain to $400 in 2024 for ETC?Since May 2021 Ethereum classic has corrected 90% as shown on the above weekly chart. Unlike many legacy tokens ETC is one of the few building structure. The reasons to now consider a long position include:
1) Trend reversal, higher highs higher lows replace lower highs lower lows.
2) Support and resistance. Price action has left the long term downtrend channel resistance as indicated by the green arrows. Look left and see past horizontal resistance is now confirming support.
3) Hidden bullish divergence. This particular indication informs a strong move is about to occur. It happens when price action prints a higher low with a lower low on the stochastic RSI oscillator.
4) The price target. The downtrend channel is in actual fact a bull flag. The first impulsive move of 2021 becomes the flagpole. This flagpole is used to measure the target from the exit point of the channel to the area of $400
Is it possible price action continues to correct? Sure.
Is it probable? No.
Ww
Type: trade
Risk: <= 6%
Time frame for long: You decide
Return: 1200%

BankNifty levels - Nov 03, 2025Utilizing the support and resistance levels of BankNifty, along with the 5-minute timeframe candlesticks and VWAP, can enhance the precision of trade entries and exits on or near these levels. It is crucial to recognize that these levels are not static, and they undergo alterations as market dynamics evolve.
The dashed lines on the chart indicate the reaction levels, serving as additional points of significance. Furthermore, take note of the response at the levels of the High, Low, and Close values from the day prior.
We trust that this information proves valuable to you.
* If you found the idea appealing, kindly tap the Boost icon located below the chart. We encourage you to share your thoughts and comments regarding it.
Wishing you successful trading endeavors!

Nifty levels - Nov 03, 2025Nifty support and resistance levels are valuable tools for making informed trading decisions, specifically when combined with the analysis of 5-minute timeframe candlesticks and VWAP. By closely monitoring these levels and observing the price movements within this timeframe, traders can enhance the accuracy of their entry and exit points. It is important to bear in mind that support and resistance levels are not fixed, and they can change over time as market conditions evolve.
The dashed lines on the chart indicate the reaction levels, serving as additional points of significance to consider. Furthermore, take note of the response at the levels of the High, Low, and Close values from the day prior.
We hope you find this information beneficial in your trading endeavors.
* If you found the idea appealing, kindly tap the Boost icon located below the chart. We encourage you to share your thoughts and comments regarding it.
Wishing you success in your trading activities!

DeGRAM | USDJPY is preparing to break resistance levels📊 Technical Analysis
● USD/JPY is consolidating above the 152.00 support, maintaining a steady climb within a rising channel. A confirmed breakout above the 154.40 resistance line could push the pair toward 156.70, aligning with the upper boundary of the broader structure.
● The price structure supports continued bullish momentum as long as the support line remains intact.
💡 Fundamental Analysis
● The yen remains pressured by dovish BoJ policy, while stronger U.S. yields and robust GDP growth keep the dollar in demand.
✨ Summary
● Long bias above 152.00; target 156.70. Rising channel structure supports further bullish continuation.
-------------------
Share your opinion in the comments and support the idea with a like. Thanks for your support!

Buy Dax at supportRisking 100 points in DAX for a 250 points swing up over the weekend.Buying at support in what looks like a range bound market.
DeGRAM | GOLD formed a rising bottom📊 Technical Analysis
● XAU/USD is trading inside a descending channel, forming a short-term rebound from the support line near 3,945, signaling a potential breakout attempt.
● A move above the 4,025–4,040 resistance zone would confirm a channel break and open the path toward the 4,138 level.
💡 Fundamental Analysis
● Gold finds demand amid geopolitical uncertainty and weaker U.S. Treasury yields, while markets await key inflation data that may limit dollar strength.
✨ Summary
● Long bias above 3,945; target 4,040–4,138. Channel bottom rebound supports a short-term bullish recovery scenario.
-------------------
Share your opinion in the comments and support the idea with a like. Thanks for your support!

DeGRAM | XRPUSD seeks to the $2.4 level📊 Technical Analysis
● XRP/USD continues to trade under a major descending resistance trendline, facing repeated rejection near 2.70. Price consolidation beneath this zone signals waning bullish momentum.
● The pattern shows lower highs and potential for a corrective decline toward 2.38 support, aligning with prior reaction lows and structural confluence.
💡 Fundamental Analysis
● Investor caution remains as Ripple awaits further regulatory clarity post-SEC settlement, while broader crypto risk sentiment weakens amid dollar strength.
✨ Summary
● Short bias below 2.70; target 2.38. Failing momentum and macro headwinds reinforce bearish continuation.
-------------------
Share your opinion in the comments and support the idea with a like. Thanks for your support!

TSLL accumulation before impulse, growth targets at 31 and 50TSLL continues to move within an ascending channel, forming a price accumulation zone between 17 and 21. After a confirmed breakout above 21, the price is expected to rise towards Target 1: 31.03 and
Target 2 : 49.78.
The 50 and 100 EMA are sloping upward, confirming a strong bullish structure. A short-term correction toward 17.17 remains possible this area acts as key buyer interest and previous support.
TSLL performance is tied to Tesla’s stock. Recent quarterly results from Tesla show margin recovery and revenue growth driven by new model sales. Lower interest rate expectations and renewed appetite for U.S. equities support inflows into leveraged ETFs like TSLL.
TSLL remains in a bullish structure. As long as the price stays above 17, buying remains preferable. Medium-term targets 31 and 50. Pullbacks toward 17 can be used to add to long positions.

CHF/JPY: Confirmed Intraday Bullish SignalI spotted an additional instance aligning with my breakout trading strategy.
The 📈CHFJPY pair showed a decisive violation and close above a significant intraday horizontal resistance level.
Following this, the price retested the broken structure and subsequently breached the resistance line of a falling parallel channel on an hourly timeframe.
This indicates a strong buying interest.
We can now anticipate an upward movement, with a minimum target of 192.66.

GOLD Analysis Outlook The market has bounced strongly from the recent demand zone, showing renewed bullish momentum.
Price is currently trading above the 20 EMA (green) and testing the 200 EMA (red), adding confluence to a potential bullish continuation.
A sustained move above 4,025 could extend gains toward 4,200, 4,360, and 4,480.
However, a break below 3,910 would invalidate the bullish structure and shift bias to neutral.

Ethereum confirmation of breakout, downside targetEthereum confirmed a breakout below the 4050–4100 zone, completing the double top pattern. The price stays under the 50 and 100 EMA, showing continued bearish pressure. Priority remains on short positions during pullbacks.
Nearest downside targets: 3463 (Target 1) and 3007 (Target 2). A move above 4100 would cancel the bearish scenario.
Amid expectations of the Fed’s rate decision and rising bond yields, risk assets remain under pressure. Inflows to crypto funds are declining, increasing the downside risks for ETH. In the short term, correction may continue until new bullish catalysts appear.
ETHUSD remains in a bearish setup. Downside targets — 3460 and 3000. Long positions should be considered only after a confirmed move above 4100.

BTC/USDT | 1H Long PositionFrameworks: ICT • SMC • Bill Williams
BTC delivered a classic sell-side liquidity sweep, taking out lows at SMT divergence, followed by bullish displacement. Smart money accumulation confirmed with price returning into the mitigation block + FVG before expansion.
The Alligator indicator is transitioning from sleeping to waking — green lips crossing above red and blue lines, showing early trend shift and potential trend continuation phase.
ICT/SMC Breakdown:
✅ Liquidity sweep into demand
✅ Displacement after the sweep
✅ Reclaim + Retest of FVG / OB (entry model)
✅ Early Alligator expansion (Bill Williams) signaling trend ignition
🎯 Targeting premium liquidity levels above 111K / 113K / 116K
Trade Parameters:
🟩 Entry: 109,173
🔴 SL: 106,268
🎯 TP1: 111,400
🎯 TP2: 112,800
🎯 TP3: 116,300
📈 RR ≈ 4:1+
Narrative:
Price swept sell-side liquidity, created SMT divergence, shifted structure, and tapped into demand. As long as price holds above the reclaim zone, bullish continuation remains valid toward upside liquidity pools.
Accumulation → Expansion phase potentially underway.

US30 Eyes 47,200 for Potential BounceHey Traders, in today’s trading session we’re monitoring US30 for a potential buying opportunity around the 47,200 zone.
The Dow Jones continues to trade in a broader uptrend, and price action is currently in a correction phase, approaching the 47,200 support and resistance confluence area — a key zone where buyers may look to step back in.
Watching for a bullish reaction at this level to confirm continuation of the prevailing trend.
Share your view below — do you think US30 holds this zone or breaks lower?
Trade safe,
Joe.

Gold is Trading Under The Pressure of a Strong Dollar!!Hey Traders, in today's trading session we are monitoring XAUUSD for a selling opportunity around 4,020 zone, Gold is trading in a downtrend and currently is in a correction phase in which it is approaching the trend at 4,020 support and resistance area.
Trade safe, Joe.
