FireHoseReel | HYPE on 0.618 Fibonacci Decision Zone🔥 Welcome To FireHoseReel !
Let’s jump into HyperLiquid (HYPE) market analysis.
👀 HYPE 1H Overview
HYPE is currently trading near a key support zone and is forming a lower low compared to the previous bottom. This area also aligns with the 0.618 Fibonacci retracement, making it a critical reaction zone.
📊 Volume Analysis
HYPE volume has dropped significantly. The first strong increase in volume is likely to define the next major move. Volume is the most reliable confirmation here.
✍️ HYPE Trading Scenarios
🟢 Long Scenario:
A breakout above $35.945, either through a short squeeze or strong buy volume, can activate a bullish move to the upside.
🔴 Short Scenario:
A breakdown below the current support near $33.179 with rising sell volume can trigger a solid short setup.
🧠 Protect your capital first. No setup is worth blowing your account. If risk isn’t controlled, profit means nothing. Trade with rules, not emotions.
Support and Resistance

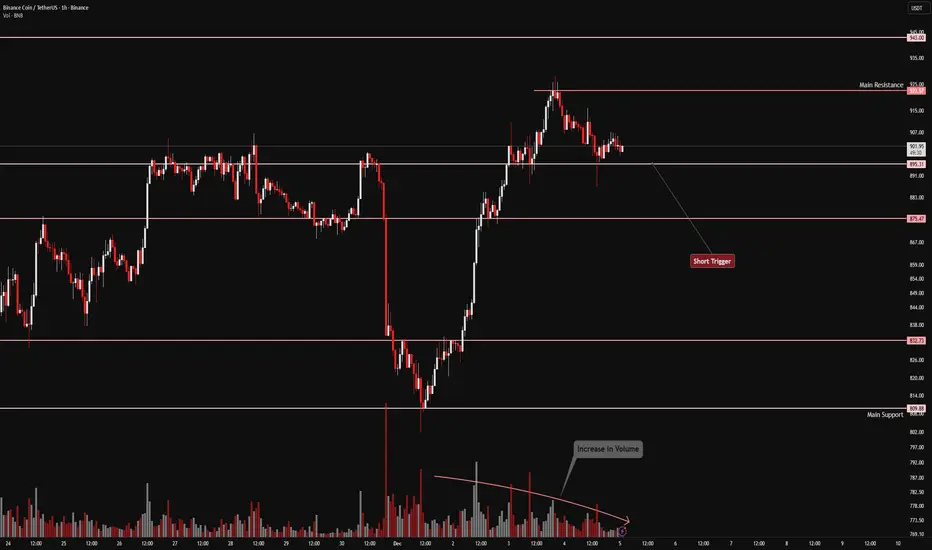
FireHoseReel | BNB Daily Analysis #16🔥 Welcome To FireHoseReel !
Let’s dive into BinanceCoin (BNB) analysis.
👀 BNB 1H Overview
BNB is currently hovering near a key support zone. A breakdown below this level could trigger a deeper correction toward lower prices.
📊 Volume Analysis
Trading volume has dropped sharply at this corrective level. A new surge in either buy or sell volume could ignite a strong momentum move.
✍️ BNB Trading Scenarios
🟢 Long Scenario:
A breakout above $922.57 with rising buy volume could offer a solid long opportunity.
🔴 Short Scenario:
A breakdown below the current support at $895, accompanied by strong selling pressure, could trigger a valid short setup.
🧠 Protect your capital first. No setup is worth blowing your account. If risk isn’t controlled, profit means nothing. Trade with rules, not emotions.
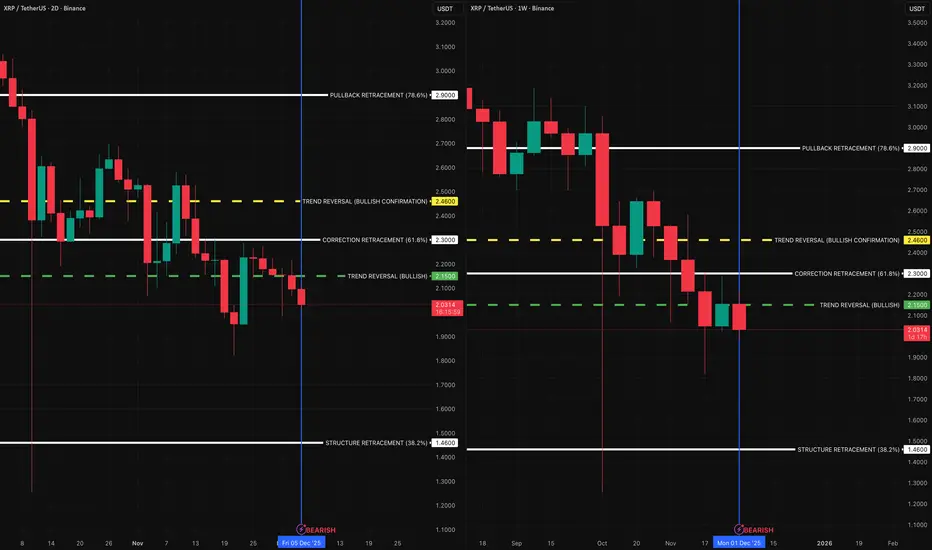
XRP — Structural Breakdown Classification (2D + Weekly)XRP has now entered a bearish classification across both the 2-Day and Weekly charts. The structure that supported the prior trend has been fully compromised.
The initial bearish structure shift began on the 2-Day chart at $2.05, which was the Origin level where momentum first transitioned. The Weekly chart confirmed its own structural reversal at $2.15, where XRP lost its higher-timeframe trend support.
Price also broke through the closest structural retracement at $2.30, which served as the final holding point of the prior trend. With that level gone, XRP is now operating inside a confirmed structural downturn.
The next structural reference levels beneath current price sit at:
• $1.64 — the nearest intermediate retracement zone
• $1.46 — the next major structural support layer
These levels are simply the next logical points in the framework where structure has historically responded. They are not predictions, but rather reactive reference zones based on how the trend has already unfolded.
This classification reflects the beginning of a bearish trend cycle, identified strictly through structural deterioration — not forecasting. As long as XRP remains beneath the reversal levels of $2.05 (2D) and $2.15 (Weekly), the underlying classification remains bearish.
Bullish potential detected for TLCEntry conditions:
(i) higher share price for ASX:TLC along with swing up of indicators such as DMI/RSI.
Depending on risk tolerance, the stop loss for the trade would be:
(i) below the recent swing low of $2.56 of 21st November and yearly VWAP (currently $2.55).

Aptos Bullish Divergence: Targeting $4.3–$15 Range Aptos has stabilized above the last weekly support; currently, there is a bullish divergence on the weekly chart, so all signals point to a likely upward push. The current range to play is $4.3–$15, and the risk-reward in this case is really good. Thanks to everyone for your attention.

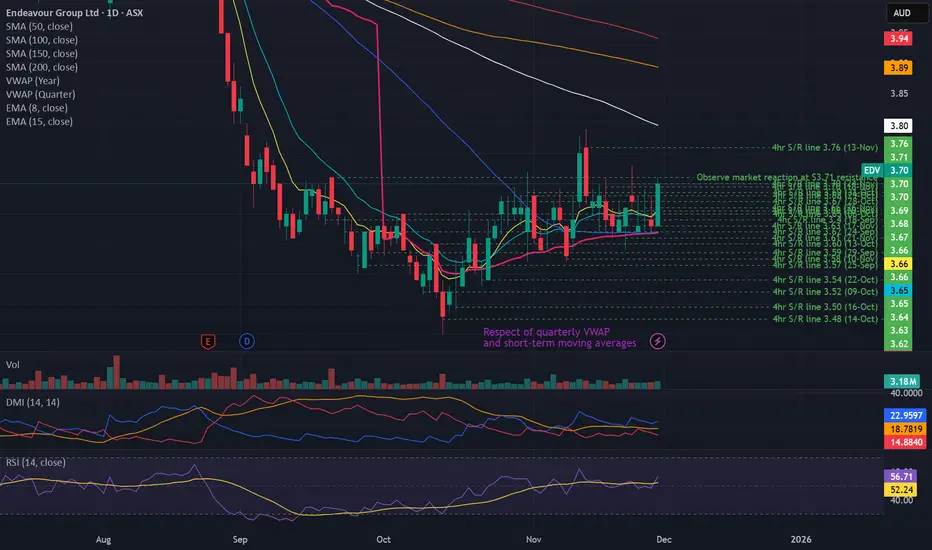
Bullish potential detected for EDVEntry conditions:
(i) higher share price for ASX:EDV along with swing up of indicators such as DMI/RSI, and
(ii) observing market reaction around the $3.71 resistance area.
Depending on risk tolerance, the stop loss for the trade would be:
(i) below the recent swing low of $3.57 of 10th November, or
(ii) below the recent swing low of $3.45 of 14th October.
LTC/USDC - Potential Bounce from Lows, Retesting Broken SupportLTC has experienced a significant drop, breaking below a key support level. However, price is now showing signs of stabilization at these lower levels, and the white arrow indicates a potential bounce back to retest the broken support.

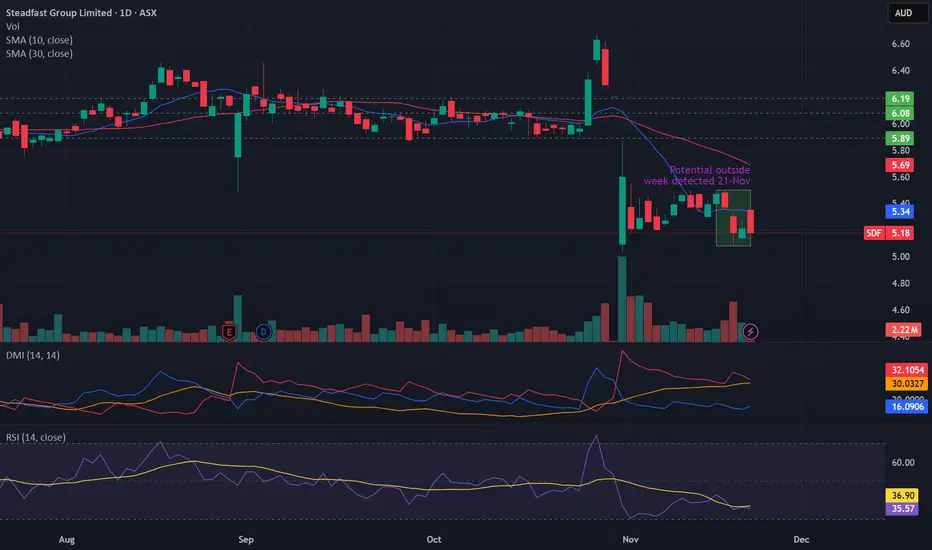
Potential outside week and bearish potential for SDFEntry conditions:
(i) lower share price for ASX:SDF below the level of the potential outside week noted on 19th November (i.e.: below the level of $5.08).
Stop loss for the trade would be:
(i) above the high of the outside week on 17th November (i.e.: above $5.50), should the trade activate.
BullsHaving closed above the weekly resistance we await complition of the pullback before we have another go at the buys. This will be targetting the 71% retracement region on the daily chart.

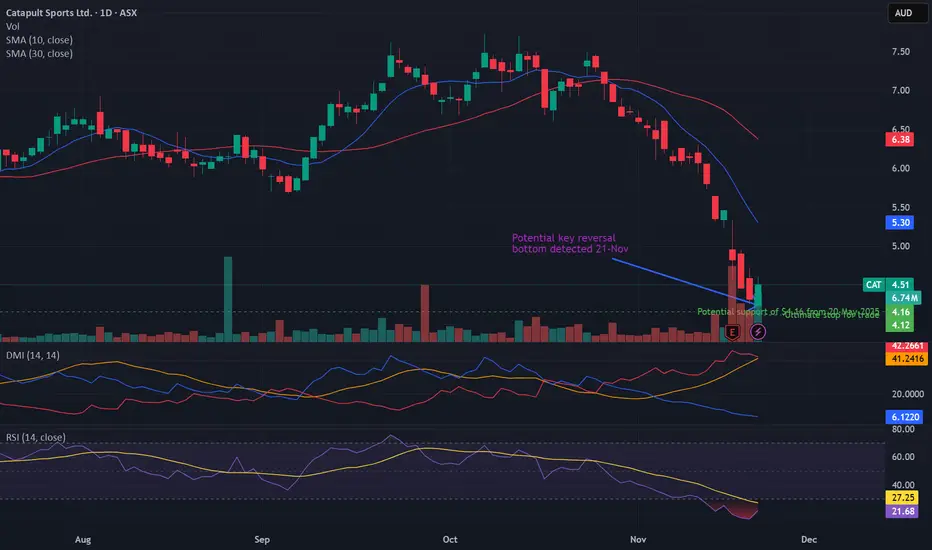
Potential key reversal bottom detected for CATAwait signals for entry such as DMI/ADX and/or RSI swing to the bullish direction.
Stop loss for the trade involving ASX:CAT (and indication that this trade is an absolute 'no-go') is any trade below the low of the signal day of 21st November (i.e.: any trade below $4.13).
Potential outside week and bullish potential for IMAXEntry conditions:
(i) higher share price for NYSE:IMAX above the level of the potential outside week noted on 7th November (i.e.: above the level of $35.60).
Stop loss for the trade would be:
(i) below the low of the outside week on 3rd November (i.e.: below $31.27), should the trade activate.

XAUUSD- GOLD FORMING "W" PATTERN KEY (READ CAPTION)Hello trader's what do you think about gold
Gold (XAUUSD) is currently forming a clear W Pattern / Double Bottom structure, which is a strong indication of a potential bullish reversal in the market.
Support Levels
Support 1: 4180 — A strong reaction zone where buyers have previously held the market multiple times.
Support 2: 4293 — A higher support zone that can act as a continuation level if price respects it on a pullback.
Market Outlook
The price action is showing a clean W pattern, suggesting that if the neckline breaks, we can expect a strong bullish move.
If price retraces downward, both 4180 and 4293 serve as ideal buy zones for buyers preparing for the next bullish leg.
Technical Summary
W Pattern → Potential bullish reversal
4180 → Deep correction support
4293 → Continuation support
please don't forget to like comment and follow

BTCUSD BEARISH OR RETEST (READ CAPTION)Hi trader's what do you think about bitcoin usd
BTCUSD is currently showing a bearish retracement structure, suggesting that price may continue to correct downward after failing to hold higher levels.
🔹 Resistance Level: 93,800
This level acts as a strong rejection zone.
If price retests 93,800 and fails to break above, it confirms bearish continuation. Sellers are expected to remain active below this zone.
🔹 Support Level: 90,800
This is the first support level where price may attempt a short-term bounce.
If BTC breaks below 90,800, bearish momentum will likely increase.
🔹 Demand Zone: 89,200
This is the major demand zone where strong buyers may step in.
If price reaches 89,200, a potential bullish reaction can happen, but until then the market remains in a bearish correction phase.
📉 Market Outlook
BTCUSD remains under bearish pressure as long as it stays below 93,800.
Break below 90,800 opens the way toward 89,200 demand, where buyers are expected to show stronger interest.
please don't forget to like comment and follow thank you

$META | COVERAGE INITIATED — Personal Position Update [W49]COVERAGE INITIATED — Bullish Classification (Trend Shift Identified)
META — WEEK 49 TREND REPORT | 12/05/2025
Ticker: NASDAQ:META
Timeframe: W
This is a reactive structural classification based on the weekly chart as of this timestamp. Price conditions are evaluated as they stand — nothing here is predictive or forward-assumptive.
⸻
Author’s Note — Personal Position Update
I initiated my own position on [ NASDAQ:META ] during Week [ 49 ], entering at $ [ 673.42 ].
This decision follows my personal criteria: I only participate when my system identifies a verified structural trend shift supported by both a confirmed weekly flag and a qualifying candle state. This note reflects my activity only and is not a suggestion for anyone else.
As of this update, my position is currently up ~ [ 0% ] from my entry.
My structural exit level is $ [ 670.20 ] on a weekly-close basis. This level will continue to adjust upward automatically as the structure strengthens. If price closes below that threshold, my system classifies the trend as structurally compromised, and that is where I personally exit.
This update exists solely to document my own participation and the structural levels I monitor. It is not predictive and does not imply any future outcome.
⸻
Structural Integrity
• 1) Current Trend Condition [ Numbers to Watch ]
• Current Price @ $
• Trend Duration @ +0 Weeks
( Bullish )
• Trend Reversal Level ( Bearish ) @ $
• Trend Reversal Level ( Bearish Confirmation ) @ $
• Pullback Correction Retracement @ $
• Correction Structural Support @ $
⸻
2) Structure Health
• Retracement Phase:
Uptrend (operating above 78.6%)
• Position Status:
Caution (interacting with structural layers)
⸻
3) Temperature :
Warming Phase
⸻
4) Momentum :
Neutral
⸻
Structural Alignment
NEUTRAL STRUCTURAL CONDITION
This mark represents a period where directional behavior was unclear. Market movement here reflected compression, chop, or indecision — neither trend direction was dominant. It does not signal continuation or reversal, only that price action was not showing strong alignment in either direction.
⸻
Methodology Overview
This classification framework evaluates directional conditions using internal trend-interpretation logic that references price behavior relative to its structural layers. These relationships are used to identify when price movement aligns with the framework’s criteria for directional phases, transition points, or regime shifts. Visual elements or structural labels reflect these internal interpretations, rather than explicit trading signals or preset indicator crossovers. This framework is observational only and does not imply future outcomes.

$PLTR | COVERAGE INITIATED — Personal Position Update [W49]COVERAGE INITIATED — Bullish Classification (Trend Shift Identified)
PLTR — WEEK 49 TREND REPORT | 12/05/2025
Ticker: NASDAQ:PLTR
Timeframe: W
This is a reactive structural classification based on the weekly chart as of this timestamp. Price conditions are evaluated as they stand — nothing here is predictive or forward-assumptive.
⸻
Author’s Note — Personal Position Update
I initiated my own position on [ NASDAQ:PLTR ] during Week [ 49 ], entering at $ [ 181.76 ].
This decision follows my personal criteria: I only participate when my system identifies a verified structural trend shift supported by both a confirmed weekly flag and a qualifying candle state. This note reflects my activity only and is not a suggestion for anyone else.
As of this update, my position is currently up ~ [ 0% ] from my entry.
My structural exit level is $ [ 177.54 ] on a weekly-close basis. This level will continue to adjust upward automatically as the structure strengthens. If price closes below that threshold, my system classifies the trend as structurally compromised, and that is where I personally exit.
This update exists solely to document my own participation and the structural levels I monitor. It is not predictive and does not imply any future outcome.
⸻
Structural Integrity
• 1) Current Trend Condition [ Numbers to Watch ]
• Current Price @ $
• Trend Duration @ +0 Weeks
( Bullish )
• Trend Reversal Level ( Bearish ) @ $
• Trend Reversal Level ( Bearish Confirmation ) @ $
• Pullback Retracement @ $
• Correction Support @ $
⸻
2) Structure Health
• Retracement Phase:
Uptrend (operating above 78.6%)
• Position Status:
Healthy (price above both structural layers)
⸻
3) Temperature :
Neutral Phase
⸻
4) Momentum :
Bullish
⸻
Structural Alignment
NEUTRAL STRUCTURAL CONDITION
This mark represents a period where directional behavior was unclear. Market movement here reflected compression, chop, or indecision — neither trend direction was dominant. It does not signal continuation or reversal, only that price action was not showing strong alignment in either direction.
⸻
Methodology Overview
This classification framework evaluates directional conditions using internal trend-interpretation logic that references price behavior relative to its structural layers. These relationships are used to identify when price movement aligns with the framework’s criteria for directional phases, transition points, or regime shifts. Visual elements or structural labels reflect these internal interpretations, rather than explicit trading signals or preset indicator crossovers. This framework is observational only and does not imply future outcomes.

XAUUSD KEY LEVELS FOR 05-12Greetings
Hello traders, This is the crucial resistance zone for XAU-USD at 30 minute,
based on the movement of the day prior and market trends.
Resistance zone (White line)
Important levels:
4237.76 is the entry
Target: 4227.76
Stop loss: 4247.76
1:1 Risk-Reward Ratio
We are inspired to continue learning and exchanging ideas by your likes and boosts!

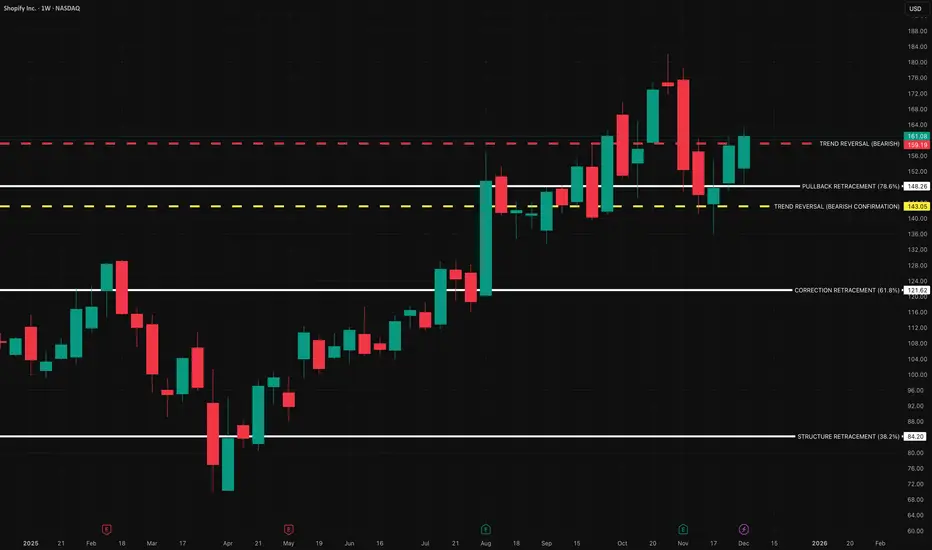
$SHOP | COVERAGE INITIATED — Personal Position Update [W49]COVERAGE INITIATED — Bullish Classification (Trend Shift Identified)
SHOP — WEEK 49 TREND REPORT | 12/05/2025
Ticker: NASDAQ:SHOP
Timeframe: W
This is a reactive structural classification of SHOP based on the weekly chart as of this timestamp. Price conditions are evaluated as they stand — nothing here is predictive or forward-assumptive.
⸻
Author’s Note — Personal Position Update
I initiated my own position on [ NASDAQ:SHOP ] during Week [ 49 ], entering at $ [ 161.08 ].
This decision follows my personal criteria: I only participate when my system identifies a verified structural trend shift supported by both a confirmed weekly flag and a qualifying candle state. This note reflects my activity only and is not a suggestion for anyone else.
As of this update, my position is currently up ~ [ 0% ] from my entry.
My structural exit level is $ [ 159.19 ] on a weekly-close basis. This level will continue to adjust upward automatically as the structure strengthens. If price closes below that threshold, my system classifies the trend as structurally compromised, and that is where I personally exit.
This update exists solely to document my own participation and the structural levels I monitor. It is not predictive and does not imply any future outcome.
⸻
Structural Integrity
1) Current Trend Condition [ Numbers to Watch ]
• Current Price @ $
• Trend Duration @ +0 Weeks
( Bullish )
• Trend Reversal Level ( Bearish ) @ $
• Trend Reversal Level ( Bearish Confirmation ) @ $
• Pullback Retracement @ $
• Correction Support @ $
⸻
2) Structure Health
• Retracement Phase:
Uptrend (operating above 78.6%)
• Position Status:
Healthy (price above both structural layers)
⸻
3) Temperature :
Neutral Phase
⸻
4) Momentum :
Bullish
⸻
Structural Alignment
UPWARD STRUCTURAL ALIGNMENT
This mark reflects a point where market behavior supported the continuation of the existing upward direction. It does not imply forecasting or targets — it simply notes where strength became observable within the current trend. Its meaning holds only while price continues to respect the broader structural levels that define the trend.
⸻
Methodology Overview
This classification framework evaluates directional conditions using internal trend-interpretation logic that references price behavior relative to its structural layers. These relationships are used to identify when price movement aligns with the framework’s criteria for directional phases, transition points, or regime shifts. Visual elements or structural labels reflect these internal interpretations, rather than explicit trading signals or preset indicator crossovers. This framework is observational only and does not imply future outcomes.
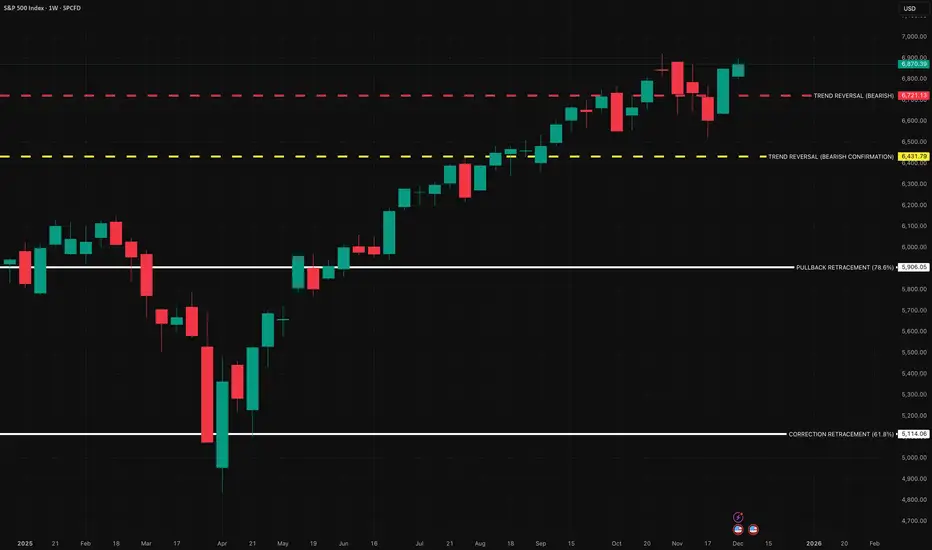
$SPX | COVERAGE INITIATED — Personal Position Update [W49]SPX — WEEK 49 COVERAGE INITIATED | 12/05/2025
Ticker: SP:SPX
Timeframe: W
This is a reactive structural classification of SPX based on the weekly chart as of this timestamp. Price conditions are evaluated as they stand — nothing here is predictive or forward-assumptive.
⸻
Author’s Note — Personal Position Update
I initiated my own position on [ SP:SPX ] during Week , entering at $ . This decision follows my personal criteria: I only participate when my system identifies a verified structural trend shift supported by both a confirmed weekly flag and a qualifying candle state. This note reflects my activity only and is not a suggestion for anyone else.
As of this update, my position is currently up ~ from my entry. My structural exit level is $ on a weekly-close basis. This level will continue to adjust upward automatically as the structure strengthens. If price closes below that threshold, my system classifies the trend as structurally compromised, and that is where I personally exit.
This update exists solely to document my own participation and the structural levels I monitor. It is not predictive and does not imply any future outcome.
⸻
Structural Integrity
1) Current Trend Condition [ Numbers to Watch ]
Current Price @ $
• Trend Duration @ +2 Weeks
( Bullish )
• Trend Reversal Level ( Bearish ) @ $
• Trend Reversal Level ( Bearish Confirmation ) @ $
• Pullback Retracement @ $
• Correction Support @ $
⸻
2) Structure Health
• Retracement Phase:
Uptrend (operating above 78.6%)
• Position Status:
Healthy (price above both structural layers)
⸻
3) Temperature :
Warming Phase
⸻
4) Momentum :
Bullish
⸻
Structural Integrity
UPWARD STRUCTURAL ALIGNMENT
This mark reflects a point where market behavior supported the continuation of the existing upward direction. It does not imply forecasting or targets — it simply notes where strength became observable within the current trend. Its meaning holds only while price continues to respect the broader structural levels that define the trend.
⸻
Methodology Overview
This classification framework evaluates directional conditions using internal trend-interpretation logic that references price behavior relative to its structural layers. These relationships are used to identify when price movement aligns with the framework’s criteria for directional phases, transition points, or regime shifts. Visual elements or structural labels reflect these internal interpretations, rather than explicit trading signals or preset indicator crossovers. This framework is observational only and does not imply future outcomes.
Trade Plan: GBPUSD Buy SetupMarket Context
Last week, GBPUSD broke above the resistance / previous week’s high at 1.3268.
Current price action is ranging between 1.3316 – 1.3384.
I anticipate a retracement into the prior supply zone, now acting as demand, around 1.3259 – 1.3275.
Trade Rationale
Breakout above weekly high confirms bullish momentum.
Demand zone at 1.3259 – 1.3275 offers a potential area for price reaction and continuation higher.
Tight stop below demand zone ensures controlled risk.
Target aligns with upper range resistance near 1.3350.
Trade Setup
Entry: 1.3280
Stop Loss (SL): 1.3255
Take Profit (TP): 1.3350
Risk-to-Reward (RR): 2,8x
Execution Notes
Wait for price confirmation at demand zone before entry.
⚠️ Disclaimer ⚠️ This journal entry is for educational and documentation purposes only. It does not constitute financial advice or a recommendation to trade. All trading involves risk, and past performance does not guarantee future results. Always conduct your own analysis and consult with a licensed financial professional before making trading decisions.

XRP — [2D] WEEK 49 TREND REPORT | 12/05/2025XRP — WEEK 49 TREND REPORT | 12/05/2025
Ticker: BINANCE:XRPUSDT
Timeframe: 2D
This is a reactive structural classification of XRP based on the weekly chart as of this timestamp. Price conditions are evaluated as they stand — nothing here is predictive or forward-assumptive.
⸻
1) Current Trend Condition [ Numbers to Watch ]
Current Price @ 2.03
• Trend Duration @ +22 Days ( Bullish )
• Trend Reversal Level ( Bullish ) @ 2.05
• Trend Reversal Level ( Bullish Confirmation ) @ 2.26
• Correction Retracement @ 2.41
• Structural Support @ 1.64
⸻
2) Structure Health
• Retracement Phase:
Testing Structure (approaching 38.2%)
• Position Status:
Unstable (price below both structural layers)
⸻
3) Temperature :
Cooling Phase
⸻
4) Momentum :
Bearish
⸻
Author’s Note
DOWNWARD STRUCTURAL ALIGNMENT
This mark identifies a moment where the market showed clearer alignment with downside direction. It does not predict future movement, but acknowledges where weakness became more evident within the prevailing structure. Its relevance remains only while price continues to hold beneath key structural boundaries.
⸻
Methodology Overview
This classification framework evaluates directional conditions using internal trend-interpretation logic that references price behavior relative to its structural layers. These relationships are used to identify when price movement aligns with the framework’s criteria for directional phases, transition points, or regime shifts. Visual elements or structural labels reflect these internal interpretations, rather than explicit trading signals or preset indicator crossovers. This framework is observational only and does not imply future outcomes.

AUDJPY Wave Analysis – 5 December 2025
- AUDJPY broke long-term resistance level 102.30
- Likely to rise to resistance level 105.20
AUDJPY currency pair recently broke above the long-term resistance level 102.30 (former multi-month high from November).
The breakout of the resistance level 102.30 accelerated the active impulse waves iii and 5 – which belong to the intermediate impulse wave (3) from May.
Given the overriding daily uptrend and the strongly bullish Australian dollar sentiment, AUDJPY currency pair can be expected to rise to the next resistance level 105.20.

Aptos Wave Analysis – 5 December 2025
- Aptos testing major support at 1.688
- Likely to fall to support level 1.5000
Aptos cryptocurrency has been falling strongly in the last few trading sessions inside the minor impulse wave B from the end of October.
The active wave B belongs to the medium-term ABC correction (B) from the start of October.
The price is currently testing the major support at 1.688 (monthly low from October) – the breakout of which can lead to further losses toward 1.5000.

AUD/USD Rips Toward Resistance- Exhaustion Risk BuildsThe advance has now extended more than 3.5% off those lows with price rallying in ten of the past eleven sessions. AUD/USD is trading within the confines of an ascending pitchfork extending off the November lows with the rally now approaching resistance into the upper parallel at the 2025 high-day close (HDC) at 6653. The focus turns to the reaction at this key technical hurdle in the days ahead.
An embedded channel highlights initial support at the July high at 6625 and is backed by the 61.8% retracement of the September decline at 6598. Near-term bullish invalidation is now raised to the August high and the Fed-day reversal close at 6569/75. Note that the median-line converges on this threshold next week, and losses below this slope would threaten a larger correction within this multi-week uptrend.
A topside breach / daily close above this key hurdle could fuel another bout of accelerated Aussie gains with subsequent resistance objectives eyed at the 67-handle and the 78.6% retracement of the 2024 decline at 6723. Look for a larger reaction here IF reached.
Bottom line: AUD/USD is approaching confluent uptrend resistance into the close of the week, and the risk rises for near-term exhaustion here. From a trading standpoint, a good zone to reduce portions of long-exposure / raise protective stops. Losses should be limited to 6569 IF price is heading higher on this stretch with a close above the upper parallel / 6653 needed to fuel the next major leg of the advance. Keep in mind we get the release of the RBA and FOMC interest rate decisions next week.
-MB
