How to properly seize gold trading opportunities?Gold Technical Analysis: Gold rebounded yesterday, finding support near the 5-day moving average, but as expected, it encountered resistance around 4230 and retreated to around 4195. Weaker-than-expected ADP non-farm payroll data caused another rebound to around 4241, but the price subsequently retreated again to around 4195. The daily chart ultimately closed with a bearish doji candlestick with an upper shadow. Reviewing yesterday's price action, although there was a rebound, it failed to break Tuesday's high, indicating market apprehension about Tuesday's bearish candlestick. The positive ADP data only pushed the high to around 4241, suggesting a weakening of bullish momentum. A short-term technical correction is possible. Based on the daily chart structure, the key support level to watch today is the 10-day moving average around 4180-4170, while the resistance level to watch is around 4230-4240.
Returning to the hourly chart, gold is currently trending upwards within a range. During the US session, consider a buy-on-dips strategy around the 4180-4170 area. If the previous high of 4230-4240 resistance fails to hold, then consider shorting. Plan your trade, trade your plan. There are no gods in this world; it's just about seeing one step ahead. When you've considered everything that might happen, victory is assured. In summary, today's gold trading strategy is to primarily buy on dips and secondarily sell on rallies. The key resistance level to watch in the short term is around 4230-4240, and the key support level is around 4180-4165. Please keep up with the pace.
Support and Resistance

Just a chart showing the price targets for silverJust a price chart tracking price targets for silver. After it's all over, it's interesting to see who was close, and what their methods were.

IRYSUSDT.P: short setup from daily support at 0.030873BINANCE:IRYSUSDT.P is currently showing signs of market participants exiting positions accumulated pre-listing. The asset is hovering near a psychological mark — its listing price. For two days, the price has consolidated above this level, with all attempts to rally ending in failure, which, given the broader bearish trend across the crypto market, suggests the downtrend is likely to continue. To confirm this outlook, the formation of a solid pre-breakout base following at least one test of the level is essential. However, given the potential for sharp upward reversals in such scenarios, the specific character of price action right at the critical level remains the deciding factor before any potential breakdown.
Key factors for this scenario:
Global & local trend alignment
Price void / low liquidity zone beyond level
Correlation with the market
Volatility contraction on approach
Immediate retest
Closing near the level
Factors that contradict this scenario:
Lack of consolidation
Was this analysis helpful? Leave your thoughts in the comments and follow to see more.

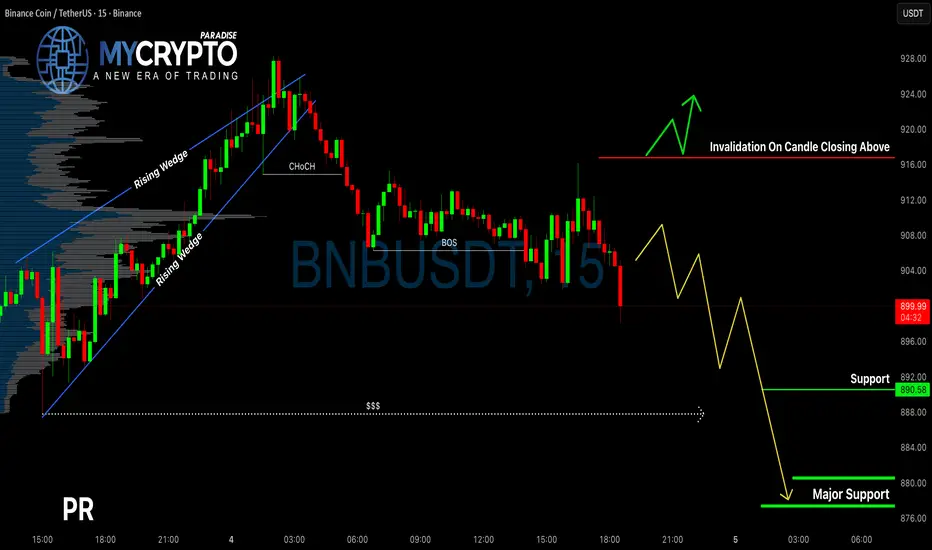
BNB Just Triggered a Breakdown, Are You Ready for the Next Move?Yello, Paradisers! Have you noticed how BNB quietly broke down from its rising wedge while most traders are still waiting for direction? This could be the early signal of a much deeper move—if you're not prepared, you might miss the whole thing.
💎BNBUSDT has officially broken down from a rising wedge formation—a pattern that typically signals a bearish reversal. What makes this even more significant is the clear bearish Change of Character (CHoCH) on the chart, which adds further confirmation that the trend may be shifting downward.
💎We’ve already seen a bearish Break of Structure (BoS), suggesting that downside momentum is building. However, instead of jumping in now, the higher-probability setup would be to wait for a pullback. Ideally, we want to see the price return to a more premium level, where we can then look for confirmation through a bearish candlestick pattern. That would give us a much better risk-to-reward entry point. Once confirmed, we’ll be targeting the next zones of liquidity and support lower on the chart.
💎That said, we always need to plan for the invalidation scenario. If price breaks above our invalidation level and closes a full candle above it, the current bearish thesis would no longer be valid. In that case, it’s best to step aside and wait for more reliable price action before taking any positions. Patience will protect your capital more than any indicator.
🎖Strive for consistency, not quick profits. Treat the market as a businessman, not as a gambler. The next few moves will separate those who follow their plan from those who trade emotionally. Stay sharp, Paradisers.
MyCryptoParadise
iFeel the success🌴
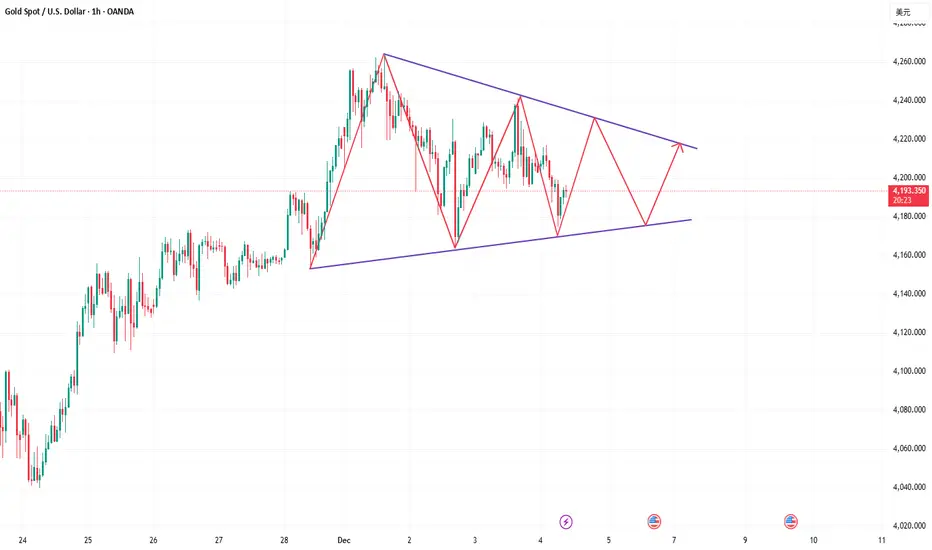
GOLD → Retest of consolidation support on uptrend FX:XAUUSD is trading in a sideways range around $4,200, awaiting new labor market data to determine the Fed's policy trajectory after December's rate cut.
Weak US data (a 32K decline in ADP employment and a slight increase in ISM services to 52.6) did not change market expectations. The probability of a 25 bp Fed rate cut on December 11 is around 90%. Attention has shifted to the trajectory of policy easing in early 2026. Key factors will be data on unemployment claims and sentiment on Wall Street.
The fundamental background is relatively positive, and the dollar has entered a correction phase due to expectations of lower rates, which may support the gold price...
Resistance levels: 4238, 4262
Support levels: 4185, 4175
Gold is testing the support levels of the key trading range. If the bulls keep the price above 4185 and form a bullish reversal pattern, then in the short and medium term, we can expect growth to intermediate highs.
Best regards, R. Linda!

ETHEREUM → The emergence of a positive driver?BINANCE:ETHUSDT is soaring amid a news rally and testing resistance at 3230. The daily increase was almost 20%. If growth is expected, then after a slight correction...
Fundamental background: the market reacted to rumors of the replacement of the Fed chairman with Kevin Hassett, who is more “dovish” and loyal to cryptocurrencies. The market broke the local structure and updated the interim maximum from 3070 to 3230. A false breakout of resistance is forming relative to the key resistance level, and the market is entering a correction/stagnation phase.
Bitcoin, the main driver of the cryptocurrency market, faced strong resistance at 95K. The global market trend is downward, and a change in trend will require time and more confirmation...
There is a struggle for resistance in the market, and several scenarios are possible: consolidation and a breakout of resistance, or growth after correction...
Resistance levels: 3230, 3370
Support levels: 3172 (local), 3057
High probability: a false breakout of 3230 will trigger a correction to 3050 (before the news). If the bulls keep the price above 3050, growth may continue as part of the change in the fundamental background.
BUT! If buyers keep the price without correction, then the focus will be on 3230. Consolidation above this level could trigger growth to 3370 - 3620.
Best regards, R. Linda!

Recent Gold Market Dynamics, Analysis, and Strategies!Gold rebounded yesterday, finding support around the 5-day moving average, but as expected, it encountered resistance near 4230 and retreated to around 4195. Influenced by the anticipated ADP non-farm payroll data, the price rebounded again to around 4241, but subsequently retreated back to around 4195. The daily chart ultimately closed with a bearish doji candlestick with an upper shadow. Reviewing yesterday's price action, although there was a rebound, it failed to break Tuesday's high, indicating market apprehension about Tuesday's bearish candlestick. Even the positive ADP data only pushed the high to around 4241, suggesting a weakening of bullish momentum. A technical correction is possible in the short term. Based on the daily chart structure, the key support level to watch today is the 10-day moving average around 4170, while the resistance level to watch remains around 4230-4240. Based on the hourly chart, gold may trade sideways today. There is short-term trendline resistance above, which coincides with the upper limit of the range around 4230-4240. Therefore, the 4230-4240 area can be considered a key resistance level today. On the downside, pay attention to the short-term support area around 4180-4170. If the intraday structure shifts downward, there is still a possibility of going back to around 4150.
In terms of trading strategy, gold is expected to remain range-bound today, maintaining a strategy of buying low and selling high within the 4240-4170 range. Avoid overly extended directional expectations; first observe the range, then look for a breakout. Watch for resistance around 4230-4240; a rebound failing to break this level would be a good entry point for short-term short positions. On the downside, watch for support around 4180-4170; a pullback and stabilization would present an opportunity to buy on dips.
BTCUSD | Waiting for breakbitcoin got rejected from the red zone a few days ago. Posted that idea a while ago.
Since then it has come back and struggled a bit to break through.
If btc where to break the bottom blue line you see on the chart. I would be confident we are going to see lower prices fast.
Let me know what your analysis and outlook is for bitcoin!
Stay safe out there and do your own due diligence, this is not investment advise!

Coca-Cola Wave Analysis – 4 December 2025
- Coca-Cola reversed from long-term resistance level 73.25
- Likely to fall to support level 70.00
Coca-Cola recently reversed from the resistance zone between the powerful long-term resistance level 73.25 (which has been reversing the price from the middle of 2024) and the upper weekly Bollinger Band.
The downward reversal from this resistance zone is likely to form the weekly Japanese candlesticks reversal pattern Evening Star Doji – if the price closes this week near the current levels.
Given the strength of the resistance level 73.25 and the overbought weekly Stochastic, Coca-Cola can be expected to fall to the next support level 70.00.

DraftKings Wave Analysis – 4 December 2025- DraftKings reversed from support zone
- Likely to rise to resistance level 36.00
DraftKings recently reversed from the strong support zone between the multi-year support level 30.00 (which has been reversing the price from 2024) and the lower weekly Bollinger Band.
The upward reversal from this support zone started the active weekly correction 2.
DraftKings can be expected to rise further to the next resistance level 36.00 (which reversed the price earlier this year, as can be seen below).

Bitcoin Pumps +10% — Bull Trap or Trend Reversal?Bitcoin( BINANCE:BTCUSDT ) has experienced over a +10% increase in the past two days, which came as a surprise to many analysts considering the previous bearish momentum. In other words, Bitcoin is on something of a roller coaster lately😂.
The question now is whether Bitcoin has started a new bullish trend or if it’s likely to see another decline.
Let’s dive into the 4-hour chart of Bitcoin. Currently, Bitcoin is approaching a resistance zone($94,850-$93,000), a Cumulative Short Liquidation Leverage($94,710-$94,063), and the monthly pivot point. This cluster of resistances, combined with the recent upward momentum, might make it challenging for Bitcoin to break through.
It’s also worth noting that the trading volume during this recent rally hasn’t been particularly high, so Bitcoin could still surprise us. This recent behavior shows that Bitcoin can move sharply both up and down, so it’s crucial to maintain proper risk management.
From an Elliott Wave perspective, considering Bitcoin’s recent decline, I initially expected that Bitcoin might at least test the low of its main wave 3 again. However, the recent rebound suggests that the main wave 5 may be truncated, and the corrective waves could still push Bitcoin lower, potentially even below $75,000.
From a classical technical analysis perspective, Bitcoin might be forming a bearish flag pattern, with the ascending channel acting as the flag’s pole.
In addition, the USDT.D%( CRYPTOCAP:USDT.D ) is still on an upward trend, which indicates that the cryptocurrency market might still face downward pressure.
Moreover, geopolitical tensions, such as those between the U.S. and Venezuela, could also act as a trigger for further Bitcoin declines if they escalate.
Lastly, the S&P 500 index( SP:SPX ), despite its recent bullish trend, doesn’t show the same positive correlation with Bitcoin. In fact, a decline in the S&P 500 could amplify Bitcoin’s downward movement.
Considering all these factors, I expect Bitcoin to continue its bearish trend and potentially test the heavy support zone. If these support levels break, we could see even more significant declines in the crypto market.
Based on the above explanation, I expect Bitcoin to have at least a correction to the targets I specified on the chart, and then depending on the momentum, we can expect a continuation of the decline or a resurgence.
Note: In general, with the opening of the US markets, financial market movements have become more intense these days than before, and it is better to be prepared for any scenario at that time.
What do you think? Do you believe Bitcoin will dip below $75,000, or will it bounce back?
Cumulative Short Liquidation Leverage: $98,591-$96,688
Cumulative Long Liquidation Leverage: $91,860-$90,960
Stop Loss(SL): $96,200
Points may shift as the market evolves
💡 Please respect each other's opinions and express agreement or disagreement politely.
📌Bitcoin Analysis (BTCUSDT), 4-hour time frame.
🛑 Always set a Stop Loss(SL) for every position you open.
✅ This is just my idea; I’d love to see your thoughts too!
🔥 If you find it helpful, please BOOST this post and share it with your friends.

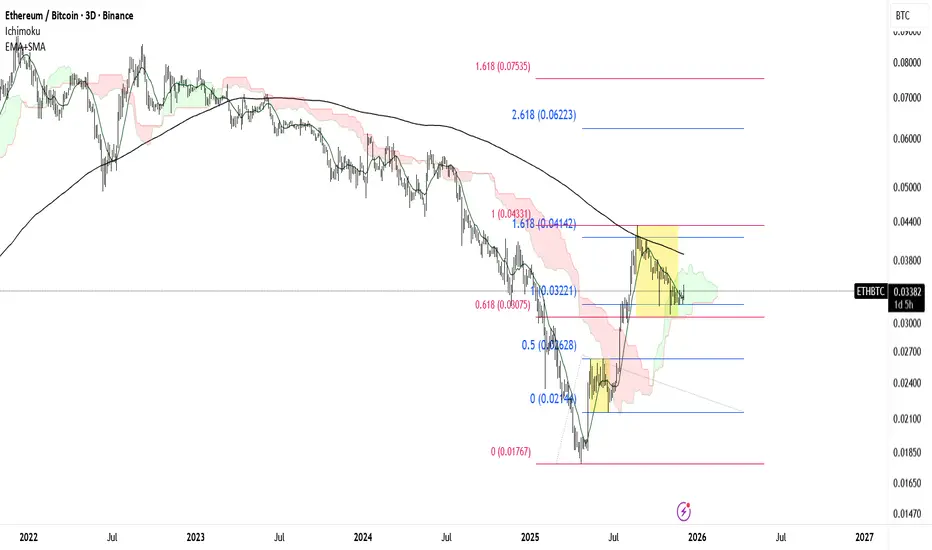
ETH/BTC on the Edge of a Macro BreakoutIt appears that #Ethereum is on the verge of its next major bullish leg.
The 3 day 237 SMA has acted as a key structural resistance, and #ETHBTC has now completed its retracement into the 0.618 Fibonacci zone a level I consider the end of the corrective phase.
A clean breakout above the 237 SMA would likely open the path toward the 0.06 channel, where the next macro resistance cluster resides.
FOLKSUSDT.P: short setup from daily support at 10.758BINANCE:FOLKSUSDT.P has a local level based on the low of a paranormal bar. The extremes of such bars serve as valid levels when confirmed. In this case, the level has been clearly confirmed by a recent touch followed by consolidation above it. If the asset shows low volatility on the 4H or 1H timeframes and closes near the lows, a short position can be considered with a target of approximately 4-to-1. Since the setup is local, the expected move will likely be local as well.
Key factors for this scenario:
Price void / low liquidity zone beyond level
Volatility contraction on approach
Immediate retest
Repeated precise tests of the level
Consolidation with price compression
Closing near the level
Closing near the bar's extreme
Factors that contradict this scenario:
Aggressive high-volatility approach
Lack of consolidation
Was this analysis helpful? Leave your thoughts in the comments and follow to see more.

Dxy bear 15 min chartDxy is heading down Converselry I suspect silver and gold will make an upswing from here by 3%

NVDA Wave Analysis – 4 December 2025- NVDA reversed from support zone
- Likely to rise to resistance level 194.30
NVDA recently reversed with the daily Hammer from the support zone between the multi-month support level 170.00 (which has been reversing the price from August), lower daily Bollinger Band and the support trendline of the daily down channel from October.
NVDA just broke the aforementioned down channel from October – which is lily to strengthen the bullish pressure on NVDA .
Given the clear daily uptrend, NVDA can be expected to rise to the next resistance level 194.30 (which reversed the price at the end of November).

GBPUSD Consolidation growth structure GBP/USD is attempting a trend reversal. Expectations for interest-rate cuts remain elevated, which could help support further upside movement in the pair.
Meanwhile, the U.S. dollar is testing its uptrend support but is struggling to hold above the support level on the index. With markets anticipating additional rate cuts, the dollar may face further weakness, potentially strengthening the British pound in comparison.
Price action has turned bullish after a swift rebound. During the European session, GBP/USD looks poised to rise toward the next resistance zone at 1.33200 – 1.34010.
You may find more details in the chart.
Trade wisely best of luck buddies.
Ps; Support with like and comments for better analysis thanks for supporting.

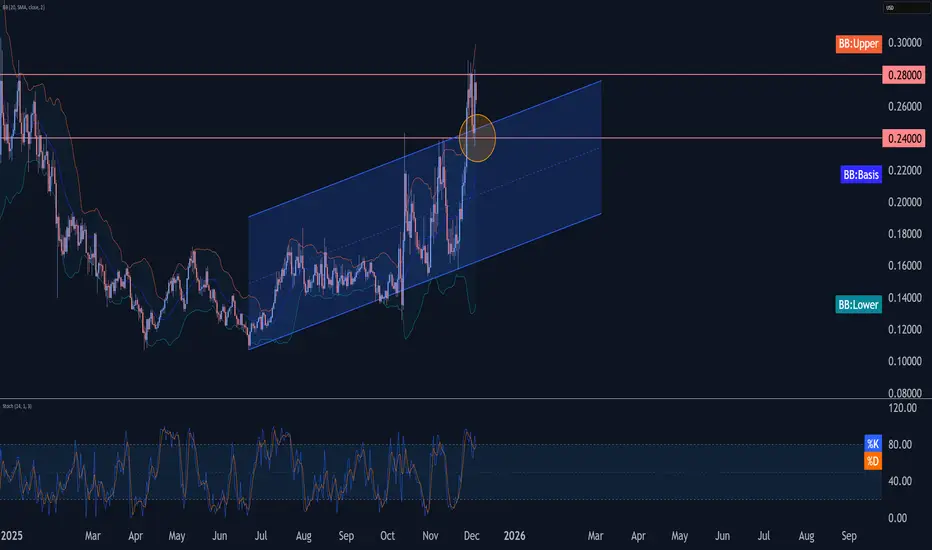
Basic Attention Token Wave Analysis – 4 December 2025
- Basic Attention Token reversed from resistance level 0.2800
- Likely to fall to support level 0.2400
Basic Attention Token recently reversed from the resistance zone between the resistance level 0.2800, upper daily Bollinger Band and the resistance trendline of the daily up channel from October.
The latest downward reversal from this resistance zone is the 4th consecutive unsuccessful attempt to break above this resistance area.
Given the strength of the resistance level 0.2800 and the overbought daily Stochastic, Basic Attention Token can be expected to fall to the next support level 0.2400 (low of the previous correction iv).
MSFT PullbackPattern Identified: Bearish Double Top pattern confirmed on Microsoft ( NASDAQ:MSFT ) with neckline break and clear measured move objectives. Neckline Break Triggers Measured Move to Gap Fill.
Key Confluence:
First Top: Initial rejection
Second Top: Failed breakout, lower high
Neckline: Support connecting swing lows between tops
Confirmation: Neckline break & retest completed
Measured Move Calculation:
TP1: Distance from highest top to neckline, projected onto the breakout zone = $430
TP2: Gap fill zone from May 1st, 2025 = $400
SL: Above Neckline at previous confirmation

TSLA — [2D] WEEK 49 TREND REPORT | 12/04/2025TSLA — WEEK 49 TREND REPORT | 12/04/2025
Ticker: NASDAQ:TSLA
Timeframe: 2D
This is a reactive structural classification of TSLA based on the weekly chart as of this timestamp. Price conditions are evaluated as they stand — nothing here is predictive or forward-assumptive.
⸻
1) Current Trend Condition [ Numbers to Watch ]
Current Price @ 447.66$
• Trend Duration : +7 Days (Bullish)
• Trend Reversal Level ( Bearish ): 418.70$
• Trend Reversal Level ( Bearish Confirmation ): 428.42$
• Pullback Support : 413.70$
• Correction Support : 354.94$
⸻
2) Structure Health
• Retracement Phase:
Uptrend (operating above 78.6%)
• Position Status:
Healthy (price above both structural layers)
⸻
3) Temperature :
Warming Phase
⸻
4) Momentum :
Bullish
⸻
Author’s Note
UPWARD STRUCTURAL ALIGNMENT
This mark reflects a point where market behavior supported the continuation of the existing upward direction. It does not imply forecasting or targets — it simply notes where strength became observable within the current trend. Its meaning holds only while price continues to respect the broader structural levels that define the trend.
⸻
Methodology Overview
This classification framework evaluates directional conditions using internal trend-interpretation logic that references price behavior relative to its structural layers. These relationships are used to identify when price movement aligns with the framework’s criteria for directional phases, transition points, or regime shifts. Visual elements or structural labels reflect these internal interpretations, rather than explicit trading signals or preset indicator crossovers. This framework is observational only and does not imply future outcomes.

AUDCAD SHORTMarket structure bearish on HTFs 3
Entry at Both Weekly and Daily AOi
Weekly Rejection At AOi
Daily Rejection at AOi
Previous Daily Structure Point
H4 Candlestick rejection
Rejection from Previous structure
TP: WHO KNOWS!
Entry 100%
REMEMBER : Trading is a Game Of Probability
: Manage Your Risk
: Be Patient
: Every Moment Is Unique
: Rinse, Wash, Repeat!
: Christ is King.

EURAUD Short Market structure bearish on HTFs DW
Entry at both Weekly and Daily AOi
Weekly Rejection at AOi
Daily Rejection at AOi
Previous Structure point Daily
Daily EMA retest
Around Psychological Level 1.78000
Touching EMA H4
H4 Candlestick rejection
TP: WHO KNOWS!
Entry 95%
REMEMBER : Trading is a Game Of Probability
: Manage Your Risk
: Be Patient
: Every Moment Is Unique
: Rinse, Wash, Repeat!
: Christ is King.

GBPAUD SHORTMarket structure bearish on HTFs 3
Entry at Daily AOi
Weekly Rejection at AOi
Previous Structure point Daily
Around Psychological Level 2.02500
Touching EMA H4
H4 Candlestick rejection
Rejection from Previous structure
TP: WHO KNOWS!
Entry 100%
REMEMBER : Trading is a Game Of Probability
: Manage Your Risk
: Be Patient
: Every Moment Is Unique
: Rinse, Wash, Repeat!
: Christ is King.

FireHoseReel | TRX Technical Outlook After Resistance Break🔥 Welcome to FireHoseReel!
Let’s jump into the TRX market structure analysis.
👀 TRX – 4H Overview
TRX has successfully broken above the $0.2824 resistance and is now pushing higher.
Over the past 24 hours, TRX trading volume has dropped by 20%.
📊 Volume Analysis
Watch the volume closely on the chart. Every time price previously reached $0.2824, it faced strong sell pressure and sell orders were heavily filled.
On the third and current test, fewer sell orders were present, and with a slight increase in volume, this resistance was finally broken.
✍️ TRX Trading Scenarios
Below are the active scenarios you can use alongside your trading strategy:
🟢 Long Scenario
Since TRX has broken this resistance, you can enter a long position, placing your stop-loss below the current low.
Alternatively, wait for better consolidation above this level and enter on the pullback for a safer setup.
🔴 Short Scenario
A break below the $0.2791 support, accompanied by strong selling pressure, could lead to a deeper drop and offers a valid short setup.
🧠 Protect your capital first. No setup is worth blowing your account. If risk isn’t controlled, profit means nothing. Trade with rules, not emotions.
