HYPE/USDT: Rejection at 50.000 Keeps Sellers in Short-Term ContrHYPE/USDT is facing rejection near the 50.000 resistance zone, showing signs of weakening momentum after a strong rebound. Price remains within a downward structure, and the recent compression pattern points to buyer exhaustion.
If the pair fails to hold above 47.000, a drop toward the 42.000 support zone becomes more likely. Sellers remain in control as long as price stays below the 50.000 resistance level.
Support and Resistance

AUD/CAD: Overextended Rally Eyes Resistance Near 0.9227AUD/CAD is approaching the 0.9227 resistance zone following a clean breakout from its previous range. However, price action now appears overextended, with signs of exhaustion forming near last month’s high.
A rejection from this area could prompt a pullback toward 0.9166, aligning with the lower trendline support. With momentum fading, buyers may begin taking profits ahead of this key resistance level.

GOLD → The market is testing 4K ahead of the Fed's decision FX:XAUUSD is testing $4,000 ahead of the Fed's decision, partially recovering from a 3.5% drop this week. The fundamental backdrop is mixed, but technically, the signs of a bull market are positive.
Key factors : Fed decision (today): A 25 bps rate cut is expected, but the main focus is on the vote count and Powell's comments.
A dovish scenario (emphasis on risks to the labor market) will support gold. A hawkish surprise will reinforce the correction. Trump-Xi meeting (tomorrow): Statements about lowering tariffs weaken demand for defensive assets.
Gold is in limbo; in the second half of the European session and the beginning of the US session, the market may enter a phase of stagnation. Growth is only likely if the Fed takes a soft tone, while progress in trade negotiations or a hawkish surprise from the Fed will prolong the correction.
Resistance levels: 4015, 4050, 4085
Support levels: 3975, 3945, 3900
If the bulls can hold their ground above 4K, we will see strong support, in which case growth to 4050-4100 may be triggered. Otherwise, the market may form a correction to 3975-3945. It is worth keeping an eye on comments from Powell and Trump... Volatility will be high...
Best regards, R. Linda!

POTENTIAL FOR THE GOLD MARKETXAU/USD 4H - As you can see I have marked out two potential outcomes for this pair on how I feel price could play out over the course of the next few days, both setups are valid and seem realistic.
Setup B is the most likely setup in my eyes and this is because I feel price is exhausted, the Demand in the market is running out, hence the big move to the downside. I feel price will have to come lower in order to pick up more Demand before the next bull run.
However price has traded down and into a Demand Zone and we are seeing large amounts of volume being introduced, and with the current state of the US economy the Gold Spot could still just be out-powering the Dollar.
Setup A would be following the prevailing trend and overall be a safer option as this market is bullish dominant but its important we wait for entry confirmation before we execute, looking for the break to the upside first followed by a pullback.

XAU/USD
Good morning, traders! ☀️
In today’s gold analysis, I’m watching for a potential bounce around the 4012–4020 zone, which aligns with a key resistance level and the 0.5 Fibonacci retracement. Ideally, I’d like to see price move down toward the 3982 support area, where the 0.382 Fib level sits, before aiming for a bullish reversal.
With major news events on the calendar today, many traders are eyeing lower zones on the chart to position themselves long. Stay sharp and manage your risk—reducing your lot size is crucial in volatile conditions if you want to protect your account.
Wishing you all a profitable and disciplined trading day! 🚀📈

BankNifty levels - Oct 30, 2025Utilizing the support and resistance levels of BankNifty, along with the 5-minute timeframe candlesticks and VWAP, can enhance the precision of trade entries and exits on or near these levels. It is crucial to recognize that these levels are not static, and they undergo alterations as market dynamics evolve.
The dashed lines on the chart indicate the reaction levels, serving as additional points of significance. Furthermore, take note of the response at the levels of the High, Low, and Close values from the day prior.
We trust that this information proves valuable to you.
* If you found the idea appealing, kindly tap the Boost icon located below the chart. We encourage you to share your thoughts and comments regarding it.
Wishing you successful trading endeavors!

Nifty levels - Oct 30, 2025Nifty support and resistance levels are valuable tools for making informed trading decisions, specifically when combined with the analysis of 5-minute timeframe candlesticks and VWAP. By closely monitoring these levels and observing the price movements within this timeframe, traders can enhance the accuracy of their entry and exit points. It is important to bear in mind that support and resistance levels are not fixed, and they can change over time as market conditions evolve.
The dashed lines on the chart indicate the reaction levels, serving as additional points of significance to consider. Furthermore, take note of the response at the levels of the High, Low, and Close values from the day prior.
We hope you find this information beneficial in your trading endeavors.
* If you found the idea appealing, kindly tap the Boost icon located below the chart. We encourage you to share your thoughts and comments regarding it.
Wishing you success in your trading activities!

GBPCHF climbing back UP!GBPCHF is regaining strength in the London session. Waiting for it to reach RESISTANCE zone and see if it will BreakOut and conquer.

Hudco, about to give great moveHUDCO, bouncing from EMAs after taking support, book first profit after 10% Gain

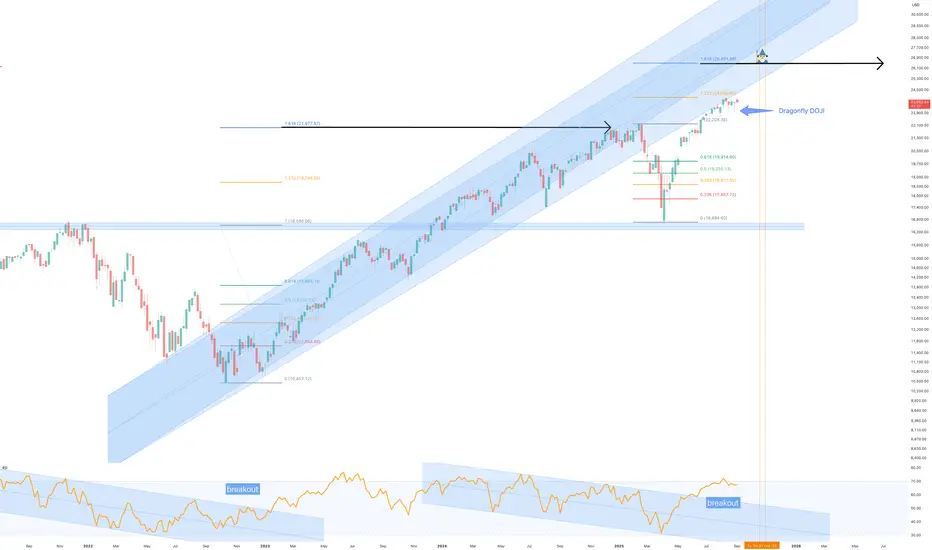
NASDAQ to 26,000 before year end - September, 2025No doubt this idea will be controversial as a majority of ideas published on the platform call for a bearish outlook.
Earlier this year paper hands were flushed out of the market on tariff scares. They couldn’t exit the market fast enough, some didn’t actually know why they were selling as emotions were in full control.
Today those same traders and investors sit in cash as they wait for an opportunity to buy in. Others betting heavily against the trend for Armageddon. All the while the market grinds upwards and onwards.
Two very simple questions everyone must ask when entering or betting against the market:
1. What is the trend?
2. Support and resistance, which is it?
You cannot maintain a bearish bias should you answer both of those questions positively. That’s emotion. Do you find yourself scanning lower timeframes to look for bias confirmation? You'd be in majority then. Notice how many published ideas you see operating in the 15 and 30 minute charts with 2 to 3 month forecasts? Always makes me smile, but it will not change the facts of the chart.
The Trend
Higher lows are evident on the daily chart below, marked out in black. The trend is your friend until the end.
Support & resistance
Look left. On the daily chart we can see multiple support tests with confirmation on past resistance. If the levels do not at first appear, zoom out using a higher timeframe. A majority will zoom in instead to confirm bias, that’s a red flag.
The Put / Call ratio
Retail traders are aggressive in their attempts to “short” this market. Nowhere is that more evident than the Put/Call ratio. Anytime you see dumb money move the put call ratio to 90 and above, the market rips. Just recently short sellers moved the ratio beyond this level. The chart below provides a comparison with the NDX to show what happens next. The rally that follows will typically last up to 2 months on average after this signal.
Why 26000?
The market entered price discovery after the previous all time high breakout of 22k. The forecast area was previously published, see linked ideas. The same conditions that allowed those forecasts now repeat. In addition the Fibonacci extensions; the NDX repeatably rallies to the 1.618 extension after each and every emotional flush out. It’s a gift horse of an opportunity.
Previous years:
Conclusion
Markets climb walls of worry, and this moment is no different. The loudest voices today call for collapse, but the charts, price action, and sentiment data are telling another story entirely. Higher lows, confirmed support, extreme put/call ratios, and Fibonacci extensions all align with one clear outcome: continuation.
A move to 26,000 on the NASDAQ before year-end is not a wild stretch of imagination, but the logical conclusion of repeating market behaviour. Every emotional flush out has historically created the runway for price discovery to the 1.618 extension, and this time is no different.
If you’re betting against the trend, you’re not fighting the market, you’re fighting math, structure, and history. The bears may dominate headlines but that just News. The market is not listening to fear. It’s grinding higher, and the destination is 26,000.
Ww
GOLD | Daily Analysis #1 - 29 October 2025Hello and welcome back to DP
Today we’re excited to launch our Gold daily analysis series. We hope this new addition provides useful and practical insights for your trading decisions. Please support us with your follows and reactions — it really helps us grow!
Market Review:
After a strong bullish run over the past 2–3 weeks, gold finally started to correct from October 20, 2025, continuing its decline up until yesterday.
On the daily timeframe, we’ve identified:
• Support: 3,897
• Resistance: 4,155
Today’s trading session is particularly important as the Federal Reserve’s interest rate decision is due.
According to CME FedWatch, there’s about a 95% probability that the Fed will cut rates by 25 basis points.
Until the announcement, we may see choppy and sideways movement, but once the decision is released, expect a surge in volume and sharp “kangaroo” moves in both directions as traders react to the news.
1H–4H Technical Analysis:
As seen on the chart, 3,897 and 4,155 remain our key daily support and resistance zones.
• If price breaks above 4,012 and confirms the breakout, gold may extend higher toward 4,083 as the first upside target.
• On the other hand, if price drops below 3,974, it may continue falling toward the 3,897 support zone.
With the Fed’s rate decision approaching, expect increased volatility.
Whichever direction price confirms after the announcement could set the tone for gold’s next major move.
Trade cautiously, keep your stop-loss tight, and avoid chasing price during the initial volatility spike.
Disclaimer:
This content is for informational purposes only and does not constitute financial or investment advice. © DIBAPRISM
Amir D.Kohn

Focus on the Federal Reserve, short once in 4020.#XAUUSD OANDA:XAUUSD TVC:GOLD
Last night, I gave everyone a trading strategy to short at 3975-3990. It can be said that there were several opportunities after the Asian session opened. As long as you followed the strategy and executed the short order, I believe you will definitely have a rich return if you seize any of the opportunities.
However, please note that trading is never done blindly. Price trends change over time, so please combine strategies with flexible responses. For example, since the current gold price has broken through the trendline resistance, short-term traders should be more cautious.
With the trend resistance broken, the short-term bulls have strengthened further. The first resistance level to watch is 4000-4005. As a psychological barrier for previous defense, gold prices will definitely test this resistance level first if they want to rise further. If this level is broken, gold will continue its upward trend and further test yesterday's rebound high of 4020. This is also the key level that bears need to defend today. Therefore, I believe we should not rush into trading in the short term. We can patiently observe the market performance. When the gold price rebounds to the 4010-4020 resistance range and encounters resistance, we can consider shorting gold appropriately.

Gold Analysis (XAU/USD):After a sharp decline in gold prices, the metal is showing a corrective move upward, approaching the 4020 zone, which acts as a key decision level.
📉 If the price rejects the 4020 level, a continuation to the downside is expected, targeting 3930 first and possibly 3900 next.
📈 However, if the price breaks and holds above 4020 on a 4-hour close,
it would confirm a potential bullish reversal, with 4150 being the next major upside target.
💡 Key Trading Zones:
✅ Buy: After a confirmed breakout and retest of 4020.
🔻 Sell: On rejection below 4020.

SOL 2D BULLISH, Entry points New HH coming up?So guy as we have seen a downtrend SOL from 180 price resistance and so now price trading on very critical area. We have fvg on 2D around 120-123 and still haven’t not been taken. So there is two scenarios and mostly like price will reject from fvg and head toward to W fvg which we have Above on Weekly TF. The confirmation will be respect to fvg and overall market conditions. Also I am bearish on SOL 2 weekly TF, which we should not forget. If price respect to fvg and overall market conditions was bullish then we can enter around 120-130 and TP will be 210-220

XAUUSD: Gold Battles the Key 4000 ZoneXAUUSD: Gold Battles the Key 4000 Zone
Hey everyone! Let's dive into Gold (XAUUSD) on the 4-hour chart, where we've seen some dramatic moves recently.
What We've Seen:
Gold made a strong run earlier in the month, but was firmly rejected twice at the 4400 mark, forming a clear "Double Top" pattern (marked with red circles). This led to a significant pullback, pushing price down through several support levels.
Currently, Gold has found some footing after hitting a low and is now attempting to recover.
The Current Battleground: 4000 Key Zone
Price is currently retesting the crucial 4000 Key Zone (highlighted in blue). This level acted as support previously, was broken, and is now being challenged again. The immediate task for buyers is to "Observe the price action if it can break the recent swing high" (marked with the purple circle) just below 4000, which has been acting as immediate resistance.
Scenario 1: Bullish Reclaim & Push Higher (If 4000 Holds Strong)
If Gold can successfully reclaim and hold above this 4000 Key Zone, it would be a strong bullish signal. This could open the door for:
A push towards the 4150 to 4250 1st Resistance zone, where sellers might step in again.
A more sustained recovery attempt, potentially aiming higher if that resistance is overcome.
Scenario 2: Rejection & Further Downside (If 4000 Proves Too Strong)
However, if the 4000 Key Zone acts as strong resistance and Gold fails to break above that recent swing high, we could see:
A reversal back towards the 3900 Immediate Support level.
Should 3900 fail to hold, the next significant support would be the 3800 to 3850 Next Support area.
In Summary:
The 4000 Key Zone is the pivotal point right now. Watch how price reacts here and whether it can overcome that immediate swing high resistance. This will largely dictate Gold's direction in the short term.
Disclaimer:
The information provided in this chart is for educational and informational purposes only and should not be considered as investment advice. Trading and investing involve substantial risk and are not suitable for every investor. You should carefully consider your financial situation and consult with a financial advisor before making any investment decisions. The creator of this chart does not guarantee any specific outcome or profit and is not responsible for any losses incurred as a result of using this information. Past performance is not indicative of future results. Use this information at your own risk. This chart has been created for my own improvement in Trading and Investment Analysis. Please do your own analysis before any investments.

Silver at the CrossroadsOn the daily chart of XAG/USD (Silver), the price is currently hovering just above the 50-day moving average (SMA 50), which has acted as strong dynamic support in previous pullbacks (highlighted in blue circles). This level around 45 USD is once again being tested, forming a potential higher low within the broader uptrend.
If silver successfully holds above the SMA 50 and confirms bullish momentum, the next upside targets lie near 50 USD, followed by 53–54 USD, where previous supply pressure emerged. Sustained volume and momentum could even drive an extension toward 56 USD.
However, a decisive break below 45 USD would invalidate the bullish structure and likely trigger a deeper correction. In that case, price could fall toward 42 USD, and if selling pressure persists, even retest the 40 USD region.
Short-term outlook: Watch for confirmation of a bounce from the 50-day moving average.
Long-term outlook: Trend remains bullish above 45 USD, but caution is warranted until clear reversal signals appear.
🎯 Targets: 50 → 53–54 USD
⛔ Stop-loss: Close below 45 USD

Bitcoin consolidated after a strong bullish trendBitcoin’s price has recently consolidated after a strong bullish trend. The market found significant support, suggesting that the current pullback is more of a pause than a reversal. Sellers attempted to push prices lower, but the retracement remains shallow — indicating that buyers are still defending every dip.
Technical Structure:
Price is holding above key support levels, showing strong accumulation interest. The recent consolidation appears to be a healthy correction within the broader uptrend. The structure shows higher lows forming, which supports the ongoing bullish bias. a breakout from the support zone could trigger renewed upside momentum.
If BTC maintains this structure and continues reacting positively from the support area, the next upside targets are projected around 118K – 122K
You may find more details in the chart.
Trade wisely best of Luck Buddies.
Ps; Support with like and comments for better analysis Thanks for Supporting.

Ethereum $ETH still has weekly demand in control. Will it rally?Ethereum CRYPTOCAP:ETH still has weekly demand in control. Will it rally higher? Waiting for some more bullish price action or a pullback to the weekly demand lower at $2,600.

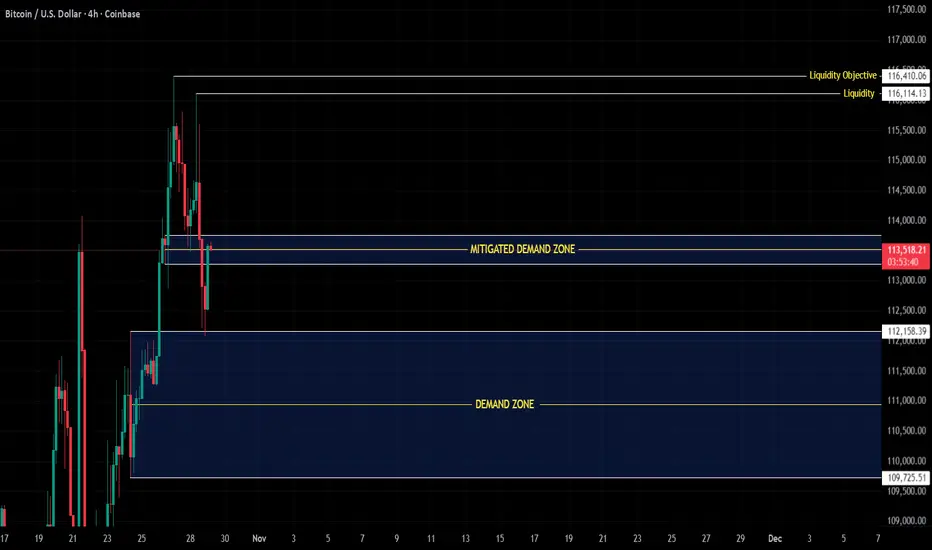
4H Structure Update-Demand Mitigated ,Next Liquidity in Sight
COINBASE:BTCUSD CRYPTO:BTCUSD BINANCE:BTCUSD KRAKEN:BTCUSD
$BTC/Price has reacted strongly from the deeper demand zone (112.15K – 109.70K), showing a clean bullish CHOCH followed by a confirmed BOS on the lower timeframes — signaling early structural alignment for potential continuation.
This reaction confirms mitigation, not reversal, as long as 109.70K remains protected.
Momentum and structure across micro and mid timeframes have now turned bullish, indicating renewed intent from buyers.
The next liquidity objective sits between 116.11K – 116.41K, where previous imbalance and resting liquidity align.
That zone also holds reversal potential, as price may face reaction or redistribution once it reaches those highs.
For now, this remains a healthy corrective phase within the bullish macro structure —
a controlled absorption and expansion sequence in play.
Structure first. Liquidity second.
Confirmation always. 💎
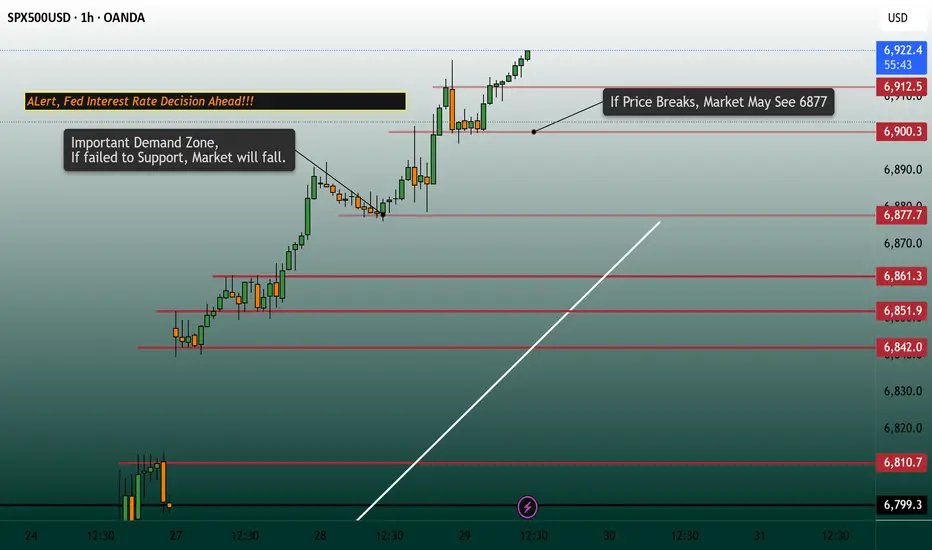
SPX | Daily Analysis #8 - 29 October 2025Hello and welcome back to DP
Market Review:
Over the past two days, as mentioned in our #7 analysis, “a sustained move above 6,860 may signal further bullish momentum toward the upside.”
This scenario played out as expected, with price reaching the 6,900 area for the first time. However, short sellers are now stepping in, attempting to fade the rally and fill the gap.
Currently, all eyes are on the upcoming Federal Reserve interest rate decision and Chairman Powell’s comments. Both China and the U.S. have remained relatively quiet, keeping market attention focused on monetary policy.
Meanwhile, President Trump stated yesterday that he intends to replace Powell in the coming months. Powell has previously clarified that the President does not have direct authority to remove the Fed Chair, so this statement adds a layer of political uncertainty.
According to CME FedWatch, there is about a 95% probability of a 25 bps rate cut being announced.
1H–4H Technical Analysis:
The 6,900 area is currently acting as a strong resistance zone, followed by the 6,878 support area.
• Bears have entered around 6,900–6,917, attempting to push prices lower.
• Bulls, however, are showing resilience and defending the zone.
If price fails to hold above 6,900, we could see a pullback toward 6,878.
Should 6,878 fail to hold, a sharper decline toward the gap zone could occur.
Given the interest rate decision, expect high volatility — with sharp moves both up and down before and after the announcement.
If you’re planning to trade this event, manage your stop loss carefully and avoid overexposure.
Disclaimer:
This content is for informational purposes only and does not constitute financial or investment advice. © DIBAPRISM
Amir D.Kohn
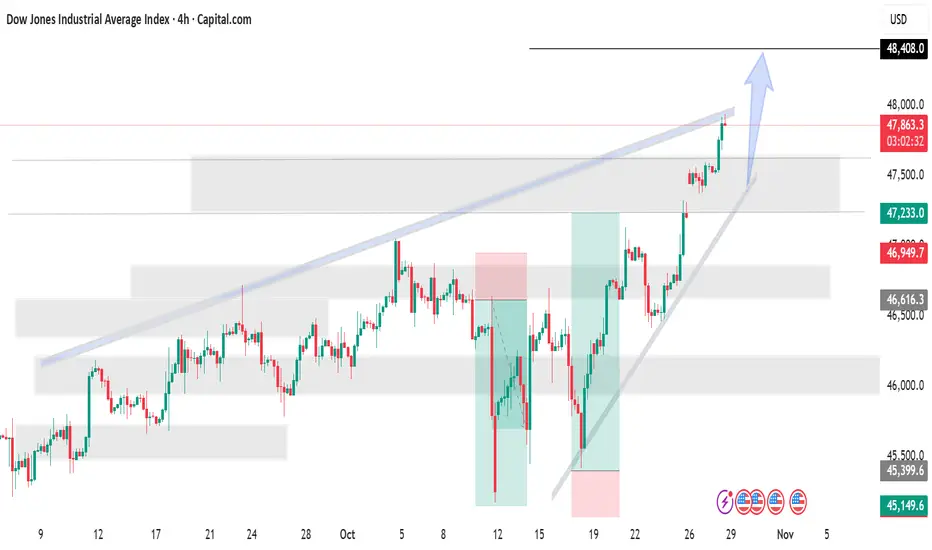
US30 ForecastThe Dow Jones Industrial Average Index is showing strong bullish momentum breaking above the ascending channel resistance. Price is holding above the 47,800 support zone and aiming toward the next key resistance near 48,400. The clear uptrend structure and breakout projection suggest further upside continuation, with buyers maintaining firm control.
"Thank you for your support! If you found this idea valuable or learned something new, please consider liking and leaving a comment. I’d really appreciate hearing your feedback and thoughts."
USNAS100 ForecastThe US100 chart shows strong bullish momentum, breaking above key resistance levels. Price is expected to retrace slightly toward the 25,750–25,500 support zone before resuming its upward move toward the 26,400–26,500 target area. Overall trend remains bullish with higher highs and higher lows formation.
"Thank you for your support! If you found this idea valuable or learned something new, please consider liking and leaving a comment. I’d really appreciate hearing your feedback and thoughts."

Gold A waiting for rebound raising hopes for a potential tradeGold prices regained some lost ground on Tuesday after breaking below the key 4,000 support level. Following a sharp 32% decline in the previous session, the market is showing signs of stabilization. The rebound was supported by encouraging progress in U.S.–China trade negotiations, as both countries agreed to withdraw threats of 100% tariffs. Additionally, optimism has increased ahead of Thursday’s meeting between U.S. President Donald Trump and Chinese President Xi Jinping, raising hopes for a potential trade deal.
Technical Outlook:
From a technical perspective, the recent decline suggests that gold prices may retest the 3,925 / 3,900 support zone. It’s important to monitor this area closely — a clear break below could open the door for deeper downside movement. On the upside, if the bulls manage to reclaim and hold above 4,050, the market could see a short-term recovery toward the 3,985 / resistance area.
You may find more details in the chart.
Trade wisely best of Luck Buddies.
Ps; Support with like and comments for better analysis Thanks for Supporting.
