NOT GOOD TO HOLD SELLStime to close sell if you are still holding it, maybe a last sell entry after 12 p.m UTC
Support and Resistance

BNB Analysis (12H)As you can see, the Binance Coin structure has turned bearish, but we should not forget that the BNB support zone is not far away.
In the demand zone, we can look for buy/long positions.
The targets are marked on the chart.
A daily candle closing below the invalidation level will invalidate this analysis.
Do not enter the position without capital management and stop setting
Comment if you have any questions
thank you

BNB has cleared an important resistance level (12H)We have a shift in outlook for BNB.
Price has cleared a key supply zone, and now we can look for potential buy/long positions around the demand area.
The targets are marked on the chart.
A daily candle closing below the invalidation level would invalidate this analysis.
Do not enter the position without capital management and stop setting
Comment if you have any questions
thank you

GBPUSD Potential UpsidesHey Traders, in tomorrow's trading session we are monitoring GBPUSD for a buying opportunity around 1.32000 zone, GBPUSD is trading in an uptrend and currently is in a correction phase in which it is approaching the trend at 1.32000 support and resistance area.
Trade safe, Joe.

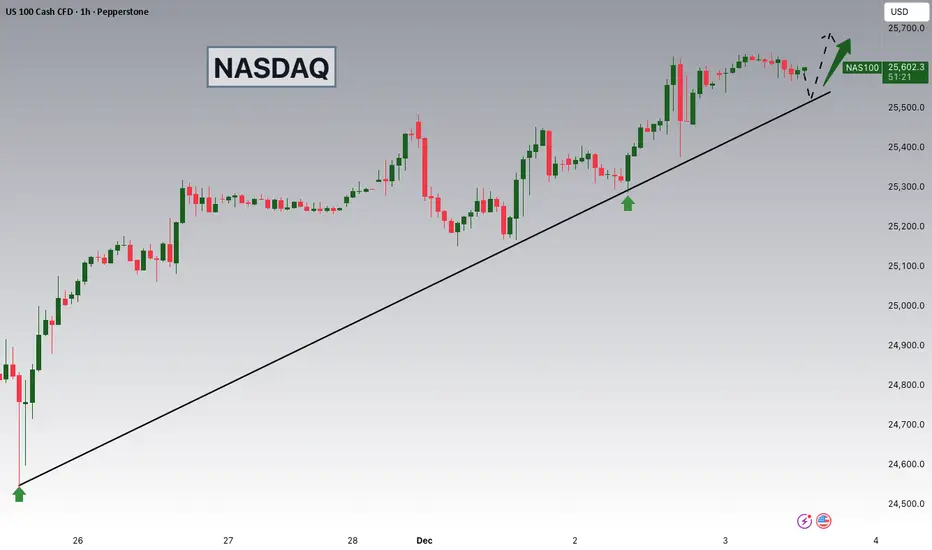
NASDAQ Potential UpsidesHey Traders, in today's trading session we are monitoring NAS100 for a buying opportunity around 25,520 zone, NASDAQ is trading in an uptrend and currently is in a correction phase in which it is approaching the trend at 25,520 support and resistance area.
Trade safe, Joe.
XAUUSD scalp long positionOANDA:XAUUSD After reaching the green zone and by seeing a reversal pattern im 1m timeframe as confirmation, I'll open a long scalp position.

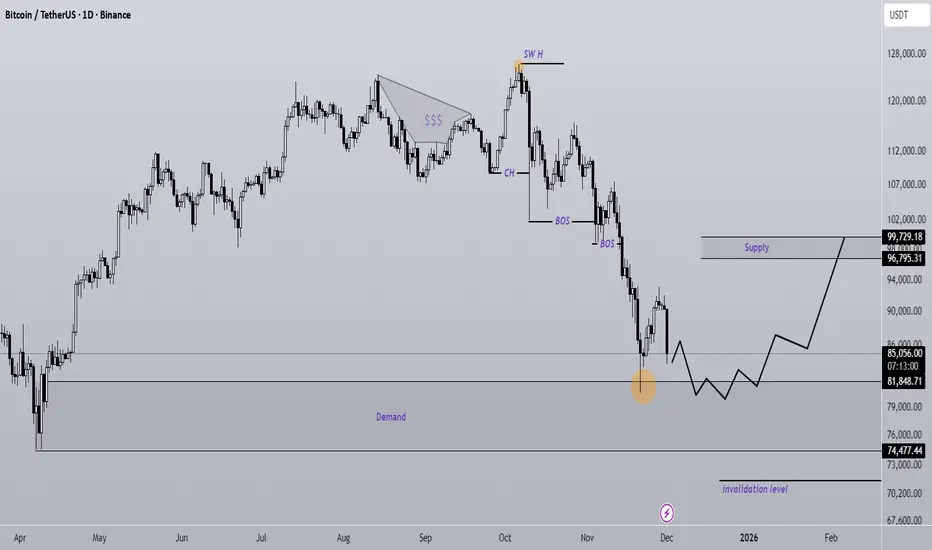
Bitcoin new update (1D)Bitcoin has not yet fully absorbed the buy orders in the marked support zone. This time, upon tapping the support area again, we can expect the price to form a stronger bullish move, at least toward the identified supply zone.
A daily candle closing below the invalidation level will invalidate this outlook.
Do not enter the position without capital management and stop setting
Comment if you have any questions
thank you
BankNifty levels - Dec 05, 2025Utilizing the support and resistance levels of BankNifty, along with the 5-minute timeframe candlesticks and VWAP, can enhance the precision of trade entries and exits on or near these levels. It is crucial to recognize that these levels are not static, and they undergo alterations as market dynamics evolve.
The dashed lines on the chart indicate the reaction levels, serving as additional points of significance. Furthermore, take note of the response at the levels of the High, Low, and Close values from the day prior.
We trust that this information proves valuable to you.
* If you found the idea appealing, kindly tap the Boost icon located below the chart. We encourage you to share your thoughts and comments regarding it.
Wishing you successful trading endeavors!

Nifty levels - Dec 05, 2025Nifty support and resistance levels are valuable tools for making informed trading decisions, specifically when combined with the analysis of 5-minute timeframe candlesticks and VWAP. By closely monitoring these levels and observing the price movements within this timeframe, traders can enhance the accuracy of their entry and exit points. It is important to bear in mind that support and resistance levels are not fixed, and they can change over time as market conditions evolve.
The dashed lines on the chart indicate the reaction levels, serving as additional points of significance to consider. Furthermore, take note of the response at the levels of the High, Low, and Close values from the day prior.
We hope you find this information beneficial in your trading endeavors.
* If you found the idea appealing, kindly tap the Boost icon located below the chart. We encourage you to share your thoughts and comments regarding it.
Wishing you success in your trading activities!

XAUUSD possible buy setupHere we faced a beautiful CHOCH, hunting the liquidity zone and mitigating a valid order block creating a possible long position which is following my previous idea:
*** But we have to consider that the price is below the daily low (purple line) and the volume is not yet powerful to break the descending structure.
So I'll think about the long position only after the breakout of the purple line . Otherwise the price is going to hunt the liquidity around 4,110 if it continues with a powerful descending momentum.
Good luck🤞

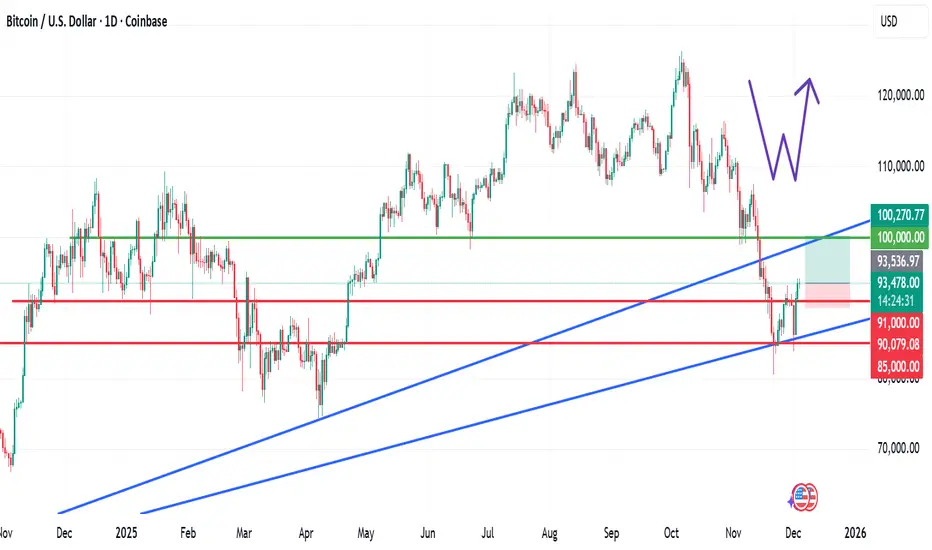
Bitcoin and the Double Bottom Reversal PatternBitcoin and the Double Bottom Reversal Pattern: Is This a Key Turning Point?
Following the previously outlined technical levels that played out successfully, Bitcoin has now formed a double bottom (W) reversal pattern, a widely recognised signal in technical analysis indicating potential bullish momentum.
Price action has also broken above the $91,000 level, which previously served as resistance and aligns with the neckline of the pattern.
A sustained hold above this zone may confirm the reversal structure and support further upside movement.
If the $91,000 support level remains intact, the next logical target based on pattern projection is the $100,000 zone and potentially beyond, depending on market sentiment and volume continuation.
Trade Plan
Entry 1: Current market price (aggressive positioning)
Entry 2: $92,000
Take Profit: $100,000 and above
Stop Loss: $89,900
Ensure your risk management remains balanced and aligned with your strategy.
If you found this analysis useful, feel free to like, share, and drop a comment below.
I am looking forward to engaging with you here on TradingView.
Silver – Can the Break to Record Highs Be Maintained?Silver’s impressive upside run so far this week, which has seen it trade from a low of 56.165 on Monday to register a new record high at 58.96 yesterday, seems to be taking a pause in early trading on Thursday morning, with the price currently trading down around 1.8% at 57.44 at time of writing (0700 GMT).
With liquidity in the Silver market nowhere near as deep as in its bigger parent Gold, these types of exaggerated moves can happen more frequently, especially when trading at new extremes such as the record high that was reached a mere 24 hours ago. Where Silver moves next into the weekend may be determined by a combination of factors, such as positioning, performance of the US dollar and technical factors.
From a positioning standpoint, the debasement trade which has been underpinning much of Silver’s rally over the last 3-6 months still remains in place but can at times be subject to pullbacks as the trade can get crowded and this may be part of the reason for the drop this morning. There could be potential for further profit taking into Friday’s close, especially with the pivotal Federal Reserve interest rate decision now less 7 days away (December 10th).
From the US dollar point of view, as mentioned above, with the Fed rate decision now around the corner, traders may be more sensitive to the release of any available US labour market data. Today’s scheduled release of the Challenger Job Cuts at 1230 GMT and Weekly Jobless Claims at 1330 GMT could lead to further US dollar volatility, which may impact Silver prices. As a general rule a higher dollar makes Silver more expensive for foreign investors and vice versa.
Finally, interlinked with these two drivers are the technicals. Whether key support or resistance levels hold or a broken on a closing basis could lead to bigger directional moves into the weekend or early next week. So being apprised of these levels in advance can be prudent from a risk management approach.
Technical Update: Can New All-Time Highs Maintain The Push Higher?
Silver has enjoyed a positive late‑November to early‑December period, advancing more than 21% from the November 21st low of 48.62 to Wednesday’s 58.96 high. This move has produced new all‑time highs, with fresh upside acceleration following the closing break above the previous 54.45 October 17th record high.
While it might be argued that this type of price activity remains constructive with the potential for further gains, some traders may view the latest upside moves as becoming over‑extended, raising the risk of future price weakness.
In this environment, staying aware of relevant support and resistance levels may prove valuable in gauging Silver’s next directional themes.
Possible Resistance Levels: .
New all‑time highs place price activity into uncharted territory, making it difficult to establish valid resistance levels. In such cases, Fibonacci extensions can provide valuable guidance, highlighting potential areas where fresh selling pressure may emerge once more.
For Silver, Fibonacci extension calculations based on the last significant correction seen between October 17th and October 28th suggest that current price strength may be approaching a potential resistance at 59.79, which is the 61.8% extension level.
A closing break above 59.79 might now be required to open scope for a push to higher levels like the 100% extension level which sits at 63.15.
Possible Support Levels:
It is often difficult to determine with certainty when upside conditions have become over‑extended and of course this alone doesn’t guarantee price weakness. As such, closing breaks below support may be required to trigger a corrective phase in price. In the case of Silver, traders may view Monday’s session low of 56.16 as the first support.
Closing breaks below the 56.16 level, if seen, could reinforce the possibility of over‑extended upside conditions leading to continued price weakness. Such moves could open the way for tests of 54.95, which is the 38.2% Fibonacci retracement, and possibly even extend toward 53.75, the deeper 50% retracement level.
The material provided here has not been prepared accordance with legal requirements designed to promote the independence of investment research and as such is considered to be a marketing communication. Whilst it is not subject to any prohibition on dealing ahead of the dissemination of investment research, we will not seek to take any advantage before providing it to our clients.
Pepperstone doesn’t represent that the material provided here is accurate, current or complete, and therefore shouldn’t be relied upon as such. The information, whether from a third party or not, isn’t to be considered as a recommendation; or an offer to buy or sell; or the solicitation of an offer to buy or sell any security, financial product or instrument; or to participate in any particular trading strategy. It does not take into account readers’ financial situation or investment objectives. We advise any readers of this content to seek their own advice. Without the approval of Pepperstone, reproduction or redistribution of this information isn’t permitted.

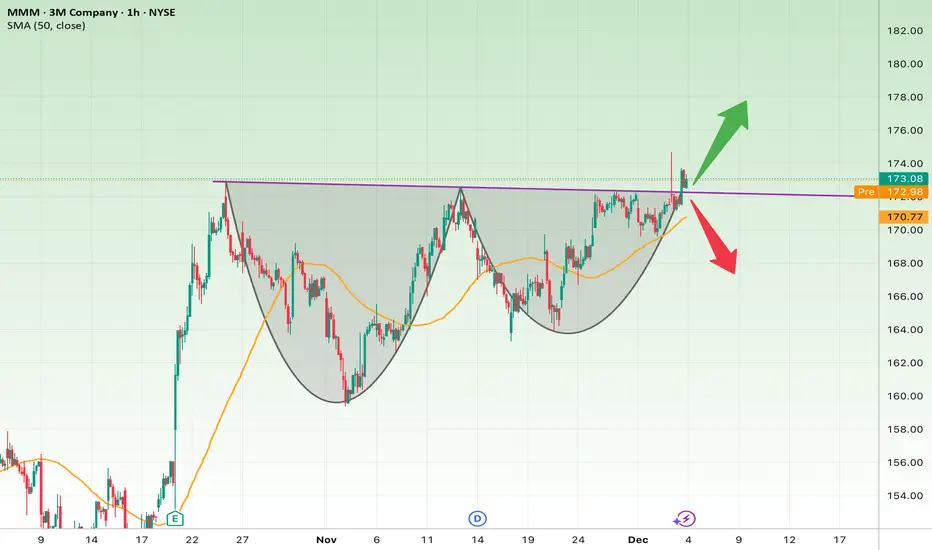
3M Breaks a Major Resistance — Cup & Handle Pattern Activation1. Technical Analysis
MMM has formed a textbook Cup & Handle structure on the 1h timeframe:
• Well-rounded cup
• Shallow handle correction
• Multiple touches of the 172.8–173.2 resistance
• A strong breakout candle
• A clean retest of the breakout zone
The 50-period SMA provides dynamic support, confirming upward momentum.
This pattern often signals a continuation rally toward higher highs.
2. Bullish Scenario
If the breakout holds:
🎯 Upside Targets
• Target 1: 176
• Target 2: 178.5
• Target 3: 181.8 (Cup & Handle measured move)
• Long-Term Target: 186.5
3. Bearish Scenario
Bearish momentum activates if price fails to confirm above 173.
Supports:
• 170.70
• 168.50
• 166 (invalidates the pattern)
4. Stop-Loss Levels
• Short-Term SL: below 170.70
• Mid-Term SL: below 168.50
• Classic Pattern SL: below 166
5. Fundamental Snapshot
Strengths:
• Stable cash flow
• Recovery in industrial demand
• Better cost management
Risks:
• High debt
• Economic sensitivity
• Legal exposure
Final Summary
The Cup & Handle pattern is active, and MMM is currently retesting the breakout.
Above 170.70, the bullish outlook remains dominant.
EURGBP 1HA structured approach to market analysis combining Fibonacci retracement levels with key Support & Resistance zones.
Price action is monitored to identify reaction points, liquidity zones, and potential reversal or continuation setups.
The analysis focuses on high-probability confluence areas where Fibonacci ratios align with historical structure levels, helping traders spot optimal entry points, stop-loss zones, and profit-taking targets.

XAUUSD KEY LEVELS 04-11Greetings
Hi traders, This is the crucial support zone for XAU-USD at 15 minute,
based on the movement of the day prior and market trends.
Support zone (White line)
Important levels:
4175.09 is the entry
Target: 4185.09
Stop loss: 4165.09
1:1 Risk-Reward Ratio
We are inspired to continue learning and exchanging ideas by your likes and boosts!

USDCAD 1H A structured approach to market analysis combining Fibonacci retracement levels with key Support & Resistance zones.
Price action is monitored to identify reaction points, liquidity zones, and potential reversal or continuation setups.
The analysis focuses on high-probability confluence areas where Fibonacci ratios align with historical structure levels, helping traders spot optimal entry points, stop-loss zones, and profit-taking targets.

Citigroup Breaks Out of a Symmetrical Triangle1. Technical Analysis
Citigroup entered a symmetrical triangle consolidation after a strong bullish rally.
This pattern often acts as a continuation structure, especially after a steep uptrend.
Key technical observations:
• A clean breakout above the triangle
• Strong bullish candle with momentum
• Price maintains support above the 50-day SMA
• Increasing volume confirming the breakout
This suggests the beginning of a new bullish cycle, unless price re-enters the triangle.
2. Bullish Scenario
If the breakout holds:
Upside Targets
• Target 1: 110
• Target 2: 114
• Target 3: 118
• Long-Term Target: 125
Bullish Catalysts
• Valid continuation breakout
• Strong trend structure (HH/HL)
• Sector-wide strength in financial stocks
• Earnings momentum and improving profitability
3. Bearish Scenario
If price falls back inside the triangle:
Supports
• Support 1: 102
• Support 2: 99.80
• Support 3: 96
Bearish Triggers
• Breakdown under 102
• Failed breakout
• Broad market risk-off conditions
• Rising credit defaults
4. Suggested Stop-Loss
Short-Term Traders
• SL: Below 102
Mid-Term Traders
• SL: Below 99.80
5. Fundamental Snapshot
Strengths:
• Cost reduction and margin improvement
• Earnings beats
• Strong credit card and commercial banking revenue
Risks:
• Rising consumer default risk
• Regulatory tightening
• U.S. recession risk
Final Summary
Citigroup has executed a strong bullish breakout from its triangle consolidation pattern.
As long as price stays above 102, the bullish trend remains intact with higher targets ahead.
Bias: Bullish
SL (ST): 102
SL (MT): 99.80

XAU/USD: Buy Gold on Support Retest, Bullish StructureGold continues to fluctuate within a compression model + ascending support, indicating that selling pressure is weakening and the market wants to accumulate before bouncing to the upper supply zones.
Recent data shows USD cooling as the market increases expectations that the FED will be more dovish → creating a support base for XAU/USD's short-term rise.
📊 Technical Analysis – H1 Frame (MMF Flow)
1️⃣ Key Support:
4,187 – 4,188: BUY zone + lower trendline + strong price reaction.
Price just retested and bounced → confirming active buying remains.
2️⃣ Near Resistance:
4,211 – 4,212: mid-liquidity zone → expected to create HL before breaking the downtrend line.
3️⃣ Main Target Zone:
4,236 → strong resistance, confluence multiple times from the market.
Further: 4,254 → large supply zone, is an extended target if price breaks out.
🧭 Trading Scenario According to MMF
Main Scenario – BUY with Trend
BUY again when price retests 4,187 – 4,188 or
BUY when price breaks 4,212 then retests.
TP Targets:
TP1: 4,212
TP2: 4,236
TP3: 4,254
SL: below 4,182.
Idea: price creates an absorption model + HL on trendline → potential to pull up to the upper liquidity zones.
Secondary Scenario – SELL Reaction
Only for scalp traders:
SELL reaction at 4,236 – 4,238
TP: 4,212
SL: 4,243
🎯 Daily Bias Summary
Bias: Bullish on H1 when price holds 4,187.
Priority: BUY at the bottom – SELL at the top only for scalp.
Wait for the downtrend line to break to extend the target to 4,254.

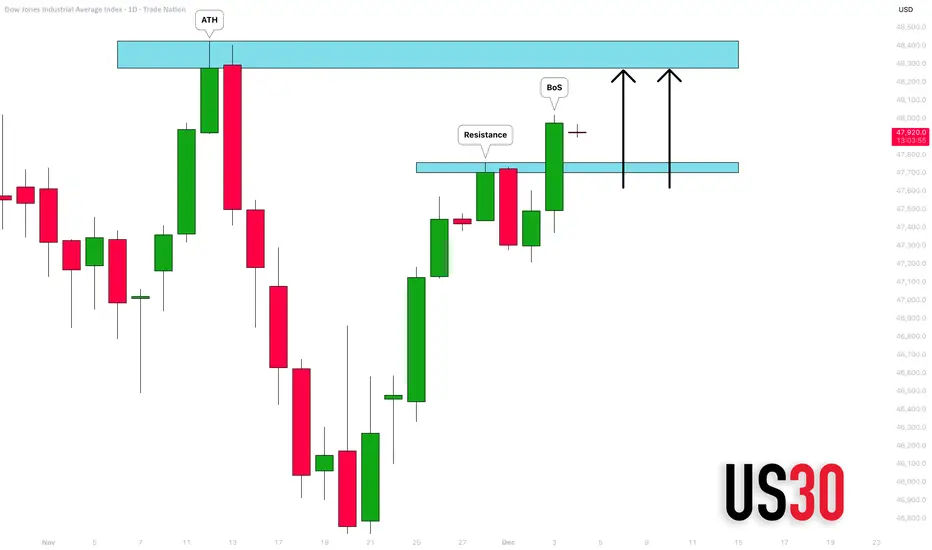
DOW JONES INDEX (US30): Confirmed BoS
With the yesterday's fundamental US news releases and
Trump's speech, US30 bounced strongly.
The market violated a significant daily resistance cluster
and closed above that.
It opens a potential for more growth to a resistance based
on a current All-Time High.
❤️Please, support my work with like, thank you!❤️
I am part of Trade Nation's Influencer program and receive a monthly fee for using their TradingView charts in my analysis.
XAU/USD – Recovery structure testing 4,239 – 4,2611. Market Context
On the M30 timeframe, the previous downtrend has started to weaken. The price has formed a series of Equal Lows patterns, indicating that the short-term bottom is protected, followed by a Change of Character (ChoCH) and a slight Break of Structure (BOS). This reflects that the selling pressure has decreased in intensity and the market is transitioning into an accumulation phase, preparing for a recovery.
The downtrend line is still valid, but the price is approaching the breakout area. Closing candles above this line will confirm a phase transition.
2. Key Price Areas
Upper Supply Zone
4,239 – 4,240: the nearest strong reaction area, acting as the main resistance.
4,261: coincides with the 1.272 Fibonacci of the correction wave, a notable liquidity area.
4,282 – 4,283: expansion target, corresponding to Fibonacci 1.618.
These areas will be points where the market may show counter-reactions during the uptrend.
Lower Demand Zone
4,168 – 4,154: the Demand Zone formed from the previous strong reversal. This is the area where the market effectively absorbed selling pressure and may continue to act as support during corrections.
3. Fibo and Price Action
The current uptrend is following a standard pullback structure: from the 4,168 bottom, the price recovers to Fibonacci levels like 0.236 – 0.382, then forms a small correction before approaching the downtrend line again.
If the price surpasses the trendline, the next targets will be:
4,213 (Fibo 0.618),
then the main supply zone 4,239 – 4,240.
Closing candles above this area will pave the way for the next targets at 4,261 and 4,282.
4. Trading Plan
Buy Scenario – prioritize during correction
Early buy position: 4,188 – 4,195
(retest small structure and trendline)
Optimal buy zone: 4,168 – 4,154
(Demand Zone + deep Fibo correction)
Stop loss: below 4,150
Targets:
4,213
4,239 – 4,240
4,261
expanding to 4,282
Short-term Sell Scalp Scenario
Reaction zone: 4,227 – 4,230
(near resistance + 0.786 Fibo)
Stop loss: 4,236
Target: 4,205 – 4,195
Note: This is only a short-term strategy, not the main trend.
5. Summary
• The market structure is transitioning from a downtrend to an accumulation – recovery phase.
• If the price surpasses and holds above the trendline, the nearest target will be 4,239 – 4,240.
• The supply zones 4,239 – 4,261 – 4,282 will play a decisive role in the next uptrend.
• The most effective trading strategy remains to wait for a buy during corrections to the strong support zone 4,168 – 4,154.

DXY D1: SHORT-TERM SELLS LONG-TERM BUYSDXY is currently forming a classic Wyckoff Accumulation. Price has already broken the most recent Lower High (LH), giving us a clear Change of Character (ChoCH) and signaling a short-term pullback into a demand zone before a potential long-term bullish continuation.
What does this imply?
We can expect GBPUSD and EURUSD to maintain their bullish momentum, while pairs such as USDCAD and USDCHF may experience further downside pressure.

Gold Breakout Confirmed — New Cycle Targets Ahead(ATH Possible)Today, I analyze Gold( OANDA:XAUUSD ) on the 4-hour timeframe, building on the previous idea shared. The scenario remains unchanged.
In this analysis, I take a cyclical approach to gold on the 4-hour chart. It appears that gold is completing three similar cycles. For the third cycle to be completed, gold needs to increase.
Another point is that gold previously formed a bull trap when it tested the Resistance zone/Support zone($4,186– $4,133), but now it has successfully confirmed a breakout above that zone. This suggests that the bull trap is no longer a concern, and gold is likely resuming its uptrend.
Additionally, gold could form a bullish channel, but we currently have only one confirmed top and are waiting for a second top to validate the channel.
Moreover, today we’ll see the release of two important U.S. economic indicators, which can significantly impact gold’s movement, especially if the actual figures deviate significantly from expectations:
ADP Non-Farm Employment Change
ISM Services PMI
Considering all of the above, we can set an initial target of around $4,267 for gold. If the cycle completes fully, gold might even reach a Potential Reversal Zone(PRZ) and possibly set a new All-Time High(ATH).
Finally, geopolitical tensions, like those between the U.S. and Venezuela, often lead to higher gold prices since gold is considered a safe haven.
First Target: $4,267
Second Target: Potential Reversal Zone(PRZ)
Stop Loss(SL): $4,147
💡 Please respect each other's opinions and express agreement or disagreement politely.
📌 Gold Analyze (XAUUSD), 4-hour time frame.
🛑 Always set a Stop Loss(SL) for every position you open.
✅ This is just my idea; I’d love to see your thoughts too!
🔥 If you find it helpful, please BOOST this post and share it with your friends.

EURCAD: Important Breakout 🇪🇺🇨🇦
EURCAD broke and closed above a significant intraday/daily
resistance cluster.
With a high probability, the price will rise more and reach 1.6305 level soon.
❤️Please, support my work with like, thank you!❤️
I am part of Trade Nation's Influencer program and receive a monthly fee for using their TradingView charts in my analysis.
