GOLD → After the pullback, growth may continue. 4250 - 4300?FX:XAUUSD continues to break records, approaching the $4,200 level amid escalating trade tensions and expectations of Fed policy easing. A correction is forming before the possible continuation of growth...
Key growth drivers: Trump is considering a ban on Chinese vegetable oil imports, and the parties are imposing reciprocal port fees. The probability of a Fed rate cut in October and December exceeds 90%, despite Powell's cautious comments. The current correction in gold is seen as a buying opportunity.
Growth to $4250+ will continue if trade tensions persist and the Fed maintains its dovish rhetoric.
Resistance levels: 4200, 4218, 4250
Support levels: 4179, 4166, 4155
A pullback is forming. A false breakdown of the specified support zone could support further growth, provided that the bulls hold their defense above the specified levels. The market remains bullish and aggressive, and there are currently no technical or fundamental reasons for a deep correction
Sincerely, R. Linda!
Support and Resistance

Is a visit to $100k about to print for Bitcoin? - October 15thUp’October is widely expected, myself included. Statistically speaking the 2nd October post Halving is a strong green month. All the influencers are talking about it. That was until the largest forced liquidation event in the history of the asset class wiped out $19billion. What a number. One man, one tweet = mass panic.
The liquidations cascaded one after the other sending a number of alternative tokens all the way to near zero before quickly recovering. Confidence in the Ponzi scheme has taken quite a hit. In fairness market participants must accept some blame, 80% of the money entering the space was on leverage products with the small remainder into spot positions. In summary the liquidity in the spot market is near non existent. No one is touching it, which was first identified in the " Is alt season dead? " idea.
The technical analysis
Price action follows an upward trending channel on the above 4 day chart. Price action has recently rejected the medium line and confirmed it as resistance for the 3rd time. Look left, previous events sent price action to the lower side of the channel. Is this time different?
“Strong” and “weak”, notice the labels here? When price action tests the Gaussian channel (uptrend or downtrend) it is expected to bounce strongly as a confirmation of the current momentum behind the trend.
The test at this moment is a 4 day candle that prints today, the reaction to the channel has been anything but strength, it is complete weakness. This is what happens when interest in the asset is sub-zero, buyers are nowhere to be seen.
** It is highly likely price action shall test the lower side of the channel should a candle body print inside the channel **
In order words, price action will correct to $92k should it drop in a straight line. Looking left a period of up to 30 days is likely to follow before a test. The channel is rising and price action would likely be around $102k by mid-November.
** This will be the reddest October ever! **
$102k, a line in the sand
Price action at this level cannot fail support as shown on the above 4 day chart. Broken market structure would be confirmed should a candle body close under this level. That would mean Bitcoin entered a bear market and trend reversal.
Conclusions
Bitcoin has now reached a point in the structure where the reaction must be strong, but it isn’t. The rejection from the channel midline for the third time and the subsequent weak Gaussian test are not the signs of a healthy uptrend.
If price action fails to hold, it risks closing a 4-day candle body inside the Gaussian channel, a condition that historically precedes a move to the lower boundary. Based on the current slope, that lower test aligns near $92,000 tomorrow and $102k by mid-November.
There’s still room for recovery, but it must happen immediately. The longer Bitcoin trades near channel support with low volume, the greater the probability of structural failure.
Should a confirmed close occur below $102k, that would officially mark the first trend reversal since the 2024 post-halving rally, a shift from expansion to contraction. In simple terms, a break below this level transitions Bitcoin from bull to bear.
For now, October’s historical strength remains a statistic, not a guarantee. The market doesn’t care what month it is, only where the liquidity is.
Ww
====================
Disclaimer
This analysis is for educational purposes only and expresses personal opinion, not financial advice. I hold no position in Bitcoin and no vested interest in it.
Cryptocurrency markets are volatile and unpredictable. Always conduct your own analysis, manage your risk carefully, and never trade solely based on another person’s idea.
Patience, confirmation, and risk control, the only things that survive every market cycle.

EUR/AUD: Important Breakout! With a robust bullish rally, 📈EURAUD broke and closed above a key daily resistance cluster yesterday.
The broken structure and an ascending trend line now constitute a significant demand zone.
A bullish continuation is anticipated.
The subsequent resistance level is projected at 1.8075.

NZD/CAD: True Bullish Reversal?! 📈NZDCAD formed an inverted head and shoulders pattern.
The subsequent neckline breakout serves as a strong bullish reversal signal.
The previously broken neckline now serves as a key support level.
Consequently, we anticipate bullish price movement, potentially reaching the 0.8085 resistance level.

AUDUSD Eyes 0.64500 Support as Bullish Structure Holds FirmHey Traders,
In today’s session, we’re closely monitoring AUDUSD for a potential buying opportunity around the 0.64500 zone. The pair continues to trade within a broader uptrend, and the current pullback appears to be a healthy correction toward a key support and resistance confluence near 0.64500.
A sustained reaction from this level could reaffirm the bullish structure, opening the door for a continuation toward recent highs if momentum aligns with a weaker USD backdrop.
Trade safe,
Joe.

Bitcoin at Heavy Supports – Time to Go Long?As I expected in my previous idea , Bitcoin ( BINANCE:BTCUSDT ) completed both its bullish and bearish moves and hit its Long and Short targets .
Bitcoin can still see some upside as long as it holds this Heavy Support zone($111,980-$105,820) . However, given the recent momentum and the wick down to around $102K a few days ago, any further rally depends on breaking the Resistance zone($118,750-$115,730) and touching around $117,220 , which is the high of that significant bearish candle .
Currently, Bitcoin is sitting in a Heavy Support zone($111,980-$105,820) near the 200_SMA(Daily) and a Cumulative Long Liquidation($108,415-$107,156) . It's basically hovering between key weekly support lines, so this is a pretty strong supports .
In terms of Elliott Wave theory , it looks like Bitcoin is still completing its wave 4 . This wave 4 might have formed a Double Three Correction(WXY) , and now we can expect a potential upward move .
I expect that in the next few hours, Bitcoin may start a short-term bullish move up to around $115,000 or to the Cumulative Short Liquidation Leverage($114,973-$113,435) .
Note: Overall, it's better to look for Long positions right now, considering Bitcoin's position. But if it breaks the 200_SMA(Daily) and the Heavy Support zone($111,980-$105,820), we could see a broader crypto market drop.
Note: Around the $108,000 level, we have huge buy orders stacked up, which might act as a significant support zone.
Please respect each other's ideas and express them politely if you agree or disagree.
Bitcoin Analysis (BTCUSDT), 4-hour time frame.
Be sure to follow the updated ideas.
Do not forget to put a Stop loss for your positions (For every position you want to open).
Please follow your strategy and updates; this is just my Idea, and I will gladly see your ideas in this post.
Please do not forget the ✅' like '✅ button 🙏😊 & Share it with your friends; thanks, and Trade safe.

GOLD → The aggressive trend continues. Focus on 4240FX:XAUUSD continues to break records, testing the $4,240 level amid a weakening dollar and sustained demand for safe-haven assets. The risks of a correction are growing as economic news releases approach.
Key supporting factors: Statements by US officials about China's “seizure of supply chains” and retaliatory measures are keeping markets on edge. US shutdown: The government shutdown is costing the economy $15 billion a week, increasing uncertainty. The probability of a rate cut in October and December is ~95%, which is putting pressure on the dollar. However, statements by Fed officials may adjust market expectations.
The bullish trend for gold remains unchanged. Any corrections will be seen as a buying opportunity. Key benchmarks are the development of the trade conflict and negotiations on the resumption of the US government.
Support levels: 4212, 4203
Resistance levels: 4234, 4235, 4250
Within the uptrend, it is worth waiting for a correction to support in order to open positions more profitably. There are no reasons for a trend reversal, and the fundamental background is bullish. We expect a retest of support before growth. However, a breakout of the 4234-4239 zone could trigger further growth!
Best regards, R. Linda!

THE KOG REPORT - UpdateEnd of day update from us here at KOG:
Hmm, a decent day and a frustrating end of the day! We managed to complete our Excalibur targets on gold hitting 4 in a row and then started this range and witnessed a 400pip candle. We decided earlier we're not going to attempt any longs up here now unless we see price settle into a range. So for now, we're not going to give a path, instead, we'll give the two levels of interest to look for during the sessions to come.
If we continue to hold 4180 it's likely we will engulf upside, but that 4230 is sticking out at the moment!
As always, trade safe.
KOG

Gold Have Chance to Growth a New zone 4225 to 4260 ?Gold prices surged to new all-time highs today, breaking above the $4,200 resistance before retracing slightly toward support. As seen before, the pullback attracted fresh buying interest, suggesting that bullish momentum remains intact.
Market sentiment continues to be supported by rising trade tensions — reports indicate that Trump is considering a ban on Chinese vegetable oil imports, while China is said to be preparing reciprocal port fees. These developments have increased safe-haven demand for gold.
Additionally, with the Federal Reserve maintaining its dovish stance, the overall macro backdrop remains supportive for further upside in gold prices.
A false breakout pattern appears to be forming, indicating a potential technical pullback before the next leg higher. The broader trend remains bullish, with no strong fundamental reasons for a deep correction at this stage. so from the current situation we could expect next target zone would be 4225 to 4260,
You may find more details in the chart.
Trade wisely best of Luck Buddies,
Ps; Support with like and comments for better analysis Thanks for Supporting.

DeGRAM | GOLD formed a bullish takeover📊 Technical Analysis
● XAU/USD shows a bullish takeover after rebounding from the support line near 4,219, confirming buyers’ control in the short-term structure.
● Price is now trading within an ascending channel, aiming toward the 4,240–4,250 resistance area, with intraday pullbacks likely forming higher lows.
💡 Fundamental Analysis
● Gold gains support from softer U.S. yields and cautious Fed remarks, improving sentiment for safe-haven assets.
✨ Summary
● Long bias above 4,219; objectives 4,240–4,250. Strong bullish candle and favorable macro backdrop confirm short-term upward momentum.
-------------------
Share your opinion in the comments and support the idea with a like. Thanks for your support!

GBPUSD Shooting Star Near Resistance Lines – Short Opportunity?Today, I want to share a potential Short opportunity on the GBPUSD ( FX:GBPUSD ) pair.
GBPUSD , as I expected in my previous idea , reached its target .
At the moment, GBPUSD has broken through a Support zone($1.340-$1.333) , but overall it is still moving within a Heavy Support zone($1.343-$1.313) and is near Resistance lines .
From a candlestick pattern perspective , it looks like GBPUSD is forming a Shooting Star near these Resistance lines .( To confirm the Shooting Star pattern, we need to wait until the end of the last 4-hour candle)
In terms of Elliott Wave theory , it seems that GBPUSD has completed wave 4 , and we should be looking for the start of wave 5 soon .
I expect GBPUSD in the coming hours to at least retest the 200_EMA(Daily) . If that breaks, the next target would be the Support lines , and if those support lines break, we could even see a move down to the Heavy Support zone($1.343-$1.313) .
Stop Loss(SL): 1.3412 USD
Please respect each other's ideas and express them politely if you agree or disagree.
British Pound / U.S Dollar Analysis (GBPUSD), 4-hour time frame.
Be sure to follow the updated ideas.
Do not forget to put a Stop loss for your positions (For every position you want to open).
Please follow your strategy and updates; this is just my Idea, and I will gladly see your ideas in this post.
Please do not forget the ✅' like '✅ button 🙏😊 & Share it with your friends; thanks, and Trade safe.

THE KOG REPORT - UpdateEnd of day update from us here at KOG:
Bullish day's are nothing new lately on gold and today believe it or not, was another one! We had the higher oval as a potential target which was completed, then the red boxes with the break above 4240 which consequently led to all the targets being completed again!
Now, just like yesterday, the same plan. Unless we get a deep pull back, not interested in going long up here unless they're quick scalps level to level. Otherwise, the oval again, potential region to watch for an attack!
Price: 4229
RED BOXES:
Break above 4240 for 4250✅, 4255✅ and 4265✅ in extension of the move
Break below 4220 for 4210, 4203 and 4190 in extension of the move
As always, trade safe.
KOG

EUR/USD: Bearish Pullback to 1.156?FX:EURUSD is flashing bearish signals on the 4-hour chart , where price is testing a downward trendline with successive lower highs, signaling continued weakness in the pair. The good entry point aligns near the EMA 200 (acting as dynamic resistance) and a key resistance zone, setting up for a potential downside continuation if sellers step in. 🎯
Entry zone between 1.167-1.169 for a short position. Target at 1.156 near the support zone for solid risk-reward. 📊 Set a stop loss on a close above 1.1725 to protect against upside breaks. 🌟 Look for confirmation on a break below the entry with increasing volume, amid ongoing USD strength against the EUR.
On the fundamental front , today—Wednesday, October 15, 2025,today's Eurozone Industrial Production data stands out as a key event for EUR, while speeches from several Federal Reserve members could influence USD movements. 💡
📝 Trade Plan:
✅ Entry Zone: 1.167 – 1.169 (short setup near resistance & EMA 200)
❌ Stop Loss: Close above 1.1725
🎯 Target: 1.156 (major support & take-profit zone)
What's your outlook on this setup? Drop your thoughts below! 👇

USDJPY → False breakout? Target - gap?FX:USDJPY faces trend resistance during its rally and enters a correction. A retest of the range boundary is forming, the breakdown of which may trigger a sell-off.
The currency pair's growth, linked to the news, is slowing down. The price is testing the range boundary as part of a pullback, and the bullish reaction is weakening. Wednesday's daily candle closed below 151.23, which generally indicates buyer uncertainty.
Accordingly, there is a struggle for the 150.85 - 151.23 area, and the price closing below the key support zone will bring the price into the range. This, in turn, may provoke the closure of the gap (149.0 - 147.55).
Resistance levels: 151.23, 151.73
Support levels: 150.85, 149.93, 149.0
A false breakout and consolidation in the selling zone is a fairly strong signal that indicates the strength of the seller. A decline in the dollar index may trigger a decline in the price of the currency pair.
Best regards, R. Linda!

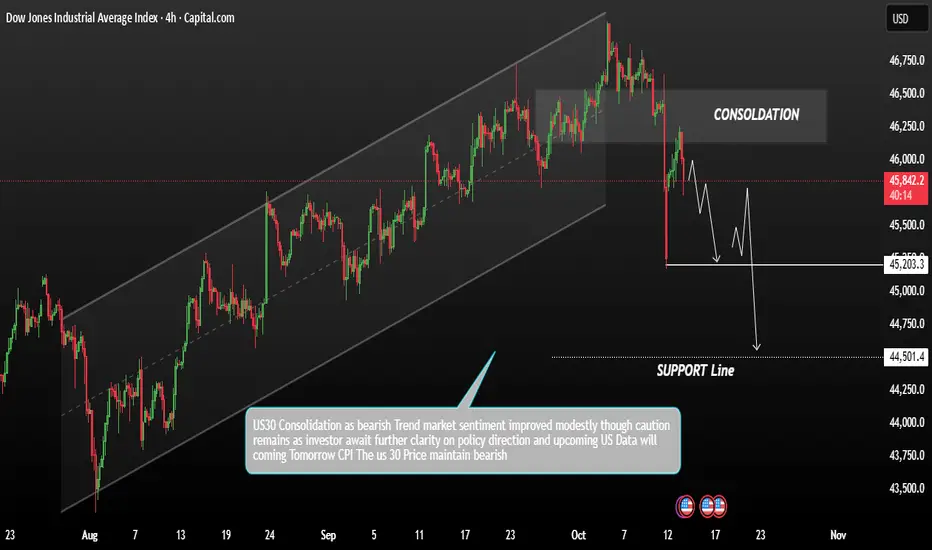
US30 remains in a broader bearish trendThe US30 futures advanced on Monday, recovering from Friday’s pullback as investors shifted back into risk assets following reports of a softer stance from former President Trump on China. This improved sentiment led to short-term buying across U.S. equity futures.
Technical Analysis
Technically, the US30 remains in a broader bearish trend, with the recent bounce seen as a potential pullback toward resistance As long as price holds below key resistance levels, the bias remains bearish, and a reversal to the downside is likely.
Resistance zone: 46,000 – 46,300
Support levels: 45,200 → 44,500
A rejection from resistance could confirm continuation of the downtrend, targeting the support zones mentioned above. However, a break and close above 46,300 would invalidate the bearish structure and open the way for further upside momentum.
You may find more details in the chart.
Trade wisely best of Luck.
Ps; Support with like and comments for better analysis Thanks for Supporting.
$1k to $1million with this tiny market cap? - October 2025 As everyone falls off their chair at the prospect of $14k Ethereum.. a messily 220% return (who in crypto gets out of bed for that?), you’ve got to wonder, what percentage of us would lift the bed sheets for Ethereum at $1 as if it were December 2015?
As it turns out, very few.
When I first purchased ADA , MATIC (ideas linked) at 3 and 2 cents, respectively, few were interested. And more recently with XCN . Each of those had a market cap similar in size to the chart above.
Back in those days my specific problem was not finding those opportunities, it was holding onto them. Discovery of a 100x, 500x, or even a 1000x opportunity is not a challenge. Holding on to it is. The up and coming recession, bear market and expected collapse in equities, all of those things are irrelevant when long exposure is taken from such an early stage.
The project is XDB Chain
What’s so special about this low volume nano cap? There’s Fundamentals and Technical analysis.
The XDB chain project is a fork based off the proven Stellar lumens protocol, as it was XRP before it. The project has adopted the core features and capabilities of the latest Stellar network (v19), including the token certification service and on-chain trading (DEX). In their words:
“The platform was created to support the fast and affordable transfer of consumer digital assets such as branded currencies"
There’s plenty of recent rumour etc on social media circles, will let you do your own research.
On the technical analysis
The above weekly chart makes for an interesting study, during the month of November 2024 a development not seen since April 2022 (blue circles) prints. Price enters the Gaussian channel. It was not until this month, October 2025, did the channel change from red to green. This is important. When the colour flips from red to green, it signals that the slope of the Gaussian average has turned positive, or price has crossed above the central line of the Gaussian channel. This is interpreted as an uptrend signal, momentum has shifted from bearish to bullish.
Latterly a 2 year consolidation period now prints an RSI resistance breakout. The first and second resistances are shown at 60x (6000%) and 130x (130,000%).
Conclusions
The chart above represents one of those rare conditions that technical traders wait years to see. A 2 year consolidation, a Gaussian band colour flip, and an RSI breakout from multi-year resistance, these are not everyday occurrences.
Does this guarantee performance? Absolutely not. But when historical patterns align this cleanly, the potential reward to risk ratio becomes exceptional.
If momentum continues and support holds, the projections point toward 60x and 130x levels, equivalent to 6,000% and 130,000% returns respectively. Those numbers sound absurd until you remember: ADA, MATIC, and XCN once sat in similar structures, with low volume, and largely ignored by the market.
Still, as always, holding is the hardest part. A setup like this requires conviction, patience, and most of all, discipline to avoid overexposure.
$1,000 to $1 million sounds incredible, but markets rarely reward impatience. A bullish bias is only valid while structure confirms. Lose that confirmation, and the opportunity resets.
For now, the data speaks for itself:
Gaussian flip (October 2025) : momentum turns bullish
RSI breakout: first in over two years
Price structure: higher low + band confirmation
Is it possible price action continues correcting? For sure, nothing is certain.
Is it probable? No.
Ww
========================
Disclaimer
This analysis is for **educational purposes only** and reflects my personal opinion, not financial advice. Cryptocurrency markets are speculative and volatile; prices can fluctuate rapidly and may result in total loss of capital. Always conduct your own due diligence, understand your risk tolerance, and never trade based on a single analysis or forecast.
Previous low cap ideas:
ADA @ 3 cents in December 2018, 9000% or 90x
MATIC or Polygon @ 2 cents, 13000% or 130x
XCN @ 0.00077 cents, 6600% or 66x

XAU/USD: Consolidating Above Breakout Zone with Bullish MomentumXAU/USD maintains its bullish structure inside the ascending channel, forming a new A-B-C pattern following a clean breakout above the compression zone. Price is currently consolidating above the 4200 level, establishing a potential base for the next impulsive leg.
A sustained move above 4200 could open the way for a rally toward 4290, retesting the resistance zone. With higher highs and channel integrity in place, momentum remains strong, supporting the continuation of the broader uptrend.

#EURAUD: Two Swing Bullish Entry Worth Thousands Pips! EURAUD is currently at a critical level, and the price isn’t yet decided for the next move. However, the current price behaviour suggests strong bullish volume presence in the market. There are two areas to buy from. The first is activated, and we think price could just be starting the next bull run from this point. The second entry is a safe point if price does decide to drop further and fill up the daily Fair Value Gap.
We wish you the best in trading.
If you want to support us, you can do the following:
- Like the idea
- Comment on the idea
- Share the idea
If you have any questions or concerns about the analysis or trading in general, please let us know in the comment box.
Team Setupsfx_
❤️🚀

Gold Eyes 4,200 as Pullback Near 4,070 Sets Stage for Next BreakHey Traders,
In today’s session, we’re monitoring XAUUSD for a buying opportunity around the 4,070 zone. Gold remains in a strong uptrend, and after setting a fresh all-time high, price is now pulling back toward key trend support.
This area has been acting as a critical demand zone, and a bullish reaction here could trigger the next leg higher — potentially toward the 4,200 mark.
With safe-haven demand still elevated and DXY under pressure, the broader context continues to favor further upside in Gold.
Trade safe,
Joe.

GOLD → Correction to 4090. What could this mean?FX:XAUUSD , after updating its high to 4180, formed a correction and descended to the support zone of 4090, forming an intermediate bottom. We have a trading range...
Key drivers: China has introduced controls on rare earth metal exports, and the parties are holding consultations. A meeting between Trump and Xi Jinping is scheduled for the end of October.
Expectations of two rate cuts before the end of the year are strengthening gold's position. The ongoing government shutdown is fueling demand for safe-haven assets.
Today, attention is focused on Powell's speech, which could set the tone for the market.
The bullish trend for gold continues. The absence of bearish factors and ongoing macro risks continue to push the price up. Corrections are seen as an opportunity to buy.
Resistance levels: 4150, 4180
Support levels: 4117, 4090, 4059
The price is testing the 4150 liquidity zone, which could trigger a pullback within the range. A retest of support at 4117-4090 could support the market, and a change in imbalance could lead to another rally to 4180 - 4200
Best regards, R. Linda!

SOL — From Panic to PrecisionLast week, we witnessed a sharp, market-wide crash, a chain reaction of liquidations that flushed out overleveraged long positions. While many altcoins saw 60–90% drawdowns, the majors held relatively firm.
Among them, SOL stood out as one of the most technically precise. Price perfectly tapped the 1.1 trend-based Fib extension, in confluence with the yearly level, the 21 monthly SMA and the 0.666 retracement, providing a high probability long setup.
After that bounce, SOL revisited the lows, approaching the yearly level near $170, which remains the key structural support for maintaining bullish momentum. The support zone between $175–$170 aligns with the 21 EMA/SMA on the monthly timeframe, which currently spans $158–$170 → forming a strong macro confluence cluster that’s critical to hold.
From there, price unfolded into a clean 5-wave impulsive structure, topping within a dense resistance zone between $208–$212, reinforced by:
mOpen at $208.68
21 EMA/SMA (Daily TF) between $211–$212
0.618 Fibonacci retracement at $211.43
This area offered the perfect low-risk short entry.
Currently, SOL appears to be forming an ABC corrective pattern, likely targeting a move back into the $190–$185 range to fill imbalances and complete wave C. As another key element, the yearly open at $189.31 sits mid-range between resistance and support → a critical pivot level. That’s the region I’ll be monitoring for long setups.
🔍 Indicators used
DriftLine — Pivot Open Zones → For identifying key yearly/monthly/weekly/daily opens that act as major S/R reference points
Multi Timeframe 8x MA Support Resistance Zones → to identify support and resistance zones such as the monthly 21 EMA/SMA.
➡️ Available for free. You can find it on my profile under “Scripts” and apply it directly to your charts for extra confluence when planning your trades.
_________________________________
💬 If you found this helpful, drop a like and comment!

SOL Ascending Triangle Solana is in an ascending triangle with resistance at $260 and support at $125. Look for $260 resistance to turn to support.

Is Western Digital Still Going North?Western Digital has been riding the AI boom to new highs. Now, after a pullback, some dip buyers may see an opportunity.
The first pattern on today’s chart is the September 22 closing price of $112.41. WDC ripped through that level at the end of last month and stabilized slightly above it on Tuesday. Has old resistance become new support?
Second, the bounce occurred at the rising 21-day exponential moving average (EMA).
Third, the 8-day EMA is above the 21-day EMA. That may confirm it’s in an uptrend.
Finally, stochastics are turning higher after dipping toward (but not reaching) oversold.
TradeStation has, for decades, advanced the trading industry, providing access to stocks, options and futures. If you're born to trade, we could be for you. See our Overview for more.
Past performance, whether actual or indicated by historical tests of strategies, is no guarantee of future performance or success. There is a possibility that you may sustain a loss equal to or greater than your entire investment regardless of which asset class you trade (equities, options or futures); therefore, you should not invest or risk money that you cannot afford to lose. Online trading is not suitable for all investors. View the document titled Characteristics and Risks of Standardized Options at www.TradeStation.com . Before trading any asset class, customers must read the relevant risk disclosure statements on www.TradeStation.com . System access and trade placement and execution may be delayed or fail due to market volatility and volume, quote delays, system and software errors, Internet traffic, outages and other factors.
Securities and futures trading is offered to self-directed customers by TradeStation Securities, Inc., a broker-dealer registered with the Securities and Exchange Commission and a futures commission merchant licensed with the Commodity Futures Trading Commission). TradeStation Securities is a member of the Financial Industry Regulatory Authority, the National Futures Association, and a number of exchanges.
TradeStation Securities, Inc. and TradeStation Technologies, Inc. are each wholly owned subsidiaries of TradeStation Group, Inc., both operating, and providing products and services, under the TradeStation brand and trademark. When applying for, or purchasing, accounts, subscriptions, products and services, it is important that you know which company you will be dealing with. Visit www.TradeStation.com for further important information explaining what this means.
