SPY's Final Wall: The Bearish ThesisRight now, SPY is facing the most significant confluence of resistance trend lines it has seen in years. Think of this as the ultimate ceiling—a multi-layered wall that the bulls have to smash through.
The market's parabolic move has pushed the price to this critical point. But here's the thesis: the combined strength of these converging trend lines is just too much. The buying power is exhausted.
We believe this is a classic rollover setup. Instead of a breakout to new highs, we expect a strong rejection from this level. The price will hit this solid wall of resistance and turn over, leading to a significant pullback.
The current price isn't a simple pause; it's a test of strength that the bulls are likely to fail.
Day Trade/Swing Trade Idea: Short at red arrow and cover at the green arrow
Swingtrading

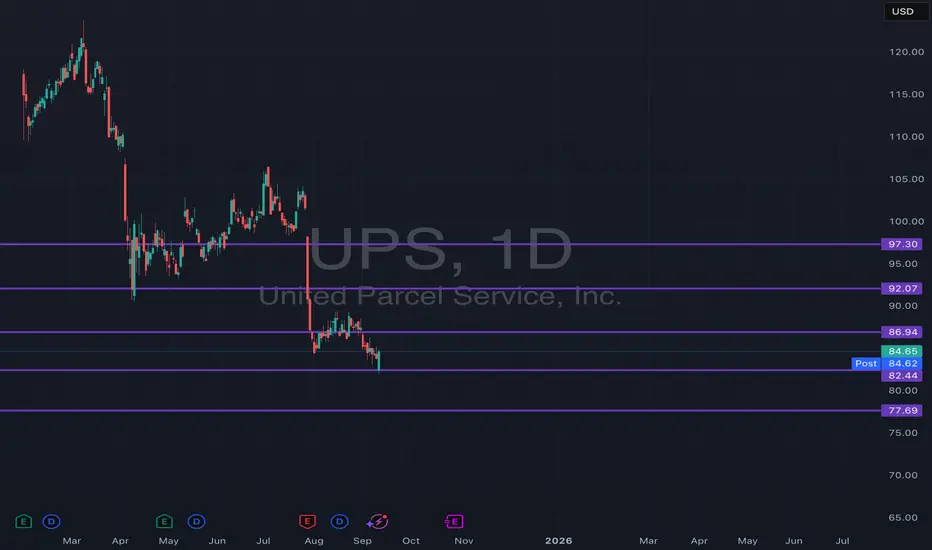
UPS Support & Resistance Lines for September Month 2025This chart highlights September’s monthly support and resistance bands for UPS, built as “guardrails” around the month's price action. The outer bands mark the expected extremes, while the inner (half-step) lines act as intermediate pivot zones where price often pauses, flips, or accelerates. Think of them as a pre-mapped playbook for the month: upper band = supply, lower band = demand, with the midlines guiding targets and risk.
How I trade it
30-minute for 2–3 day swings
Setup: I wait for a 30-min close into a band (upper or lower) plus a clear reaction (wick rejection, momentum fade, or structure break).
Entry: Fade the move back toward the nearest midline when the reaction confirms; or ride a continuation if price accepts above/below a band and retests it from the other side.
Targets: First target is the nearest half-step line, second is the opposite half-step, final is the far band if momentum persists.
Risk: Stop goes just outside the band (for fades) or just back inside the band (for breakouts). If the 30-min closes back through my line, I’m out—no questions asked.
Management: Scale out at each line; move stops to break-even after TP1.
1–3 hour for weekly swings
Bias: I align 1h/2h/3h trend with where price sits relative to the monthly bands. Acceptance above a midline favors continuation to the next line; rejection at a band favors a mean-revert path.
Entry: Use a retest of the broken line on 1–3h candles for confirmation (close-through → retest → resume).
Targets: Next line on the map; let winners run to the next higher-timeframe band if structure holds.
Risk: Stop beyond the reclaimed line; I tighten weekly as soon as we tag the first target zone.
Playbook cues
Rejection at outer band → look for fades back to midline.
Acceptance and hold beyond a band → trade continuation into the next zone.
Stalls at half-step → take partials or tighten stops; these levels often “decide” the next leg.
Use the bands to plan entries, exits, and invalidations before the move. No predictions—just rules around predefined levels for September.
SPX500 - 10% historical gains aheadThe Fed is shifting gears – and history shows what usually follows. Looking back at the past 21 Fed cutting cycles since 1957, the S&P 500 delivered +9.6% average returns within 12 months after the first cut.
This rally wasn’t just luck:
+6.1% from multiple expansion as valuations re-rate higher
+3.5% from earnings growth as financial conditions ease
Technically, the SPX500 has just broken out of consolidation and remains in a strong upward channel. Momentum is aligned with history – positioning the index for another leg higher. 🚀
If history rhymes, we could be looking at double-digit gains over the next year. The risk/reward couldn’t be clearer.
>> The white box shows you what a +10% gain would mean.
👉 Are you positioned for the next Fed-cut bull leg?
Stay safe and happy trading,
Meikel

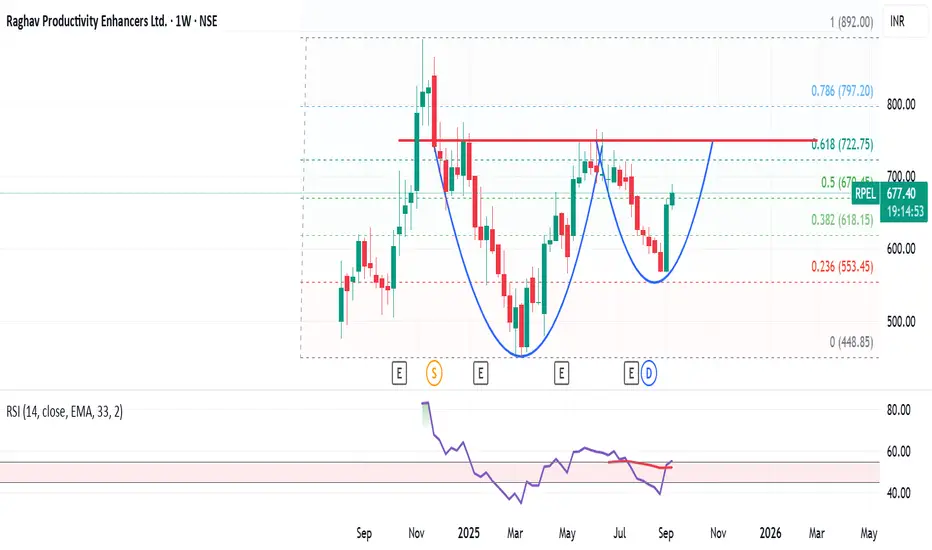
Cup n Handle pattern will work?Let's see if Cup n Handle pattern give some movement to this unknown stock. PE vs ROCE is not good, but technical pattern is showing some promise
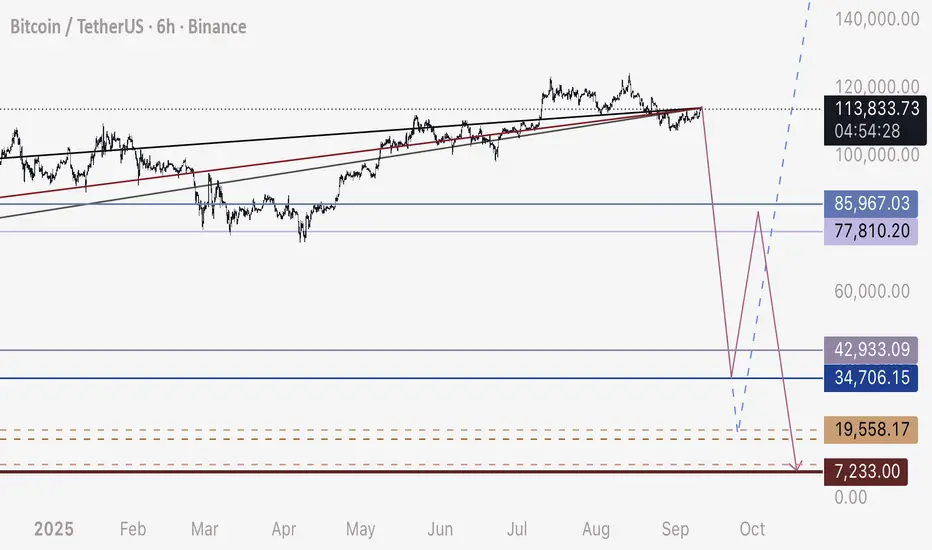
BTC - Crash Path PossibilitiesI expect Bitcoin to crash hard today, and here is a zoomed in look at my potential pathways.
NOTE - See linked related idea on DXY to make sense of this more
Beginning with most likely in my own opinion, to least likely:
Option 1:
114,200 to 35,000 - Short
35,000 to 85,000-86,000 - Long
85,000 to 8,000 - Short
8,000 - Long Entry
Option 2:
114,000-115,000 to 18,000-19,500 - Short
20,000 - Long Entry
Option 3:
114,200 to 43,000 - Short
43,000 to 77,000 - Long
77,000 to 8,000 - Short
8,000 - Long Entry
Strategy:
- Regardless of option I am short Bitcoin
- I will watch for a sudden crash initiate today
- I will first watch for a hold and bounce at 35,000 - closing 75% of my short at 45,000 (I expect wick to be very fast and hard to trade exact numbers)
- If we see a bounce at 35,000 - I will open a hedge long at that level
- Repeat first four steps if we drop below 30,000, looking for the correct bottom and closing short accordingly
- Safest option is low leverage short and spot buys at the bottom levels
Thanks to those who have been following me and supporting my ideas. I know I’m the only one speaking about this.
Happy trading.
Gold (XAU/USD) - Look at Williams %RGold (XAU/USD) - Look at Williams %R
Take a look at the Buy-the-Dip Opportunities in Gold for Swing-Trader whenever Williams %% was in the lower extreme in H8.
We are already slowly coming down. I'd be inclined to take longs in the area I marked on the chart.
If you're a swing-trader, that is a great opportunity.
Let me know what you think,
Meikel

USDCHF daily chart ,the corridor paysThe USDCHF daily chart looks like a corridor battle the price continues to move between support at 0.7910 and resistance at 0.8170 and as long as these levels hold the swing trading strategy remains valid buying near support and taking profits near resistance works textbook style if resistance at 0.8170 is broken the next logical target shifts to the 0.8440 zone where significant volume is concentrated technically the structure still points to a sideways market with possible false breakouts fundamentally the pair remains driven by the US dollar index and Fed policy while the franc traditionally acts as a safe haven any shifts in Fed rhetoric or SNB actions could trigger a breakout from the range in conclusion as long as USDCHF trades in this corridor it is a convenient instrument for range trading and breakouts should only be traded with volume confirmation and price consolidation above key levels

XLM — Correction Ending, Rally Loading?XLM recently found support at the 0.55 Fib retracement, in confluence with the 21 EMA/SMA on the weekly timeframe, triggering a bounce. The ideal 0.618 long entry unfortunately did not come into play.
Support Confluence
21 EMA (weekly): $0.3536
21 SMA (weekly): $0.3384
200 EMA (daily): $0.33425
200 SMA (daily): $0.3136
This cluster around $0.35–$0.31 forms a strong dynamic support zone and a great range for DCA laddering.
Resistance Confluence (Take Profit Zone $0.63–$0.65)
20B Market Cap Resistance: ~$0.63
Key High (Buy-Side Liquidity): $0.6374
0.786 Fib retracement: $0.6426
1.0 Trend-Based Fib Extension: $0.648
1.618 Fib Extension: $0.6296
Together, these create a stacked resistance cluster between $0.63–$0.65 → ideal take-profit zone and potential short setup.
🟢 Trade Plan
Best Entry: Laddering (DCA) from current levels down toward $0.31
Stop-Loss: Flexible depending on DCA strategy, clear invalidation below $0.31
Target (TP Zone): $0.63–$0.65
Technical Insight
The bounce from the 0.55 Fib retracement + weekly 21 EMA/SMA shows bulls defending this zone.
With strong dynamic support below and a stacked resistance confluence cluster at $0.63–$0.65, XLM may be setting up for a 70%+ rally.
DCA remains the best approach, as laddering down toward $0.31 allows flexible positioning.
Key Levels to Watch
Support: $0.35–$0.31 (EMA/SMA cluster, DCA zone)
Resistance / TP: $0.63–$0.65 (Fib, extensions, market cap confluence)
🔍 Indicators used
Multi Timeframe 8x MA Support Resistance Zones → to identify support and resistance zones such as the weekly 21 EMA/SMA.
➡️ Available for free. You can find it on my profile under “Scripts” and apply it directly to your charts for extra confluence when planning your trades.
_________________________________
💬 If you found this helpful, drop a like and comment!
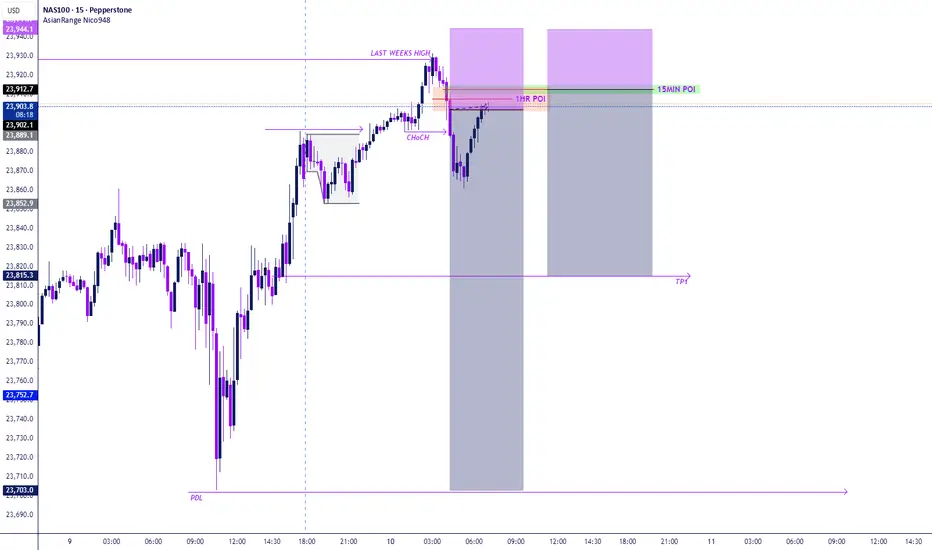
NAS100 – Liquidity Sweep & Short Setup (1H + 15M Scaling)After an aggressive bullish run, NAS100 swept last week’s high and immediately shifted structure (ChoCH).
This confirms external liquidity has been taken and market sentiment is turning bearish.
🔎 Trade Narrative
1. Liquidity Sweep → Last week’s high taken.
2. ChoCH → Order flow shifted bearish after sweep.
3. POIs in Play:
1H Supply Zone → First entry short (early exposure, confirmation).
15M Refined POI → Sell limit placed (precision scaling inside the 1H zone).
4. Target → Previous Day’s Low (PDL) as the next liquidity pool.
📐 Execution Plan
Entry 1: Short from 1H POI ✅
Entry 2: Sell limit at refined 15M POI ✅
Stop Loss: Above 1H supply sweep candle.
Take Profit: Previous Day’s Low (PDL).
Risk Management: Total risk capped at 1% across both entries.
🧠 Institutional Logic
Scaling entries across HTF + LTF zones provides:
Higher TF confirmation ✅
Lower TF precision ✅
Blended entry for better RR ✅
⚖️ Bias: Bearish
Targeting PDL unless price structure shifts bullish again.
NZDUSD: Important Breakout & Bullish Outlook 🇳🇿🇺🇸
I spotted a confirmed breakout of a resistance line of a falling
parallel channel on NZDUSD on a daily time frame.
The next strong resistance is 0.597.
With a high probability, it is going to be reached soon.
❤️Please, support my work with like, thank you!❤️
I am part of Trade Nation's Influencer program and receive a monthly fee for using their TradingView charts in my analysis.

BABA 1D Time frame📊 Market Snapshot
Current Price: Around $146–147
Recent Trend: Strong upward momentum over the past weeks
Overall Technical Bias: Bullish, but nearing overbought
🔎 Technical Indicators
RSI (14-day): ~75 → Overbought zone, signals strong momentum but also risk of pullback.
MACD: Positive → Momentum remains bullish.
Stochastic & CCI: High readings → Also showing overbought conditions.
📈 Moving Averages
5-day MA: ~$146 → Bullish short-term support
10-day MA: ~$145 → Still bullish
20-day MA: ~$140 → Strong base level
50-day MA: ~$137 → Medium-term support
100-day MA: ~$130 → Long-term support
200-day MA: ~$125 → Major long-term support
All major moving averages are aligned bullishly.
🔧 Support & Resistance
Support Zone: ~$145–146
Resistance Zone: ~$147–150 (immediate), with potential toward $160 if breakout continues
📅 Outlook
Bullish Case: If price holds above ~$147, it could target $150+ and possibly $160.
Bearish Case: Overbought readings may trigger a pullback toward $145 or even $140.
Overall Bias: Bullish trend intact, but short-term consolidation or mild correction is possible.

MSTR 1D Time frameMarket Snapshot
Current Price: ~$328.50
Daily Change: -0.4% (approx)
Technical Overview
Indicators & Momentum
RSI (14-day): ~40 → Neutral, slightly below the midpoint—no major squeeze yet.
MACD: Negative (~–1.6) → Weak bearish momentum.
Stochastic Oscillator: Around 31 → Neutral to slightly oversold.
Stochastic RSI: Overbought zone → Possible short-term exhaustion.
Williams %R: ~–39 → Suggests room for both upside and downside.
ADX: ~18–26 → Indicates a weak to moderate trend—market lacks strong direction.
Moving Averages
Short-term moving averages (like 5-day and 10-day) show buy signals, while broader averages—including the 20-day, 50-day, 100-day, and 200-day—are all negative, suggesting broader downward pressure.
Support & Resistance
Based on various pivot point analyses:
Immediate Support: ~$324–325
Near-term Support Zone: ~$320
Immediate Resistance: ~$332–334
Further Resistance: ~$340–345
Broader Technical & Market Context
Downtrend in Play: The stock has declined nearly 40% from its July highs and is approaching its lowest levels since April.
Death Cross Forming: The 50-day moving average is nearing a bearish crossover below the 200-day average.
Diving Technical Ratings: Most moving averages and oscillators point to a negative bias—short-term signals are weak, and longs are retreating.
Bullish Divergence? Some chart setups hint at a potential wedge or triangle pattern with possible bullish divergence, but these are speculative and not yet confirmed.
MicroStrategy remains under pressure, with indicators pointing overwhelmingly to neutral or bearish signals. While short-term moving averages show minor support, the broader technical picture remains weak—and a breakout above ~$334 would be needed to suggest a reversal.

MSFT 1D Time frameMarket Snapshot
Current Price: ~$498.41
Daily Change: +0.23 (≈0.05%)
Market Cap: ~$2.79 Trillion
P/E Ratio: ~28.9
EPS: ~12.93
🔎 Technical Indicators
RSI (14-day): ~41 → Neutral, leaning slightly bearish.
MACD: –2.7 → Negative but giving a weak buy crossover signal.
Williams %R (14-day): ~–74 → Suggests a possible rebound (buy).
CCI (14-day): ~–108 → Oversold zone, buy indication.
ADX (14-day): ~20.6 → Weak trend strength.
ROC (Rate of Change): –3.5 → Mild bearish momentum.
📈 Moving Averages
5-day MA: Below current price → Bearish short-term.
20-day MA: Below current price → Bearish.
50-day MA: ~$509, above price → Acting as resistance.
100-day MA: ~$476, below price → Supportive.
200-day MA: ~$443, below price → Long-term uptrend still intact.
🔧 Support & Resistance
Support Zone: ~$491 – $497
Resistance Zone: ~$500 – $510
📅 Outlook
Bullish Case: If MSFT climbs above $509–510, momentum could extend toward new highs.
Bearish Case: A break below $491 may lead to a pullback toward $480–485.
Overall Bias: Neutral to slightly bearish in the short term, but long-term bullish trend remains intact above the 200-day MA.

AMD 1D Time frameMarket Snapshot
Current Price: ~$155.82
Daily Change: +2.9%
Recent Trend: Up more than 30% year-to-date, but momentum has slowed in the last few weeks.
🔎 Technical Indicators
RSI (14-day): ~54 → Neutral, neither overbought nor oversold.
MACD: Slightly negative → Mild selling pressure.
Moving Averages:
5-day MA: ~$154.6 → Supportive (bullish short-term).
50-day MA: ~$157.9 → Acting as resistance.
200-day MA: ~$168.3 → Major long-term resistance.
Summary: Short-term momentum is holding, but medium to long-term averages are pushing down on price.
📈 Support & Resistance
Immediate Support: ~$150 – $155 zone
Resistance Levels: ~$158 (50-day), then ~$168 (200-day)
📅 Outlook
Bullish Case: If AMD sustains above ~$158, upside targets near $170–175 open up.
Bearish Case: A break below ~$150 could drag it toward $140–145.
Bias: Neutral to mildly bearish in the near-term, with long-term upside still intact if it reclaims the 200-day MA.

ADANIPORTS 2Hour Time frameADANIPORTS 2-Hour Snapshot
Current Price: ₹1,388.90
Previous Close: ₹1,380.90
Day Range: ₹1,385.00 – ₹1,404.90
52-Week Range: ₹995.65 – ₹1,494.00
Volume: 2,553,605
VWAP: ₹1,392.82
Market Cap: ₹300,065 Cr
🔎 Technical Indicators
Relative Strength Index (RSI): Neutral
Moving Averages:
50-period: ₹1,385.28 — Negative
100-period: ₹1,368.32 — Negative
200-period: ₹1,260.96 — Positive
Moving Average Convergence Divergence (MACD): -14.67 — Negative
Stochastic Oscillator: 39.95 — Neutral
📈 Market Sentiment
Pivot Points:
Resistance: ₹1,327.20
Support: ₹1,305.85
📅 Outlook
Bullish Scenario: A breakout above ₹1,327.20 could signal a move toward ₹1,350.00.
Bearish Scenario: A drop below ₹1,305.85 may lead to further downside.
Overall Bias: Neutral, with mixed signals from moving averages and momentum indicators.

JIOFIN 2Hour Time frameJIOFIN 2-Hour Snapshot
Current Price: ₹311.10 INR
Change: +1.28% from the previous close
Intraday High: ₹313.35 INR
Intraday Low: ₹309.60 INR
🔎 Technical Indicators
Relative Strength Index (RSI): Neutral
Moving Averages:
5-period MA: ₹310.50 INR
10-period MA: ₹310.00 INR
20-period MA: ₹309.50 INR
50-period MA: ₹308.00 INR
📈 Market Sentiment
Pivot Points:
Resistance: ₹315.00 INR
Support: ₹305.00 INR
📅 Outlook
Bullish Scenario: A breakout above ₹315.00 INR could signal a move toward ₹320.00 INR.
Bearish Scenario: A drop below ₹305.00 INR may lead to further downside.
Overall Bias: Neutral, with mixed signals from moving averages and momentum indicators.

SPX 2Hour Time frameSPX 2-Hour Snapshot
Current Value: 6,512.61 USD
Change: +0.27% from the previous close
Intraday High: 6,525.75 USD
Intraday Low: 6,490.25 USD
🔎 Technical Indicators
Relative Strength Index (RSI): Neutral
Moving Averages:
5-period MA: 6,487.92 USD
20-period MA: 6,456.40 USD
50-period MA: 6,363.42 USD
100-period MA: 6,086.43 USD
200-period MA: 5,975.33 USD
📈 Market Sentiment
Pivot Points:
Resistance: 6,525.75 USD
Support: 6,490.25 USD
📅 Outlook
Bullish Scenario: A breakout above 6,525.75 USD could signal a move toward 6,600 USD.
Bearish Scenario: A drop below 6,490.25 USD may lead to further downside.
Overall Bias: Neutral, with mixed signals from moving averages and momentum indicators.

BTCUSDT 2Hour Time frameBTC/USDT 2-Hour Snapshot
Current Price: $112,349.00
Change: -0.29% from the previous close
Intraday High: $112,891.00
Intraday Low: $110,812.00
🔎 Technical Indicators
Relative Strength Index (RSI): Neutral
Moving Averages:
7-period MA: $112,376 (short-term support)
25-period MA: $111,484 (medium-term support)
99-period MA: $113,049 (short-term resistance)
📈 Market Sentiment
Pivot Points:
Resistance: $113,650
Support: $108,666
📅 Outlook
Bullish Scenario: A breakout above $113,650 could signal a move toward $120,000.
Bearish Scenario: A drop below $108,666 may lead to further downside.
Overall Bias: Neutral, with mixed signals from moving averages and momentum indicators.

USDJPY 2Hour Time frameUSD/JPY 2-Hour Snapshot
Current Price: 147.46 JPY
Change: +0.05% from the previous close
Market Cap: Not applicable
P/E Ratio: Not applicable
EPS: Not applicable
Intraday High: 147.59 JPY
Intraday Low: 147.27 JPY
🔎 Technical Indicators
RSI (14): Neutral
MACD: Neutral
Moving Averages:
5-period SMA: Not available
10-period SMA: Not available
20-period SMA: Not available
50-period SMA: Not available
📈 Market Sentiment
Pivot Points:
R1: Not available
R2: Not available
R3: Not available
S1: Not available
S2: Not available
S3: Not available
📅 Outlook
Bullish Scenario: A breakout above the current price could lead to further gains.
Bearish Scenario: A drop below the current price may test support levels.
Overall Bias: Neutral, with mixed signals from moving averages and momentum indicators.

MSFT 45Minutes Time frameMSFT 45-Minute Snapshot
Metric Value
Current Price $498.41 USD
Change +0.05% from previous close
Market Cap $2.79 Trillion
P/E Ratio 28.88
EPS $12.93
🔎 Technical Indicators
RSI (14): 40.92 — Neutral
MACD: -2.70 — Bearish momentum
Moving Averages:
5-period SMA: $502.33 — Sell signal
10-period SMA: $504.10 — Sell signal
20-period SMA: $509.62 — Sell signal
50-period SMA: $509.09 — Sell signal
📈 Market Sentiment
Pivot Points:
R1: $507.19
R2: $519.38
R3: $526.79
S1: $487.59
S2: $480.18
S3: $467.99
📅 Outlook
Bullish Scenario: A breakout above $507.19 could lead to a push toward $519.38 and higher.
Bearish Scenario: A drop below $487.59 may test support around $480.18.
Overall Bias: Neutral to slightly bearish, with mixed signals from moving averages and momentum indicators.

AMZN 45Minutes Time frameAMZN 45-Minute Snapshot
Current Price: $238.24 USD
Change: +1.02% from the previous close
Intraday Range: $235.08 – $238.85 USD
52-Week Range: $161.38 – $242.52 USD
🔎 Technical Indicators
RSI (14): 67.1 — Neutral to slightly overbought
MACD: 1.88 — Bullish momentum
Moving Averages:
5-period SMA: $237.61 — Buy signal
10-period SMA: $236.92 — Buy signal
20-period SMA: $235.59 — Buy signal
50-period SMA: $231.42 — Buy signal
📈 Market Sentiment
Pivot Points:
R1: $238.90
R2: $239.43
R3: $240.13
S1: $236.97
S2: $237.67
S3: $238.20
📅 Outlook
Bullish Scenario: A breakout above $238.90 could lead to a push toward $239.43 and higher.
Bearish Scenario: A drop below $236.97 may test support around $235.59.
Overall Bias: Neutral to slightly bullish, with positive momentum but facing near-term resistance.

TSLA 45Minutes Time frameTSLA 45-Minute Snapshot
Current Price: $346.97 USD
Change: +0.18% from the previous close
Intraday Range: Not available
🔎 Technical Indicators
RSI (14): 53.64 — Neutral
MACD: 1.78 — Buy signal
Moving Averages:
5-period SMA: $347.01 — Sell signal
10-period SMA: $346.78 — Buy signal
20-period SMA: $347.82 — Sell signal
50-period SMA: $340.53 — Buy signal
📈 Market Sentiment
Pivot Points:
R1: $347.52
R2: $348.18
R3: $348.95
S1: $345.32
S2: $344.65
S3: $343.99
📅 Outlook
Bullish Scenario: A breakout above $347.52 could lead to a push toward $348.18 and higher.
Bearish Scenario: A drop below $345.32 may test support around $344.65.
Overall Bias: Neutral to slightly bullish, with mixed signals from moving averages.

BANKNIFTY 45Minutes Time frameBANKNIFTY 45-Minute Snapshot (Updated)
Current Price: 54,533 INR
Change: +0.77% (approx) from previous close
Day's Range: 54,200 – 54,600 INR (intraday estimate)
52-Week Range: 45,000 – 60,000 INR
🔎 Technical Indicators
RSI (14): ~65 — Slightly overbought, watch for pullbacks
MACD: Positive, bullish momentum
Moving Averages:
5-period SMA: 54,300 — Price above SMA → Buy signal
10-period SMA: 54,100 — Price above SMA → Buy signal
20-period SMA: 53,800 — Price above SMA → Buy signal
50-period SMA: 53,200 — Price above SMA → Buy signal
🔑 Key Levels
Resistance:
R1: 54,600 — Immediate resistance
R2: 55,000 — Psychological/round number resistance
Support:
S1: 54,300 — Near-term support
S2: 54,000 — Stronger support
📅 Outlook
Bullish Scenario: Price holds above 54,500 and breaks 54,600 → upward move toward 55,000.
Bearish Scenario: Price falls below 54,300 → pullback to 54,000 possible.
Overall Bias: Moderately bullish with strong upward momentum, but near-term resistance around 54,600.
