XAGUSDHello Traders! 👋
What are your thoughts on SILVER?
Silver experienced a sharp decline after a strong rally and printing a local high, correcting nearly 50% from its peak. Upon reaching the highlighted support zone, price showed a bullish reaction, indicating the presence of buyers and the validity of this demand area.
At this stage, we expect price to spend some time moving sideways and ranging within this zone before attempting a bullish corrective move toward the specified upside levels.
As long as price remains below the key resistance areas, any upside move should be considered corrective rather than trend-reversing.
Don’t forget to like and share your thoughts in the comments! ❤️
Trend Analysis

MONDAY UPPDATE ANALYSIS Naveen Khan: Price is respecting an ascending trendline, indicating a strong bullish structure. Higher highs and higher lows suggest buyers remain in control. As long as price holds above the trendline and key intraday support, the bullish bias remains valid. A sustained hold above current consolidation could lead to continuation toward higher resistance levels, while a break below the trendline would signal a potential deeper pullback.
Naveen Khan: We have created a buy setup, so if the market breaks our resistance, then we can see this market above our target. Trading is always done with risk management discipline and patience.
Naveen Khan: Price has successfully broken above the key resistance zone and is currently sustaining above it, which confirms bullish strength in the market. This breakout aligns with our Monday update, where we highlighted the importance of this resistance level.
As long as price holds above the broken resistance, the bullish bias remains intact. Any minor pullbacks toward the previous resistance can now be considered potential buying opportunities, provided the structure stays strong.
The overall price action suggests continuation toward the marked upside targets. A strong rejection from the support areas would further validate buyers’ control. However, a sustained move back below resistance would weaken the bullish scenario.
Trade with proper risk management and respect the invalidation level marked on the chart

AUDUSD – Rejection at VAH → Gap MagnetPrice failed to accept above VAH and is trading back below value, signaling rejection.
As long as price stays below 0.7005–0.7030, downside rotation toward the gap zone (~0.6920) remains favored.
Bias: 📉 Bearish below value
Invalidation: Acceptance back above VAH

gold uppdateStrong Buy Area Gold has more chances to go up and the market had to touch its high and now we are seeing a trend back up. The second tip is quite interesting. We just have to wait for our target and trading is always done with patience, resource management and discipline.

NVDA (daytrading) maybe comeback this week?**“The strong comeback on Friday was amazing.
What do we have?
The daily candle touched the 200 SMA.
The weekly candle closed as a doji.
Price is still respecting the trendline support.”**

Overlap resistance ahead?USD/JPY is rising towards the resistance level, which is an overlap resistance that aligns with the 78.6% Fibonacci retracement and could reverse from this level to our take profit.
Entry: 157.76
Why we like it:
There is an overlap resistance that aligns with the 78.6% Fibonacci retracement.
Stop loss: 159.39
Why we like it:
There is a swing high resistance level.
Take profit: 156.32
Why we like it:
There is a pullback support level.
Enjoying your TradingView experience? Review us!
Please be advised that the information presented on TradingView is provided to Vantage (‘Vantage Global Limited’, ‘we’) by a third-party provider (‘Everest Fortune Group’). Please be reminded that you are solely responsible for the trading decisions on your account. There is a very high degree of risk involved in trading. Any information and/or content is intended entirely for research, educational and informational purposes only and does not constitute investment or consultation advice or investment strategy. The information is not tailored to the investment needs of any specific person and therefore does not involve a consideration of any of the investment objectives, financial situation or needs of any viewer that may receive it. Kindly also note that past performance is not a reliable indicator of future results. Actual results may differ materially from those anticipated in forward-looking or past performance statements. We assume no liability as to the accuracy or completeness of any of the information and/or content provided herein and the Company cannot be held responsible for any omission, mistake nor for any loss or damage including without limitation to any loss of profit which may arise from reliance on any information supplied by Everest Fortune Group.

HOOD: Looking Good For a SwingAnother one setting up for a good trade before earnings.
HOOD has good volatility when it makes its moves making it a good candidate for a swing.
Hood is expected to move up before earnings .
Hood is in buy zone, but still has around 10 4hrs candles of Bearish TIME but with the fractal bottom at around $67.00 that makes it a bit riskier but risk/reward is very good.imo
Play it Right..........Play it Safe..........Know The Rules Of The Game.
Boost.........Follow..........Comment

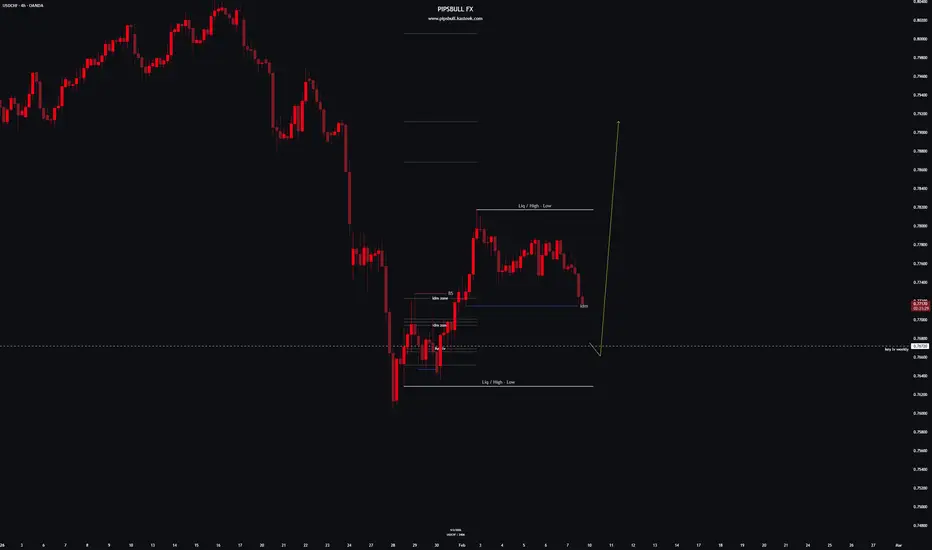
USDCHF 4H — Liquidity Sweep and Structural Reaction at Key LevelThis idea highlights USDCHF on the 4-hour timeframe, focusing on price behavior after a strong bearish move and a reaction around a key level.
Following the impulsive downside move, price swept liquidity below the recent lows and formed a base near a weekly key level. The current structure shows consolidation with clear reactions from an internal demand area, suggesting that downside momentum has slowed and price is stabilizing.
🔎 Technical Observations:
Strong bearish displacement prior to the current structure
Liquidity taken below previous swing lows
Price reacting around a key weekly level
Formation of a short-term range after the sweep
Internal demand (IDM) acting as a support reference
📌 Market Context:
The current price action can be viewed as a pause or accumulation phase after sell-side liquidity was cleared. Further expansion would require confirmation through displacement and acceptance above recent internal highs.
⚠️ Educational Note:
This analysis is shared to study market structure, liquidity behavior, and price reaction, not to predict future movement or provide trading signals.
— PIPSBULL FX
Aster scalp short Just went short on SEED_WANDERIN_JIMZIP900:ASTER (scalp). Given that we got weekly closure and didn't hit my bullish target from earlier I view that as low demand and anticipate another corrective move down.
sl: $0.6380
Exit area: $0.6
1.39RR+

OTHERS: Structural Weakness Remains Despite Short-Term Relief The broader cryptocurrency market (excluding the top 10) continues to display structural weakness, with price action favoring additional downside before any sustainable recovery can be considered. While short-term relief remains possible, the dominant Elliott Wave structure and Fibonacci confluence suggest that bearish targets are still active at the macro level.
This analysis focuses on structure, alignment, and proportionality, rather than short-term price noise.
Price remains confined within a descending channel, respecting both its upper and lower boundaries with notable precision. The recent rejection from the channel’s upper half reinforces the idea that the prevailing trend is corrective rather than impulsive.
The broader pattern can be interpreted as a complex corrective structure, where price is currently developing the latter stages of a zigzag-style move. Despite intermittent bounces, market behavior continues to favor trend continuation to the downside.
ELLIOTT WAVE BREAKDOWN
At the macro level, the structure is unfolding as a corrective sequence, rather than the start of a new impulsive advance.
The larger move can be interpreted as a zigzag (A)–(B)–(C).
- Wave (A) completed with clear internal subdivision.
- Wave (B) retraced into Fibonacci resistance, failing to reclaim the prior structure decisively.
- Price is now progressing within wave (C), which itself subdivides cleanly into a five-wave structure.
Internal Structure
Within wave (C), the chart highlights:
- A clearly defined 1–2–3–4–5 sequence on the lower timeframe.
- The smaller, darker Fibonacci measurements correspond to this micro impulsive count, used to confirm momentum and internal symmetry.
- These internal waves align with the broader corrective expectation, reinforcing the bearish scenario rather than contradicting it.
Downside Expectation and Macro Targets
As long as price remains below the descending channel resistance, the expectation is for continuation toward the macro 0.618–0.786 retracement zone. These levels align with:
- Channel support
- Completion of wave (C)
- Fibonacci extensions of the broader corrective structure
A sustained move beyond the 0.786 region would signal further structural weakness and likely imply that the correction is not yet complete.
Lower Timeframe Invalidation: A Conditional Note
While the macro outlook remains bearish, the chart clearly highlights a lower timeframe invalidation level.
- A break above this level would suggest the possibility of a short-term uptrend or relief rally.
- Such a move would likely target the upper boundary of the parallel channel, rather than signal a full trend reversal.
- Importantly, this does not invalidate the macro bearish structure unless followed by impulsive continuation and structural confirmation.
In other words, any upside above the lower timeframe invalidation should be viewed as corrective unless proven otherwise.
CONCLUSION
The broader crypto market continues to trade within a corrective framework, with downside risk still dominant despite the possibility of temporary relief moves. Elliott Wave structure, Fibonacci symmetry, and channel dynamics all point toward lower levels being required before a meaningful macro reversal can occur.
What makes this analysis particularly compelling is the alignment across degrees, from micro wave counts to macro Fibonacci targets, where multiple measurements converge at similar bearish levels. This type of structural agreement strengthens confidence in the roadmap, even as short-term volatility persists.
As always, structure leads, and price confirms.

GOLD (XAUUSD) | 1H Harmonic Pattern | Bullish Breakout Setup#Gold is currently forming a valid Harmonic Pattern on the 1-hour timeframe and, so far, no bearish signals are visible. Price action remains healthy, suggesting buyers are in control.
The key level to watch is resistance. A clean breakout and candle close above this level could confirm bullish continuation. Upon a successful breakout and retest confirmation, I will look for long positions, strictly following proper risk management.
Trade Plan
Bias: Bullish
Entry: After resistance breakout & retest
Invalidation: Pattern failure / bearish confirmation
Risk Management: Mandatory (no FOMO trades)
Patience is key — confirmation first, execution second.
What’s your view on #GOLD here?
Are you expecting a breakout or a rejection from resistance?

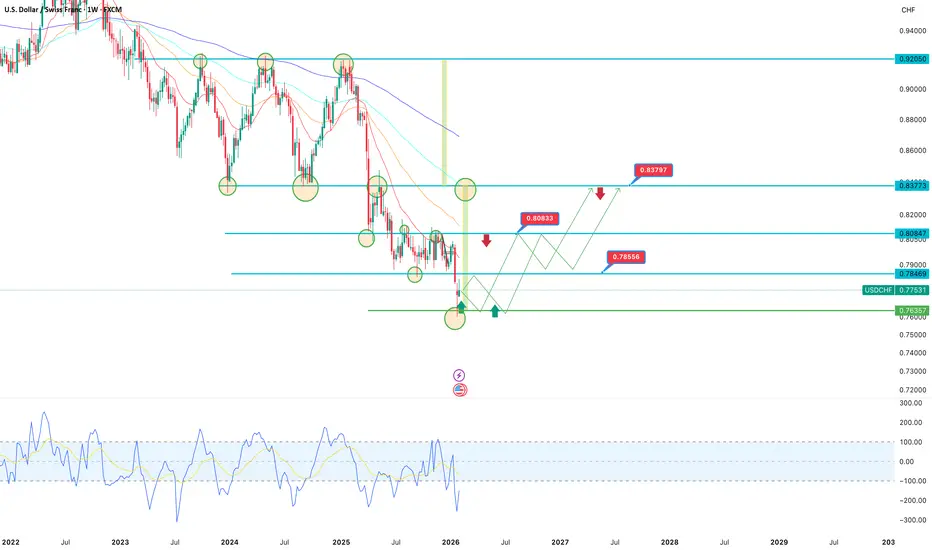
USDCHF: Long-term Bearish Trend Persists Since 2022, the pair has been in a steady downtrend: consistent lower highs and lower lows within a multi-year descending channel from highs near 0.9200-0.9400.
Current price around 0.7753, following a bounce from the multi-year low at 0.76357 (green support zone marked on the chart).
Support:
0.76357 (critical multi-year zone, green line), below - potential extension to 0.7600-0.7550 (channel projection).
Resistance:
0.80833 (intermediate level, 2025 low), higher - 0.83797 and 0.84847 (next Seller Zones).
Long-term downside target: 0.7635-0.7600 (primary buyer zone on weekly), break below opens path toward 0.7400+.
Current structure remains bearish:
after a false upside breakout in 2025, price returned to the channel and is forming lower lows. Volume profile and oscillators indicate fading bullish momentum, with CHF staying strong amid risks and SNB policy.
Primary scenario - continued downside: holding below 0.7850-0.7900 leads to test of
0.7635-0.7600 in the coming months.
Bullish alternative (low probability): strong bounce from 0.7635 with break above 0.80833 targeting 0.83797 - would require sharp CHF weakness or aggressive Fed easing.
Fundamentally, the franc benefits as a safe-haven amid global uncertainty, while the dollar loses ground. Looking for weekly candle close below 0.7700 to confirm stronger bearish conviction.
Your view?
Short from current levels or waiting for a bounce off 0.7635? Share your thoughts in the comments.
UNI Traders Are Being Set Up - Is This the Trap Before the Drop?Yello Paradisers! Are you watching what’s happening with #UNI right now? Because this move might be the last warning before a much deeper drop. We’ve spotted a series of red flags, and the chart is speaking loud and clear smart money is positioning, and it’s not on the bullish side, Even more importantly, #UNI breaks the lower trigger line of buying climax. The price action on higher time frames shows a clear bearish structure there is a major probability for the downside move.
💎#UNI respected the descending resistance and failed to break above it, which confirms ongoing weakness. #UNI momentum has now clearly shifted to the downside and gain momentum within the supply zone, as long momentum sustained within the supply zone, we can expect a further move down toward the minor support level of 3.118.
💎#UNI formed a buying climax followed by climactic action bar, strongly suggesting that institutional players are offloading and preparing for more downside move according to volume spread analysis (VSA).
💎#UNI breaks the lower trigger line of buying climax for the second time, which confirmed the weakness, if momentum holds, the next major target sits around 2.850 that could be tested soon.
💎If #UNI manages to break above the key resistance at 3.715 with a strong momentum candle, this whole bearish probability would be invalidated, and we could instead see a bullish continuation. As always, we let price confirm our bias.
Discipline is key, Paradisers! The charts may look volatile, but this is where professionals thrive and amateurs panic. Don’t let emotions guide your trades. Wait for clear confirmation and manage risk like a pro. Strive for consistency, not quick profits. Treat the market as a businessman, not as a gambler.
MyCryptoParadise
iFeel the success🌴

XAUUSD LONGIt remains to be assumed that with the pullback of just under 21%, we have completed a wave 4 correction in purple. Even if this was not completed perfectly, it does not violate any rules. On the smaller interval, we have already seen an impulse, which significantly increases the likelihood of our bullish bias. We now expect to complete wave 3 in green and the higher-level 5.
Entry: $5024.91
SL: low of wave 4

GOLD, Small pullback to enter BUYS towards $5300?Here I’ve marked a potential buy zone at 4,969 – 4,950. Although price remains structurally bullish, there is still a chance the weekend gap stays unfilled if momentum continues higher.
A break above the key level at 5,050 should open the next leg toward 5,100 – 5,125, where initial resistance is expected. Above that, the major FVG between 5,200 – 5,300 continues to act as a strong magnet for price.
A weaker US dollar to start the week adds further support to the bullish case for Gold.
Key Scenarios
✅ Bullish 🚀
Entry Zone: 4,969 – 4,950
🎯 TP1: 5,050
🎯 TP2: 5,100 – 5,125
🎯 Final: 5,200 – 5,300 FVG
❌ Bearish Shift 📉
Failure to hold 4,950 → deeper retrace risk
Loss of 4,900 → structure weakens
Levels to Watch
Resistance 🔴: 5,050 | 5,100–5,125 | 5,200–5,300
Support 🟢: 4,969–4,950 | 4,900

BTCUSD 1H Range Consolidation Below Resistance (Bearish Bias)📊 Market Structure Overview
Overall bias: Still bearish to neutral
Price is trading below the descending trend / dynamic resistance (orange curve).
Market is currently range-bound between a clear resistance and support zone.
🔴 Resistance Zone (Key Supply)
Area: 71,800 – 72,300
This zone has been tested multiple times and rejected.
Strong selling pressure visible → sellers defending this level hard.
As long as price stays below this zone, upside is limited.
🟢 Support Zone (Demand / Higher Low)
Area: 62,000 – 63,000
Marked as Higher Low support.
Strong bullish reaction previously → liquidity + buyers present.
This is the major downside target if resistance holds.
🔁 Current Price Action (69,600 area)
Price is consolidating, forming a range
No strong bullish momentum yet
Looks like distribution before a move, not accumulation
🔮 Probable Scenarios
🧨 Scenario 1: Bearish Continuation (More Likely)
Rejection from 72k
Breakdown below 68,500
Move toward 62k support (target zone) 🎯
This aligns with:
Lower highs
Trendline resistance
Weak bullish candles
🚀 Scenario 2: Bullish Reversal (Only if…)
Strong 1H close above 72,300
Retest and hold above resistance
Then upside continuation possible toward:
74,500
78,000
⚠️ Without a clean breakout, bullish entries are risky.
🧠 Trading Insight
Sell on rejection near resistance is safer
Buy only at support with confirmation
Avoid mid-range trades (high risk, low reward)

PLTR is testing investors' patiencePalantir Technologies Inc. is a publicly traded American company specializing in big-data analytics software.
The company was founded in 2003 by Peter Thiel, Nathan Gettings, Joe Lonsdale, Stephen Cohen, and Alex Karp. Its name is derived from The Lord of the Rings universe created by J.R.R. Tolkien, where a Palantír is a legendary artifact known as a “seeing stone,” allowing vision across great distances. Palantir went public in 2020 through a direct listing.
Palantir works closely with major U.S. intelligence and defense agencies, including the CIA (which was also an early investor in the company), the FBI, and the NSA, as well as the U.S. Armed Forces. In addition, the company provides technological solutions to the Ukrainian Armed Forces in the war against Russia, as well as to other military and government entities worldwide (source: Wikipedia).
Palantir did not start 2026 on a positive note, following a cumulative share price increase of more than 1,550% over the past three years. Over the past month, Palantir’s stock has declined by more than 25%, falling from price levels around $200 to the $130–$150 range.
From a technical perspective on the daily chart, Palantir’s stock has reached a support zone established during June–July of last year. While the moving averages still indicate a long-term bullish trend — with the 50-day Exponential Moving Average (EMA 50) trading above the 200-day Simple Moving Average (SMA 200) — the stock is currently trading below both moving averages.
The key question facing traders and investors is whether Palantir is approaching a strong rebound back toward the $200 area, or whether selling pressure will persist, leading to a further decline and a retest of the $100 support zone.
Time will tell...
Disclaimer
Important notice: Colmex Pro Ltd is licensed and regulated by the Cyprus Securities and Exchange Commission (CySEC) under license number 123/10.
Trading in financial instruments, including equities and/or trading with leverage, involves a high level of risk and may not be suitable for all investors.
Past performance is not indicative of future results.

Early bear market bottom? Kaspa is bullish & ready to grow next!I like Kaspa very much right now and I can no longer say that a lower low is necessary down the road. You know some projects can detach completely from the rest of the market, many projects. This can be one of those.
The truth is that KASUSDT reached as low as July 2023 this week. That's basically an entire bullish cycle completely eradicated, nullified—reset.
What's to like? Where is the good news?
The good news is that Kaspa is trading at bottom prices. A major low came in recently and the week is closing green with a strong volume breakout, the highest volume since November 2025.
It all depends on how this bullish phase develops but a strong rise would reveal the start of a new uptrend. Say, if KASUSDT were to hit $0.19 in the coming months, this would be enough for the ensuing correction to end as a higher low, keeping the chart technically bullish.
Maybe a rise to $0.14 can also support a higher low. On the other hand, if the current move, the one that is starting just now, peaks at only $0.095 then we can expect a major crash right after with new lows, lower lows.
This wouldn't be bad either, it would simply mean better entry prices Q3 2026 in anticipation of years of growth. Remember, after Bitcoin's bear market bottom is in, the market will grow for years to come.
Ok. So Kaspa is bullish and ready to grow next. This is very easy to predict.
Thank you for reading.
Namaste.

GBP/USD: Volume Profile Rejection + FVG Confluence (1.3532)GBP/USD shows a strong rejection of lower prices and a shift from selloff into an uptrend. Volume Profile highlights a heavy volume zone where buyers aggressively stepped in. The planned long entry is at 1.3532; the start of that volume cluster, which aligns with the beginning of a fair value gap. If price pulls back there, a buyer reaction and bounce are expected.

GBP/CHF - we reached the strong demand and supprot zoneGBP/CHF 🇬🇧 - 🇨🇭
Currently sitting at an extremely overbought area which we have found a STRONG SUPPORT zone.
The massive sell off of the GBP today was mainly due to Google pointing into selling off a large amount of debt which was in GBP , which affected the price of the GBPCHF and triggered our strong entry finding support at the 105/104.500 zone.
Currently a position with massive value ahead of us.
Entry: 1.04900 ➡️
SL: 104.400 (around the strong support zone) 🟥
Take profit: 106.150 ✅
As always my friends happy trading!
P.S. If you have questions or inquiries about one of my existing set-ups or personal questions / 1 on 1 sessions consider joining my community so you can follow up with me in private!

AUDJPY - Long AUDJPY has shown the strength to hit the higher levels of 111.30.
The Pair might retrace to the levels of 109.75 or even to the levels of 109.28 before flying high .
The move expected for the ext week.

#BTC Bearish Head and Shoulders Structure📊#BTC Bearish Head and Shoulders Structure 📉
🧠From a structural perspective, after a strong rebound, we reached the blue resistance zone, but didn't see any intention to test the extreme resistance at 74,000. Furthermore, after a period of sideways consolidation, we've formed a bearish head and shoulders structure within the blue resistance zone, so there's a probability we'll continue to fall from here.
⚠️Today is the start of the week, so significant volatility is expected. Please be sure to manage your risk carefully.
Let's see 👀
🤜If you like my analysis, please like 💖 and share 💬 BITGET:BTCUSDT.P

Bitcoin Faces Key Test as Macro Pressures Influence Price ActionRecent Market Forces Shaping Bitcoin’s Direction
Bitcoin sentiment has shifted noticeably since late 2025 as optimism about greater institutional adoption met a more challenging macroeconomic environment. The most important headline for Bitcoin has been the change in expectations around global liquidity. Since November 2025, markets have repriced the path of rate cuts as US inflation data re-accelerated and labor markets remained resilient. This pushed bond yields higher and strengthened the US dollar, creating a headwind for Bitcoin and other risk assets.
Another specific driver has been ETF related flows. Spot Bitcoin ETF inflows slowed materially through November and December after a strong first half of the year. Several weeks of flat to negative net flows reduced the marginal bid that had supported higher prices earlier in 2025. At the same time, miners increased hedging activity into year end, adding incremental supply during a period of weaker demand.
Across the broader crypto complex, performance has been mixed to weak. Large cap altcoins have underperformed Bitcoin, while smaller tokens saw sharper drawdowns as liquidity thinned. This has reinforced a defensive tone within crypto, with capital rotating back toward Bitcoin dominance rather than expanding risk. Overall sentiment can best be described as cautious and reactive rather than outright bearish, with participants focused on where longer term value may re-emerge.
What the market has done
• Since the end of October 2025, buyers lost control of 110000, which aligned with the 2025 developing VPOC. Sellers were then able to take control and offer prices back down toward the 87700 to 83100 area, which corresponds with the 2024 VAH and a key yearly level.
• From November 2025 through January 2026, the market balanced between 98600 and 83100 as buyers and sellers fought for control. This period reflected uncertainty around macro policy direction, slower ETF inflows, and reduced risk appetite across global markets.
• In the past week, buyers failed to defend the 83100 area. Price auctioned aggressively through the 2024 value area and reached the 60200 area, which marks the 2024 VAL. Buyers have responded at this level, suggesting responsive demand at longer term value.
• The broader decline since November 2025 has occurred alongside tighter financial conditions, a firmer US dollar, and fading expectations for near term monetary easing, all of which historically pressure Bitcoin valuations.
What to expect in the coming weeks
Key levels to watch are 82000, which aligns with a yearly level and offer block 2 low, and 60200, which represents the 2024 VAL.
Neutral scenario
• Expect the market to consolidate and auction two way between 82000 and 60200 as value is rebuilt.
• This scenario would likely align with stable macro data, no major policy surprises from central banks, and muted ETF flows that neither add nor remove significant demand.
Bullish scenario
• If buyers are able to step up bids within the current range, it may be an early signal that the bullish scenario is developing.
• A break and acceptance above 82000 would open the door for a move back through offer block 2 toward the 100000 area, which aligns with the 2025 LVN, where sellers are expected to respond.
• A bullish outcome would likely require renewed ETF inflows, easing financial conditions, or a clear shift toward more accommodative monetary policy.
Bearish scenario
• If sellers begin to step down offers within the range and compress price toward the 60000 area, it would hint that the bearish scenario is in play.
• A break and acceptance below 60000 would suggest continuation lower toward the 40000 area, which aligns with the 2023 VAL, where buyers are expected to respond.
• This path would likely coincide with further tightening in financial conditions, stronger dollar trends, or renewed risk off behavior across global markets.
Conclusion
Bitcoin is currently trading at a critical inflection point where longer term value is being tested against a challenging macro backdrop. Technically, the response at the 2024 VAL near 60200 is constructive, but acceptance back above 82000 is needed to shift the balance in favor of buyers. Fundamentally, the next sustained move will depend on liquidity conditions, ETF flows, and how global markets price the path of monetary policy. Until clarity emerges, Bitcoin is likely to remain in an environment where patience and level awareness matter most.
Let me know how you are positioning around these key levels and which scenario you think is most likely to play out.
Disclaimer: This is not financial advice. Analysis is for educational purposes only; trade your own plan and manage risk.
Acronyms:
C - Composite
w - Weekly
m - Monthly
VAH - Value Area High
VAL - Value Area Low
VPOC - Volume Point of Control
LVN - Low Value Node
HVN - High Value Node
LVA - Low Value Area
SP - Single print
