EURUSD Price Update – Clean & Clear ExplanationEUR/USD is currently trading around 1.1864, moving within a short-term consolidation phase after a strong bullish rally earlier in the week. Price initially broke above the ascending channel but failed to sustain momentum, leading to a sharp pullback and a transition into sideways movement.
The EURUSD is now hovering near a minor intraday resistance zone around 1.1865–1.1880. A sustained break above this area could open the path toward the 1.1895–1.1910 supply zone, where sellers may re-enter the market. However, upside momentum appears limited unless buyers regain strong control.
On the downside, immediate support is seen near 1.1830 (1st support), while a deeper correction could extend toward the 1.1800 level (2nd support). A break below 1.1830 would likely increase bearish pressure and shift short-term sentiment in favour of sellers.
Overall, the pair remains neutral-to-bearish in the short term unless it decisively breaks above the upper resistance zone. Traders should watch for a breakout from the current range for the next directional move.
“If you come across this post, please like, comment, and share. Thanks!”
Trend Analysis

BTC-USDTIt reacted well to the support I mentioned.
For today, as long as it stays above 68,
it can follow the flash path ✔️🪙

BTCUSD H1 CHART OUTLOOKBTC is trading around 68,500 after rejecting the 70,350 – 70,850 resistance zone.
This area has acted as a strong supply zone, where price previously formed multiple rejections (liquidity grabs + long upper wicks).
After the latest rejection, price dropped sharply and is now reacting from the 68,000 pullback/support area.
🔴 Key Resistance Zone: 70,350 – 70,850
Strong selling pressure
Equal highs liquidity swept
Bearish rejection candle on H1
Market structure still shows lower high from that zone
If price returns here, expect:
Possible fake breakout
Strong volatility
High probability reaction zone
🟢 Key Support / Pullback Area: 68,000 – 68,050
Short-term demand zone
Previous breakout level
Intraday buyers defending
This level decides the next move.
📊 Possible Scenarios & Targets
🟢 Bullish Scenario (If 68,000 Holds)
If BTC holds above 68,000 and forms higher low on H1:
Targets: 1️⃣ 69,200
2️⃣ 69,800
3️⃣ 70,350 (Major Resistance)
4️⃣ 70,850
5️⃣ Breakout Target → 72,000
6️⃣ Extended Target → 73,000
Confirmation needed:
Strong bullish engulfing on H1
Break above 69,400 structure
Volume expansion
🔴 Bearish Scenario (If 68,000 Breaks)
If H1 closes below 68,000 with momentum:
Downside Targets: 1️⃣ 67,250
2️⃣ 66,650
3️⃣ 66,050
4️⃣ 65,550
5️⃣ Major liquidity zone → 65,000
6️⃣ Extended drop → 63,800
Confirmation:
Strong bearish candle close below support
Retest of 68,000 as resistance
Lower high formation
🧠 Market Structure Insight
Overall structure: Range-bound between 68K and 70.8K
Liquidity resting above 71K
Liquidity resting below 66K
Market likely to sweep one side before real expansion
🔎 Trading Plan Idea (Intraday)
Buy Zone: 68,000 – 68,200
SL: Below 67,800
TP: 69,800 / 70,350
Sell Zone: 70,350 – 70,850
SL: Above 71,100
TP: 68,500 / 67,250
⚡ Final Market Mind
BTC is currently in a decision zone.
Holding 68K → Bounce toward 70K+
Losing 68K → Quick drop toward 66K
Expect volatility near U.S. session.

Gold May Consolidate and Correct Before Continuing the Uptrend📊 Market Overview:
Gold price is slightly correcting after a strong rally above 5000 USD/oz, facing profit-taking pressure amid low liquidity at the start of the week and a lack of new market-moving news, while the USD is temporarily stabilizing.
📉 Technical Analysis:
• Key Resistance: 5.050 – 5.080 | 5.120 – 5.150
• Nearest Support: 4.980 – 4.950 | 4.900 – 4.880
• EMA: Price remains above EMA 09, indicating the overall trend is still bullish, but showing signs of short-term correction.
• Candlestick / Volume / Momentum: Corrective candles appeared after the peak, volume slightly decreased → indicating weakening buying pressure. RSI shows mild divergence, suggesting consolidation or a pullback before continuing the main trend.
📌 Outlook:
Gold may decline in the short term toward the 4980–4950 support zone before rebounding if buying pressure returns and price holds above 4900.
________________________________________
💡 Trading Strategy Suggestion:
🔻 SELL XAU/USD : 5.078 – 5.081
🎯 TP: 40 / 80 / 200 / 300 pips
❌ SL: 5.085
🔺 BUY XAU/USD : 4.950 – 4.947
🎯 TP: 40 / 80 / 200 / 300 pips
❌ SL: 4.943

XAUUSD Intraday Reversal Setup – From 4980 to 5005OANDA:XAUUSD
Higher Timeframe Context
Price previously made a strong bullish expansion.
Then we see distribution near 5030–5040 zone.
Followed by strong bearish impulsive leg down.
Clear Lower High → Lower Low structure formed.
So short-term structure = Bearish
But current move shows retracement pullback.
Current Trade Idea on Chart
You marked:
Entry: 4986–4983
SL: 4970
Target: 5005
This is a counter-trend retracement long inside bearish structure.
🧠 Reasoning of the Trade (Detailed)
Liquidity Sweep
Price swept previous low around 4975 area
Then strong rejection wick formed.
That suggests:
Sell-side liquidity taken
Possible short-term reversal
Strong Impulse Down → Pullback Setup
After a large bearish candle, market paused.
Small-bodied candles = selling exhaustion.
That often gives 30–50% retracement move.
Volume Behavior
The dump candle shows increased volume.
Then follow-up candles show reduced selling pressure.
This suggests:
Aggressive sellers exhausted
Buyers absorbing near 4970–4980
Target Logic (5005 Zone)
5005 area is:
Previous support turned resistance
Minor supply zone
Intraday imbalance fill
That makes it logical TP area.
Trade Plan Summary
Bias:
Short-term Bullish retracement
Higher timeframe still slightly bearish.
Entry:
4983–4980 (after confirmation candle close)
Stop Loss:
4970
Below liquidity sweep low
Risk ≈ 10–13 points
Target:
5005
Reward ≈ 22–25 points
Risk:Reward ≈ 1:2
Good intraday structure trade.
Invalidation
If price:
Breaks and closes below 4970
Or high volume bearish continuation appears
Then move likely continues to 4955–4945 next.
Professional Opinion
This is:
✔ Not trend reversal
✔ Only liquidity-based bounce
✔ Works best during NY session volatility
If volume increases strongly above 4995 → high probability of reaching 5005

Bitcoin Sitting Where Big Moves Start !!CRYPTOCAP:BTC MONTHLY UPDATE 🟩
If the weekly chart is making you nervous, zoom out for a second.
Monthly, Bitcoin is testing a major support cluster.
RSI is sitting near its floor, price is around the previous ATH zone, and the recent dip touched the lower channel and the 1M EMA65. This area usually matters.
What happens next depends on the February close.
Hold this zone, and the bigger trend can stay intact. Lose it, and things may get rough.
Let’s watch how the price behaves in early March.
#Bitcoin #Crypto

NDQ Expectation: 1 WeekFrom Nasdaq, the price is in the support zone 24785 points, and it can start to increase till 25735 points, but now the direction is depends on the S&P 500, under 24785 points, the price can decrease till 23980 points.

XAUUSD Where Liquidity Matters More Than DirectionMarket Context
OANDA:XAUUSD is trading inside a corrective phase after a sharp displacement, with price rotating between clearly defined liquidity pools. Higher-timeframe bias remains intact, but short-term flow is now selective and reactive.
Current Observation
🔍 The sell-off delivered a clean expansion followed by a structural response, signaling participation rather than continuation. Price acceptance below the midpoint suggests balance, not urgency.
Key Zones
🔴 Sell-side interest:
5095 – 5097
Area aligned with premium pricing and prior reaction highs. Any interaction here is monitored for distribution behavior rather than breakout acceptance.
Invalidation: 5105
🟢 Buy-side reaction area:
4927 – 4925
Discount zone within the current range structure. Focus remains on the quality of reaction if revisited, especially following sell-side delivery.
Invalidation: 4920
Forward Awareness
Attention remains on how price behaves at the range extremes, reaction and follow-through matter more than direction. Patience is required while liquidity is being redistributed.

Bitcoincash shortNew scalp short on SET:BCH
Sl: $560.7
TP area: $549.65
Time sensitive. DTT strategy applied. Took a trade on it earlier and posted it. Exited in anticipation of a correction up which played out now hoping on the continuation move

GOLD ANTICIPATED BULLISH STRUCTURE FORMATION The chart shows a 1‑hour CFDs (Contract for Difference) price action for Gold (US$/OZ).
1. Trend lines: White diagonal lines draw an ascending channel from around 6 Feb to 12 Feb, indicating an uptrend that was broken with a sharp decline after the 12th.
2. Price movement:
- An initial bullish run lifted gold from ~4,880 to a peak near 5,081.652 (current price).
- After hitting the peak, price dropped into a bearish zone (red shaded area), forming lower highs and breaking the up‑channel.
- The recent action shows a consolidation between 4,914.602 (blue support) and 5,040 (grey resistance).
3. Key levels:
- Support: 4,914.602 (blue box) and 4,880 (lower grey band).
- Resistance: 5,040 (grey zone) and a “Weak Swing High” green box near 5,081.
4. Annotations:
- Green box marks a weak swing high, suggesting potential reversal.
- Red shaded area indicates a bearish zone where sellers are active.
- American flag icons at the bottom likely represent news/events tied to the US market that could impact gold.
5. Outlook : The market appears to be testing the support zone after a breakdown of the bullish channel. A bounce off 4,914.602 could aim for 5,040; a break below could push toward 4,880

EUR/USD | NWOG retest, further fall? (READ THE CAPTION)As you can see in the hourly chart of EURUSD, it still is reacting to the Jan 26th NWOG and drawn to it like a magnet! Currently it's being traded at 1.1864, barely above the NWOG High. I expect it to retest the Feb 16th NWOG, if it fails to go through yet again, I would like to see it drop to the NWOG C.E. before bouncing back up.
If it fails within the next hour: 1.1857, 1.1751 and 1.1745.
If it goes through: 1.1871, 1.1878, 1.1885 and 1.1892.

CRV Approaching Decision Zone on 8H ChartOn the 8H timeframe, CRV is still trading inside a clear descending channel, which defines the broader short term bearish structure. Price recently bounced strongly from the lower boundary of that channel, printing a sharp impulsive reaction with increased volume.
After the bounce, price started forming a rising wedge / rising structure inside the channel. This is important. A rising structure inside a descending channel often acts as a corrective move rather than a full trend reversal.
Right now price is approaching the channel mid–upper resistance zone around 0.2600 – 0.2710. This area also aligns with previous horizontal supply and the dashed dynamic resistance line. So this is not just random resistance, it is a confluence zone.
Key Levels
0.2710 → Major resistance and channel mid area
0.2240 → Local support
0.1805 → Lower channel target if rejection continues
0.4578 → Higher timeframe upside target if full breakout happens
Possible Scenarios
Bullish case:
If CRV breaks and holds above 0.2710 with strong volume, that would indicate a channel breakout. In that case, continuation toward higher timeframe resistance near 0.45 becomes realistic.
Bearish case:
If price gets rejected from 0.26 – 0.27 zone, the rising wedge can break down. That would likely send price back toward 0.22 first, and potentially 0.18 at the lower channel boundary.
At the moment, structure is still bearish overall, but short term momentum is attempting a recovery. The reaction at this resistance zone will decide the next major move.

Fundamental Note: DXY (USD) 16 Feb 2026DXY starts the week near the 97 handle after another weekly slide, as softer inflation dynamics pulled US yields lower and revived rate-cut expectations. With US cash markets closed for Presidents Day, liquidity is thin today, so Tuesday can bring outsized gaps once full participation returns. The Fed is the center of gravity: midweek minutes from the January meeting will be parsed for how firmly (or cautiously) the Committee is leaning on the easing path and balance-sheet messaging. Friday’s key reset is the BEA batch (advance Q4 GDP and core PCE), which can reprice front-end yields and swing DXY quickly. Treasury market dynamics matter just as much—auction demand and term-premium moves can push the dollar around even without new macro surprises. Policy uncertainty and “Sell America” hedging flows remain an overhang, keeping the dollar’s safe-haven premium less reliable than in prior cycles. Geopolitics is still a two-way driver: escalation can trigger USD liquidity demand, but recent episodes have also favored gold/CHF, making the haven bid inconsistent.
Bottom line: it’s a data-and-yields week, and rallies may stay sold unless the Fed minutes and Friday data clearly push back against dovish pricing.
🟢 Bullish factors:
1. Fed minutes read less dovish (or highlight inflation risks) → yields rebound, DXY bounce.
2. Stronger GDP and/or stickier core PCE → “cuts later” repricing supports USD.
3. Weak auction demand / higher term premium → short-term USD support via higher yields.
4. Geopolitical shock → tactical flight to USD liquidity.
🔴 Bearish factors:
1. Minutes confirm comfort with easing and don’t resist market cut pricing.
2. Softer core PCE and/or weaker GDP → lower yields, continued DXY pressure.
3. More FX-hedging/diversification away from USD assets keeps the dollar offered on rallies.
4. Safe-haven flows rotate into gold/CHF rather than USD.
🎯 Expected targets: Neutral-to-bearish while below 97.70–98.00 , with downside toward 96.40–96.00 . A break below 96.00 opens 95.40–95.00 . If DXY reclaims 98.00 on hawkish minutes or hot data, upside can extend to 98.70–99.30 .

NZD/CAD BEARS ARE STRONG HERE|SHORT
Hello, Friends!
We are now examining the NZD/CAD pair and we can see that the pair is going up locally while also being in a uptrend on the 1W TF. But there is also a powerful signal from the BB upper band being nearby, indicating that the pair is overbought so we can go short from the resistance line above and a target at 0.820 level.
Disclosure: I am part of Trade Nation's Influencer program and receive a monthly fee for using their TradingView charts in my analysis.
✅LIKE AND COMMENT MY IDEAS✅

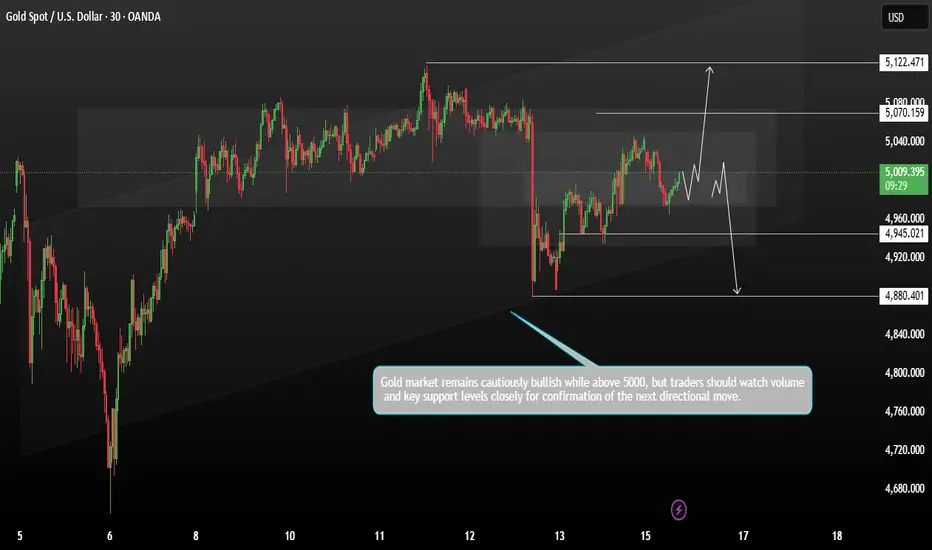
GOLD Consolidation Phase Both sides defined rangeGold remains in a consolidation phase, with price action moving within a defined range. The broader bias stays bullish as long as the key 5000 support level holds.
Technically, today’s price decline appears to be driven by thin trading volume. With the U.S. and China markets partly inactive due to local public holidays, liquidity has been limited. Additionally, some traders booked profits following the strong 2.5% jump in the previous session.
Gold has also given back part of Friday’s CPI-driven gains amid thinner trading conditions and a lack of fresh bullish catalysts.
Technical Outlook If price continues to hold above the 5000 support level, we could see an upside move toward 5070 – 5122 if the price shows weakness and breaks below 5000, the next support levels are seen near 4945, followed by 4880, before a potential recovery attempt.
You may find more details in the chart,
Trade wisely best of luck buddies,
Ps; Support with like and comments for better analysis Thanks for Supporting.

BITCOIN on 200WEMABitcoin is standing on 200 weekly EMA about 68k and trying to hold that. I believe this support will hold to a strong bounce

TLT: bullish structure into 2026NASDAQ:TLT macro structure looks constructive for potential upside momentum into the first half of 2026.
Mid-term support zone: 87–84 — an area where a higher low could form and a new upside leg unfold. As long as price holds above this support, next target resistance zones are 95–100 and 105.
Chart (weekly):

S&P 500 Expectation: 1 WeekFrom S&P, the price can increase till 6898 points, which can work as short term resistance zone, and downside 6765 points is open, above 6898 points it can increase till 7000 points.

16 Jan USDJPY outlook: Potential resistance seenUSDJPY retreated from recent highs and has formed a weekly resistance zone at around 154.548-157.660 which aligns with the 38.2% Fibonacci Retracement. Holding below this resistance zone with reversal signs on the lower time frames may prompt a further drop toward the support zone at around 149.957. Conversely, closing above the resistance zone may prompt BTCUSD extend its rally toward the swing high at around 159.454.
The US dollar-yen retreated following a strong yen rally, as expectations that PM Takaichi could pursue pro-growth fiscal policies without materially worsening public finances boosted confidence in Japan's economic outlook.
Japan's economy expanded 0.1% QoQ in 4Q 2025, rebounding from a contraction in the previous quarter but falling short of market expectations for 0.4% growth. Consumer spending, the largest contributor to GDP, rose only marginally as households grapple with inflation.
Concerns over potential currency intervention and expectations for BoJ normalization may pressure dollar-yen.
By Li Xing Gan, Financial Markets Strategist Consultant to Exness

CAD/CHF SHORT FROM RESISTANCE
CAD/CHF SIGNAL
Trade Direction: short
Entry Level: 0.564
Target Level: 0.563
Stop Loss: 0.565
RISK PROFILE
Risk level: medium
Suggested risk: 1%
Timeframe: 1h
Disclosure: I am part of Trade Nation's Influencer program and receive a monthly fee for using their TradingView charts in my analysis.
✅LIKE AND COMMENT MY IDEAS✅

Sell XAUUSDI am expecting XAUUSD sells from 5000 towards 4950. A bearish flag can be drawn on the 15 minute chart

Gold Outlook: Holiday Low Volume, Range & Smart Money ZonesGold Market Overview for February 16, 2026
Gold traded quietly in a narrow, range-bound session amid very thin liquidity. US markets were closed for Presidents' Day (Feb 16), and China was shut for Lunar New Year (Feb 15–23 start), limiting fresh flows and catalysts.
Price Action: Spot XAU/USD closed near $5,020 (sources vary: ~$5,019–$5,044), with intraday range roughly $5,010–$5,035–$5,070. It saw mild downside pressure, down ~0.3–0.45% from Feb 13/14 levels (~$5,035–$5,043). Futures settled similarly, with minor losses (e.g., -0.14% in some reports).
Key Factors:
Profit-taking after Feb 13's strong ~2.5% rebound (post-cooler US CPI boosting rate-cut bets).
No major data or news over the weekend → subdued, choppy trading.
Broader bull trend intact (earlier 2026 highs >$5,500), supported by safe-haven flows, CB buying, and Fed easing hopes, but holiday low volume added chop and minor pullbacks.
Technical View (chart-aligned): Price consolidated near/above $5,000 psych level, failing big upside push. Fits low-volume holiday "range + manipulation" theme, with possible tests of supports (~$4,989–$5,000) or resistances (~$5,080+). Your smart money zones relevant: price well above buy area (4,888–4,917) but below sell zone (5,098–5,125).
Consolidation day with slight downside bias in thin conditions, prepping for volatility on market reopen. Watch upcoming US data (GDP, PCE) for cues. Uptrend holds overall. 🚀
