#XRP/USDT#XRP
The price is moving within a descending channel on the hourly timeframe. It has reached the lower boundary and is heading towards a breakout, with a retest of the upper boundary expected.
The Relative Strength Index (RSI) is showing a downward trend, approaching the lower boundary, and an upward bounce is anticipated.
There is a key support zone in green at 1.53, and the price has bounced from this level several times. Another bounce is expected.
The indicator shows a trend towards consolidation above the 100-period moving average, which we are approaching, supporting the upward move.
Entry Price: 1.60
Target 1: 1.63
Target 2: 1.67
Target 3: 1.72
Stop Loss: Below the green support zone.
Remember this simple thing: Money management.
For any questions, please leave a comment.
Thank you.
Trend Analysis

DIVGITTS - Inverse H&S BreakoutDIVGITTS :
Inverse Head and shoulder breakout in progress
Need to sustain 765 levels for a strong possible upmove
Breaking 800 can lead take this to 900 levels soon

#XRP/USDT (1h) (spot)#XRP
The price is moving within a descending channel on the hourly timeframe. It has reached the lower boundary and is heading towards a breakout, with a retest of the upper boundary expected.
The Relative Strength Index (RSI) is showing a downward trend, approaching the lower boundary, and an upward bounce is anticipated.
There is a key support zone in green at 1.36, and the price has bounced from this level several times. Another bounce is expected.
The indicator is showing a trend towards consolidation above the 100-period moving average, which we are approaching, supporting the upward move.
Entry Price: 1.44
Target 1: 1.47
Target 2: 1.52
Target 3: 1.58
Stop Loss: Below the green support zone.
Remember this simple thing: Money management.
For any questions, please leave a comment.
Thank you.

AUDCAD1. Price is reacting to a weekly timeframe down trend line.
2. Price is also reacting to a weekly supply level.
3. In the H4 timeframe, there is bearish engulfing candle already closed signaling price may come down.
4. Early sellers could enter the trade or wait for retest of the supply level.

BTC/USDT Liquidity Map & Order Block Analysis🚀 BTC/USDT Bullish Setup | Bitcoin vs Tether Technical Roadmap
📊 Asset: BTC/USDT — Bitcoin vs Tether
Market: Cryptocurrency
Style: Day Trade / Swing Trade
Bias: Bullish Continuation Structure
🔎 Market Structure Overview
BTC/USDT is holding above key higher-timeframe support, maintaining a bullish market structure with:
✅ Higher Highs & Higher Lows (4H / Daily)
✅ Price respecting dynamic Moving Average support
✅ Liquidity sweep completed below recent swing low
✅ RSI recovering from mid-zone (bullish momentum rebuild)
✅ Volume expansion on upside impulse
The broader crypto market sentiment remains constructive as long as BTC defends key structural demand zones.
🎯 Trade Plan
Entry:
Flexible execution — look for pullbacks into intraday demand zones, previous breakout levels, or dynamic MA support for refined risk positioning.
Target: 75,000 USDT
Major psychological resistance
Previous liquidity pool
Potential distribution zone
Overbought condition likely near that level
If price approaches this region with weakening momentum or bearish divergence, profit protection is recommended.
Stop Loss: 67,000 USDT
Below key structural swing low
Below liquidity cluster
Invalidates bullish continuation structure
⚠️ Always adjust risk based on your account size and strategy. Risk management defines survival.
📈 Technical Confluence
🔵 50 & 200 Moving Averages acting as dynamic support
🔵 Bullish order block respected on 4H
🔵 MACD momentum building
🔵 Market structure intact above previous breakout zone
🔵 Liquidity imbalance partially filled
As long as BTC trades above the 67K structural support, upside continuation toward 75K remains technically valid.
🔗 Related Pairs to Watch (Correlation Insight)
Monitoring correlated assets strengthens conviction:
ETH/USDT → Ethereum strength confirms broader crypto risk appetite. If ETH outperforms BTC, bullish continuation probability increases.
BTC/USD → Spot USD pricing gives additional macro perspective vs stablecoin pricing.
TOTAL (Crypto Total Market Cap) → Expansion confirms risk-on environment.
DXY (U.S. Dollar Index) → Inverse correlation. Strong USD = pressure on BTC. Weak USD = supportive for crypto.
NASDAQ (US100) → Positive correlation with risk assets. Equity rally often supports BTC upside.
If DXY weakens while NASDAQ and ETH push higher → bullish confluence strengthens.
🌍 Fundamental & Macro Drivers
Key economic and crypto-specific catalysts influencing BTC:
🏦 U.S. Macro Factors
Federal Reserve interest rate expectations
CPI (Inflation Data)
Core PCE
NFP (Non-Farm Payrolls)
Treasury yields movement
🔎 Lower inflation + dovish Fed tone = supportive for BTC
🔎 Strong USD + rising yields = short-term pressure
💰 Crypto-Specific Catalysts
Spot Bitcoin ETF inflows/outflows
Institutional accumulation data
On-chain exchange reserve changes
Mining hash rate trends
Stablecoin liquidity expansion (USDT supply growth)
Growing ETF inflows + declining exchange reserves = bullish supply dynamics.
🧠 Trading Psychology Reminder
Markets reward discipline, not emotion.
Secure profits when momentum weakens.
Protect capital before chasing targets.
This plan outlines structure — execution and risk control remain personal responsibility.
If this setup aligns with your analysis:
👍 Drop a like
💬 Share your target in comments
🔔 Follow for structured crypto breakdowns
Precision. Patience. Profit.

XRP Recovery Rally Approaches Key 1.57–1.67 ResistanceXRP update (4H)
XRP is bouncing inside a rising channel after the sharp drop, but it’s still trading below the bigger descending trendline, so this looks like a recovery within a broader weak structure.
Price is now heading toward the 1.57–1.67 resistance zone. There aren’t many liquidation levels sitting above this area, but we could still see a bit more upside. The main reason is correlation XRP often follows BTC, and if BTC pushes toward the 72K area, XRP could get a short-term bounce as well.
That said, this zone still looks like a likely reaction area. If price gets rejected here, the expectation would be a move back down, potentially targeting the lower liquidation zone around $1.30.
DYOR, NFA
#XRP #XRPUSDT

BTC analysis🎯 Upside targets:
75,071 (0.5 Fib)
78,612 (0.618 Fib)
⚠️ Major resistance zone between 75K – 79K, possible rejection area.
✅ This is a pullback buy inside a downtrend → take profits step by step.

CSB, Cashbuild Ltd | SA home improvement retailer📌 **CSB | Cashbuild Ltd (JSE: CSB)**
🏗️ SA home improvement retailer with regional footprint across SADC.
💹 **Current Price:** ~R140
📈 **52-Week High:** R200
📉 **52-Week Low:** R120
📊 **All-Time High:** ~R504 (chart reference)
✍️ **Latest News:** Q2 FY2026 update reflects operational trends; dividend yield remains ~4.3%.
.
📰 Latest News & Drivers:
• Cashbuild released a second quarter FY2026 operational update in late Jan 2026.
• Dividends remain part of returns — paid semi-annually with ~R6.26 total last year (~4.29% yield).
• Recent sentiment has been weighed by economic pressures and consumer demand weakness, impacting margins.
.
.
#JSE #CSB #Cashbuild #SAEquities

EURUSD uptrend continuation coiling pattern support at 1.1820The EURUSD remains in a bullish trend, with recent price action showing signs of a breakout within the broader uptrend.
Support Zone: 1.1820 – a key level from previous consolidation. Price is currently testing or approaching this level.
A bullish rebound from 1.1820 would confirm ongoing upside momentum, with potential targets at:
1.1980 – initial resistance
1.2040 – psychological and structural level
1.2080 – extended resistance on the longer-term chart
Bearish Scenario:
A confirmed break and daily close below 1.1820 would weaken the bullish outlook and suggest deeper downside risk toward:
1.1790 – minor support
1.1760 – stronger support and potential demand zone
Outlook:
Bullish bias remains intact while the EURUSD holds above 1.1820. A sustained break below this level could shift momentum to the downside in the short term.
This communication is for informational purposes only and should not be viewed as any form of recommendation as to a particular course of action or as investment advice. It is not intended as an offer or solicitation for the purchase or sale of any financial instrument or as an official confirmation of any transaction. Opinions, estimates and assumptions expressed herein are made as of the date of this communication and are subject to change without notice. This communication has been prepared based upon information, including market prices, data and other information, believed to be reliable; however, Trade Nation does not warrant its completeness or accuracy. All market prices and market data contained in or attached to this communication are indicative and subject to change without notice.

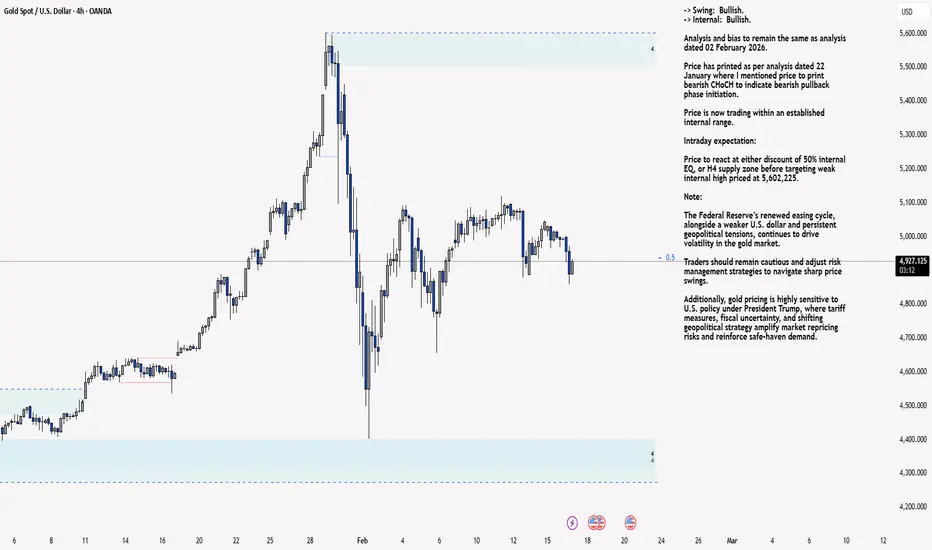
XAU/USD 17 February 2026 Intraday AnalysisH4 Analysis:
-> Swing: Bullish.
-> Internal: Bullish.
Analysis and bias to remain the same as analysis dated 02 February 2026.
Price has printed as per analysis dated 22 January where I mentioned price to print bearish CHoCH to indicate bearish pullback phase initiation.
Price is now trading within an established internal range.
Intraday expectation:
Price to react at either discount of 50% internal EQ, or H4 supply zone before targeting weak internal high priced at 5,602,225.
Note:
The Federal Reserve’s renewed easing cycle, alongside a weaker U.S. dollar and persistent geopolitical tensions, continues to drive volatility in the gold market.
Traders should remain cautious and adjust risk management strategies to navigate sharp price swings.
Additionally, gold pricing is highly sensitive to U.S. policy under President Trump, where tariff measures, fiscal uncertainty, and shifting geopolitical strategy amplify market repricing risks and reinforce safe‑haven demand.
H4 Chart:
M15 Analysis:
-> Swing: Bullish.
-> Internal: Bearish.
Analysis and bias to largely remain the same as analysis dated 02 February 2026. I have added to intraday expectation with respect to alternative scenario.
Price has printed according to analysis dated 30 January 2025 where I mentioned, in alternative scenario, price could print a bearish iBOS as all HTF's require a pullback.
This is exactly how price printed.
Price has since printed a bullish CHoCH to indicate bullish pullback phase initiation.
Price is currently contained within an established internal range.
Intraday expectation:
Price trade up to either M15 supply zone, or premium of 50% internal EQ before targeting weak internal low, priced at 4,402.380.
Alternative scenario:
Price to potentially print bullish iBOS as H4 pullback could be complete, however, Daily and Weekly TF still require pullback.
Note:
Gold continues to exhibit elevated volatility as markets digest the Federal Reserve’s ongoing dovish tilt and persistent global geopolitical tensions.
With uncertainty remaining a dominant theme across global risk assets, traders should prioritise disciplined risk management, as abrupt price swings and liquidity pockets may become increasingly common.
Furthermore, recent tariff announcements from President Trump, particularly those directed at China, have added another layer of instability to the macro landscape. These policy developments have the potential to intensify market turbulence, heighten risk‑off flows, and trigger sharp intraday reversals or whipsaw‑like behaviour in gold.
M15 Chart:
DAX40 bullish continuation support at 24670The DAX remains in a bullish trend, with recent price action showing signs of a corrective pullback within the broader uptrend.
Support Zone: 24670 – a key level from previous consolidation. Price is currently testing or approaching this level.
A bullish rebound from 24670 would confirm ongoing upside momentum, with potential targets at:
25190 – initial resistance
25350 – psychological and structural level
25480 – extended resistance on the longer-term chart
Bearish Scenario:
A confirmed break and daily close below 24670 would weaken the bullish outlook and suggest deeper downside risk toward:
24550 – minor support
24430 – stronger support and potential demand zone
Outlook:
Bullish bias remains intact while the DAX holds above 24670. A sustained break below this level could shift momentum to the downside in the short term.
This communication is for informational purposes only and should not be viewed as any form of recommendation as to a particular course of action or as investment advice. It is not intended as an offer or solicitation for the purchase or sale of any financial instrument or as an official confirmation of any transaction. Opinions, estimates and assumptions expressed herein are made as of the date of this communication and are subject to change without notice. This communication has been prepared based upon information, including market prices, data and other information, believed to be reliable; however, Trade Nation does not warrant its completeness or accuracy. All market prices and market data contained in or attached to this communication are indicative and subject to change without notice.

NASDAQ The unavoidable Bearish Cross..Nasdaq (NDX) is about to form a 1D MA50/ 1D MA100 Bearish Cross the first is almost 1 year (since March 19 2025). That is a very bearish pattern, which before that was last seen at the beginning of the 2022 Bear Cycle.
As we've examined in prior analyses, we see many similarities (mostly in long-term cyclical terms) between the price action of the past 4 months (since the October 30 2025 High) and the start of the 2022 Bear Cycle.
As you can see, Nasdaq currently has a Double Top pattern, which was also formed in late 2021 before the 1D MA50 (blue trend-line)/ 1D MA100 (green trend-line) Bearish Cross. We have currently come very close to testing the 1D MA200 (orange trend-line) and if it breaks, then most likely the 2026 Bear Cycle will be confirmed. Both fractals also exhibit identical 1W RSI patterns, with Channel Down Bearish Divergencies.
This looks like the technical build up for a massive correction. So how low could that be? Well the 2022 dropped by -37.70%, bottoming marginally above the 1W MA250 (red trend-line). That was below the 0.382 Fibonacci retracement level from the previous Bear Cycle bottom. Essentially the 1W MA200 (black trend-line) and the 1W MA250 created a 3-month Buy Zone.
As a result, even though a new -37.70% correction seems like a more extreme scenario as this time it would be significantly below the 1W MA250, a 0.382 Fibonacci retracement test at 18500 wouldn't be unrealistic at all. It would also make a nearly perfect test on the 1W MA200. This time perhaps the Accumulation Zone could be between 19100 - 18500.
---
** Please LIKE 👍, FOLLOW ✅, SHARE 🙌 and COMMENT ✍ if you enjoy this idea! Also share your ideas and charts in the comments section below! This is best way to keep it relevant, support us, keep the content here free and allow the idea to reach as many people as possible. **
---
💸💸💸💸💸💸
👇 👇 👇 👇 👇 👇

BULLISH CONTINUATIONPrice is retracing after having a strong bullish move. After forming the triangle structure we expect price to break downwards to the 4HR demand zone then continue with the trend

EcoByG Bitcoin Daily Analysis #33 — Daily BTC Market UpdateThe 4H chart still carries a bearish bias.
We’re in a distribution / corrective continuation phase — not the start of a pump.
Until 69K is cleanly reclaimed, every upside move is suspicious.
Welcome to Bitcoin Analysis #34
4H Structure — The Bigger Picture
What do we currently see on the 4H timeframe?
MA28 below MA58
MA58 below MA99
All three sloping downward
Price below MA58 and compressing near MA28
📌 The 4H bias remains bearish.
This isn’t just 1H noise — the higher timeframe structure is weak as well.
The 68K Zone — Why Is It So Important?
This area:
Previously acted as support
Has now flipped into resistance
Has been tested multiple times without strong acceptance above
And what do we have now?
A tight compression directly under resistance.
This typically means one of two things:
We’re building energy for a breakout
We’re sweeping liquidity above 68K before a fake move
However, because the broader structure is bearish,
the probability favors a breakdown, not a breakout.
The Most Important Point
Right now the market is in:
Compression under resistance inside a downtrend.
This is the most dangerous place to open mid-range longs.
Why?
Because if a breakdown happens,
it’s usually sharp, fast, and offers little to no exit opportunity.
Until 69K is reclaimed with acceptance,
this market is not strong — it’s just pausing.

US30Price made a double top on the 15min and 5min TF. Now I'll wait and see how it plays out
SL is 60 points above entry

The Day AheadTuesday features a heavy slate of US economic data, including the January NFIB small business optimism survey, Q4 employment cost index, December retail sales, import and export prices, and November business inventories. International releases include Japan’s January machine tool orders, along with January CPI data from Denmark and Norway.
On the central bank front, Fed officials Hammack and Logan are scheduled to speak.
It’s also a busy earnings day, with results from Coca-Cola, AstraZeneca, Gilead Sciences, S&P Global, Welltower, Spotify, BP, CVS Health, Barclays, Marriott International, Williams, Robinhood, Cloudflare, Ferrari, Ford, Datadog, Kering and Fiserv.
The US Treasury will hold an auction of 3-year notes.
This communication is for informational purposes only and should not be viewed as any form of recommendation as to a particular course of action or as investment advice. It is not intended as an offer or solicitation for the purchase or sale of any financial instrument or as an official confirmation of any transaction. Opinions, estimates and assumptions expressed herein are made as of the date of this communication and are subject to change without notice. This communication has been prepared based upon information, including market prices, data and other information, believed to be reliable; however, Trade Nation does not warrant its completeness or accuracy. All market prices and market data contained in or attached to this communication are indicative and subject to change without notice.

REQ - time to bounce upREQ is more or less following ZEC path with last capitulation dip creating more oversold condition than the one we had in March 2020. I expect bounce up and similar to ZEC a push to test diagonal resistance line at ATH range from where again deeper pullback to try form a higher low.

Gold Sets Another Trap for New Buyers!Gold has broken out of its expected ascending triangle structure, and the market has now faced two strong rejections near the neckline around 5,000. This repeated rejection indicates weakening bullish momentum and increasing selling pressure at higher levels.
If price drops again from the 4,965–4,985 zone, it may accelerate directly toward 4,785, which can be considered a potential buying zone. This level aligns with previous demand and could attract fresh buyers.
For now, the market remains technically supported above 4,650, where it may continue to consolidate before making its next major move.
Key Outlook:
➡️ Short-Term View:
The market is temporarily biased to the downside, with a likely move toward 4,785.
➡️ Long-Term View:
From the 4,785 region, gold is expected to regain strength and shift back into a buying phase, making this area important for long-term bullish positioning.

Solana (SOLUSDT) — H4 Formation of Wave 3 Solana (SOLUSDT) — H4 Formation of Wave 3 + Trendline Break (Bearish Continuation)
🔎 Market Structure (H4)
On the H4 timeframe, SOL is showing the technical prerequisites for the development of Wave 3 to the downside. The setup is supported by:
• a breakout below the corrective trendline (structure failure)
• completion of the corrective phase (Wave 2) near local resistance
• rejection from the upper boundary of the corrective structure
• loss of short-term bullish momentum after the rebound
The current price action fits a classic Elliott Wave impulse continuation model, where Wave 3 starts after price exits a corrective channel/formation and begins accelerating in the trend direction.
📐 Elliott Wave Context
Wave 1: the first impulsive move lower that initiated the bearish leg
Wave 2: corrective retracement back into resistance / structure top
Wave 3: expected impulsive continuation down (current scenario)
📌 Key principle:
The bearish scenario remains valid as long as price stays below the high of Wave 1.
📍 Entry
Entry: 85.22
The entry is positioned:
• below the broken trendline (breakdown confirmation area)
• inside the impulse activation zone after the corrective structure failed
• in line with continuation bias rather than attempting a reversal
🎯 Target Levels (Wave 3 Projections)
Targets are projected from impulse expansion zones and marked reaction levels:
TP1: 76.72
TP2: 63.08
TP3: 53.67
TP4: 44.35
Each target represents a potential reaction zone and partial profit-taking level during Wave 3 development.
🛑 Invalidation / Stop Loss
Stop Loss: 91.61
📍 The stop is placed above the high of Wave 1, which:
• invalidates the Wave 3 bearish scenario if breached
• signals a possible transition into an alternative bullish structure
• follows Elliott Wave risk management logic (stop beyond the key swing)
🧠 Risk & Trade Management
Trend-following setup
Wave 3 is typically the strongest wave, but volatility is often elevated.
Recommended management:
• partial profits at TP1 / TP2
• move stop to breakeven after a clean impulsive continuation is confirmed
• avoid increasing risk early — add only on intrawave pullbacks inside Wave 3
• watch for false breakdowns: confirmation improves after a sustained H4 close below the trendline
📌 Summary
SOLUSDT on H4 shows a corrective trendline break and a completed Wave 2 pullback, favoring the start of Wave 3 to the downside.
The bearish scenario remains valid below 91.61, with downside targets at 76.72 → 63.08 → 53.67 → 44.35.

USDJPY Opportunity Using Market Structure, Stochastic, And RSIDuring our trading session today we had one opportunity and it was on the USDJPY and we decided to talk about it.
Yesterday, there were no trades because of the bank holidays in multiple countries; therefore, we talked about the EURAUD which presented an interesting case of contradiction.
Today we used the USDJPY open position to check it against our Trading Philosophy and Trading Plan. We did not test it against the other parts of my pe rsonal trading platform because we still didn't talk about them.
The video shows how we were in line with all our trading philosophy guidelines, and most of our trading plan. There was one rule in our trading plan which we did not abide by which was related the to the 15 Minute time Frame Stochastic.
The rule says that a sell trade is triggered when the 15min Time Frame Stochastic is just getting below the 32 level, but today we took the trade while it was much deeper, but encouraged by the alignment of all the other indicators.
There are two concerns with this trade:
1) The Daily might be satisfied with the liquidity it grabbed and it will continue its upward trend.
2) The Daily Stochastic while it is below the 32 level but the K flipped above the D which if it continued might mean that the trend will go upward against us.
We set the Take Profit as per our trading plan rules at 30 pips, but it is in the middle of a support area at the 15Min chart.
Let us see how it goes. Stay Tuned to get the result of this trade and maybe for other opportunities.
The Investor

Delhivery Limited – Pullback to Golden Zone, Potential UpsideStock: Delhivery Limited
Timeframe: 1D
CMP: ₹435
Technical Overview
Delhivery recently witnessed a strong impulsive rally from the ₹374 zone to ₹459, followed by a healthy pullback into the Fibonacci retracement levels.
Price corrected into the 0.5–0.618 Fibonacci zone (₹416–₹406), which is typically considered the golden demand zone. The stock has shown buying interest near this support area and bounced back toward ₹435.
Key observations:
✅ Respecting the rising trendline support
✅ Holding above 0.5 Fib retracement
✅ Strong bullish volume during impulsive leg
✅ No major breakdown structure yet
This suggests the correction may be a bullish continuation pullback rather than a trend reversal.
📊 Key Levels
Immediate Support: ₹420–₹416 (0.5 Fib zone)
Strong Support: ₹406 (0.618 Fib)
Swing Support: ₹374
Immediate Resistance: ₹459 (recent high)
Next Resistance Targets:
₹488
₹511
🎯 Trade Plan (Positional Swing Setup)
Strategy: Accumulation on dips
Add small quantity near ₹425–₹420
Add more near ₹416–₹406 (golden zone)
Targets:
T1: ₹459
T2: ₹488
T3: ₹510+
Risk-reward looks favorable if price sustains above the 0.618 retracement level.
📌 Structure Bias
As long as the stock holds above ₹406, the structure remains bullish with potential for higher highs. A breakout above ₹459 with volume can trigger fresh momentum toward ₹488–₹511 levels.

XAUUSD Long: Demand Support Signals Potential Upside To 5,000Hello traders! Here’s my technical outlook on XAUUSD (3H) based on the current chart structure. Gold was previously trading within a well-defined ascending channel, where price consistently respected both the dynamic support and resistance boundaries. This structure reflected strong buyer control and orderly bullish continuation, with higher highs and higher lows forming throughout the move. During this phase, multiple breakouts within the channel confirmed sustained demand and aggressive participation from buyers. Eventually, price reached a major pivot high, where bullish momentum peaked and sellers stepped in aggressively. This resulted in a sharp impulsive drop to the downside, breaking the ascending channel and signaling a temporary loss of bullish control.
Currently, gold is trading near the lower boundary of the range, holding above the rising demand line. This behavior suggests that the recent pullback is corrective rather than impulsive. As long as price continues to respect the demand zone and the ascending demand trend line, the broader structure favors buyers. The compression between rising demand and horizontal supply often precedes a directional breakout, and the current structure leans toward bullish continuation.
My primary scenario favors a bullish move as long as XAUUSD holds above the 4,880 demand zone and shows acceptance along the demand line. A sustained push higher could drive price back toward the 5,000 supply level (TP1), which represents a key psychological and technical resistance. Partial profit-taking is reasonable near this area due to expected seller reaction. A clean breakout and strong acceptance above 5,000 would confirm renewed bullish continuation and open the door for further upside expansion. However, a decisive breakdown below demand and loss of the rising structure would invalidate the bullish scenario and signal a deeper correction. Until then, structure and demand dynamics continue to favor the upside. Manage your risk!

EURUSD – Bullish Structure, Buy the Pullback?EURUSD has been overall bullish, printing higher highs and higher lows within a rising structure.
Now price is approaching a key intersection:
• The lower blue trendline defining the overall direction
• A strong demand zone acting as support
As long as this intersection holds, we will be looking for trend-following longs in line with the broader bullish momentum.
Trend is up.
Pullbacks are opportunities... until proven otherwise.
⚠️ Disclaimer: This is not financial advice. Always do your own research and manage risk properly.
📚 Stick to your trading plan regarding entries, risk, and management.
Good luck! 🍀
All Strategies Are Good; If Managed Properly!
~Richard Nasr
