What will be the next gold trend on November 18th?1. Trend and Trend Lines
Prices are trading below a major descending trend line.
→ The overall trend remains down.
The long-term ascending trend line (red) has already broken out,
signaling weakening buying pressure and increased downward pressure.
2. Key Resistance
4.103 – 4.105:
Strong resistance zone where the Fibonacci (0.618–0.5), horizontal resistance, and EMA overlap.
→ Selling is likely to reassert itself in this price range.
3. Key Support
3.932 – 3.940:
This is the strongest support zone, overlapping the Fibonacci extension at 2.618.
This is an important low point in the bearish structure.
4. Price Scenario
If prices fail to retest the resistance at 4.103,
→ A continued decline along the downward trend is likely.
The next target is around 3.932 – 3.950.
Summary
Major Trend: Downward
Strong Resistance: 4.103 – 4.105
Target Support: 3.932 – 3.950
Structure: Trendline Break + Fibo Extension → Prefer Downward Scenario
BUY GOLD: 3932 – 3930
Stop Loss: 3922
Take Profit: 100–300–500 pips
SELL SCALP GOLD: 4064 – 4066
Stop Loss: 4073
Take Profit: 100–300–500 pips
SELL GOLD: 4103 – 4105
Stop Loss: 4115
Take Profit: 100–300–500 pips
Trend Lines

SPX Possibly Breaking SupportPreviously support held on this Higher Low, but it is now creating a bear trend by showing us a Lower High, and now breaking support to possibly create a Lower Low. Wait for a retest on the support which will act as resistance, or on the trendline for a low risk short entry. Feel free to drop your thoughts/opinions!

SOL/USD Spot Long! 11-17-2025 RSI way Oversold with Bullish Divergences on Multiple Timeframes!
Fibonacci Golden Pockets!
Potential for High Profits!
Enter at Own Risk!
Killer Whale Warning!
Extreme Volatility!

It's not that the market is good.We made the right call.Federal Reserve Governor Robert Waller stated that he supports another rate cut at the December meeting due to growing concerns about a sharp slowdown in the labor market and employment. Waller said, "I'm not worried about accelerating inflation or a significant rise in inflation expectations. My focus is on the labor market. After several months of weakness, the September jobs report later this week or any other data in the coming weeks is unlikely to change my view that another rate cut is necessary." Waller specifically noted that he favors another 25 basis point cut. He stated, "I'm concerned that restrictive monetary policy is putting pressure on the economy, especially its impact on low- and middle-income consumers. A rate cut in December would provide additional protection against a faster weakening of the labor market and move policy in a more neutral direction." At the same time, he indicated that price data suggests tariffs will not have a long-term impact on inflation, and another rate cut would be a risk management approach.
The overall tone was neutral, and gold's technical indicators also showed a downward breakout. The next step is to continue the downward trend with consolidation, and the 4000 level will soon be tested. I will focus on the timing of shorting here. The price is severely oversold in the short term, so aggressive shorting is not advisable. The first resistance level to watch is the 4050-4070 area, followed by the 4100 level. Support lies at 4000-3980; a break below this level could see a further 100 USD drop to the 3900-3880 area. The Bollinger Bands on the daily chart are gradually tightening, awaiting the release of the non-farm payroll data to determine the medium- to long-term direction. Currently, the overall strategy remains to follow the technical trend and sell on rallies. For strategy: short gold in batches at 4050-4070 with a target of 4020-4000 (hold if it breaks through). A second short entry point is at 4095-4100. For a short-term long opportunity, watch the 4000 level (short-term counter-trend long positions should target a 15-20 USD profit).

BCH needs to break monthly resistanceIn order to get the explosive move we saw with Zcash. BCH needs to break the yellow line on the monthly time frame. Everyone has been focused on breaking the red line which we did in July, but there hasn't been any substantial uptrend. This is because the red line is formed using wicks and the real resistance is the solid candle of the yellow line.

OUTLOOK XAUUSD 15m Analysis (18th November 2025)Hello Guys, This is just a trade idea not a financial advise.
BUY/SELL SCENARIOS:
BUYS:
1) Body Candle Close the 4047.66 level.
2) Retest the failed 15m Bearish FVG at the 4047.66 level.
3) Create a 3/5m Bullish Engulfing Candle to capitalize on BUYS towards the 4096.00 level.
SELLS:
1) Retest the 15m Bearish FVG at the 4042.83 level.
2) Create a 3/5m Bearish CHOCH with a body candle close (with a FVG).
3) Retest the 3/5m Bearish CHOCH Level to capitalize on SELLS towards the 4000.00 level.
Trade Smart, Trade according to your trading plans!! Cheers

Nasdaq 100: Bulls on the Back Foot as 50DMA Gives WayOur Nasdaq 100 contract is looking heavy. Very heavy.
The price action has been increasingly unconvincing for bulls in November, culminating on Monday with the price closing beneath the 50-day moving average for the first time since April. That’s a noticeable departure from what was seen when tested in the recent past, with the price often reversing higher immediately after. Not on this occasion.
Should the price remain below the 50-day moving average, the next focal point is uptrend support that’s been in place for over six months. In each of the past two sessions the price has traded through the level only to reverse higher, attracting buyers on dips beneath 24650—that’s the battleground to watch in the near term.
If the price were to close beneath uptrend support and 24650, it would bolster conviction that a deeper downside flush may be coming, allowing for shorts to be established with a stop above the uptrend to protect against reversal. 24000 provided support and resistance earlier this year, making it a potential initial target.
Of course, should the price remain above the uptrend, the setup could be flipped with longs set above it or the 50DMA, should the price reclaim it. 25200, downtrend resistance from the record highs, or 25715 are all potential targets. Given the unconvincing price action recently, an obvious bullish reversal signal would be preferable before considering long setups.
The message from RSI (14) and MACD is tilted lower when it comes to directional bias, with the former trending beneath 50, indicating building bearish pressure. MACD remains in positive territory, although having already crossed the signal line from above, at the very least it’s indicating waning topside strength. Given its trajectory, it may soon confirm the bearish signal.
Good luck!
DS

USD/CHF — Riding the Channel Back to CPrice tapped the lower boundary of the long-term ascending channel and reacted exactly where the structure needed it to. The corrective leg into B also mitigated a breaker block, which gives this rebound a stronger backbone.
If this bullish sequence plays out, the next draw sits at the projected C up near the channel’s upper rail. As long as the lower structure holds, the risk–reward on this idea stays clean and controlled.
Following the wave logic, I’m targeting that C extension while keeping risk tucked below the breaker and the channel low. Let’s see if the market respects this geometry.
This is not financial advice.

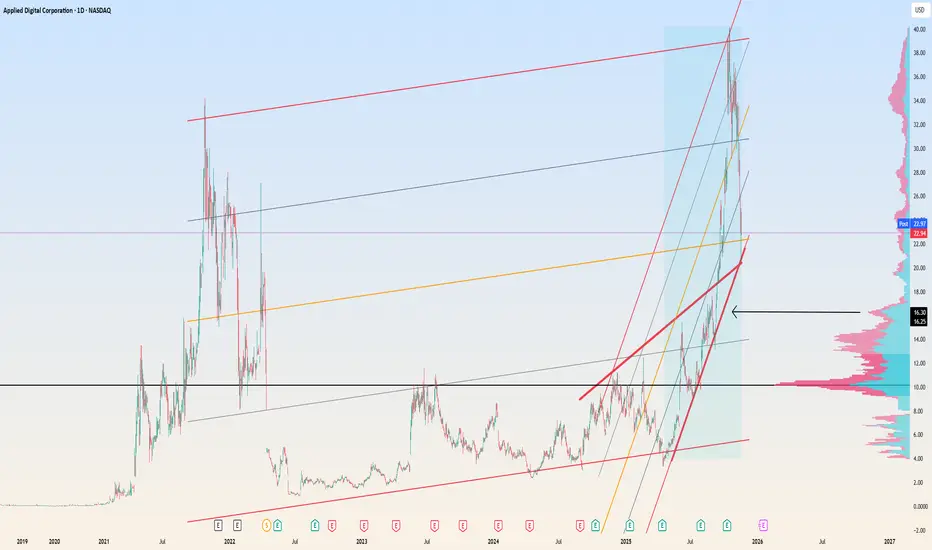
Time to Buy APLD between 22 and 1622 looks perfect from every possible way. 50% of LT channel, intersection two rising trendlines. hope it doesn't break down from 22 then we looking at 16 where first major volume comes in
Gold bulls are losing momentum Arebound means continuingto shortLast week, the longest government shutdown in the US ended. Key economic data will take time to be released, and Federal Reserve officials have been releasing hawkish signals, reducing the probability of a December rate cut. Gold prices rose overall, boosted by a weaker dollar and safe-haven demand, reaching a high of $4245 last week. Silver followed a similar trend but rose even more, once increasing by nearly 10%. On Friday, both spot gold and silver experienced a rapid drop, narrowing the weekly gains. Gold, which reached a high of around $4210, plummeted to around $4030, a drop of up to $180. With the government shutdown over, market trends are likely to change. Gold's historical high of $4381 this year is unlikely to be surpassed this year, and even if it is, it will likely be next year. In my view, last week's high of $4245 was a secondary high. The upward trend that began on October 1st when the shutdown started is coming to an end, and a pullback to the starting point of this upward trend, around $3850, where the shutdown began, is possible.
As seen on the daily chart, gold's short-term support is currently at 4050. Since last Friday, this level has not been breached. As long as 4050 holds, gold is likely to continue oscillating within the 4050-4100 range for a few more days. However, it's important to note that if the daily chart breaks below 4050, caution is advised, as the move could accelerate, potentially targeting the 4000-3900 range. A break below 3900 would likely lead to a return to the starting point around 3850. If strong support is found, it would likely be around 3850-3800.
Secondly, looking at the short-term 4-hour chart, if gold fails to break below 4050, the next resistance levels are around 4080 and 4100. The immediate target is the 4050-4105 range. If it returns above 4100 today, it could reach around 4110. However, it's crucial that 4100 is not breached and held. If it reverses and breaks the high of 4110 from last Friday night's rebound, gold might test 4150, which could be considered the limit of this rebound. This possibility exists and should not be ignored. Of course, the overall trend is bearish, and unless it returns to the 3850-3800 range, avoid rushing into long positions.

GOLD → Consolidation while awaiting the driverFX:XAUUSD is consolidating after a sharp decline. Bulls are consolidating above 4050. Important US data is ahead, including the employment report (NFP) on Thursday.
Decrease in bets on Fed easing: The probability of a cut in December has fallen to 46% (from 67% a week ago) after cautious statements by Fed officials. However, we have not yet seen inflation and employment data, so the situation may change... The September NFP report will be released on Thursday after a 43-day hiatus.
The market is waiting for clarity from the US data. Weak indicators (NFP, inflation) could bring back interest in gold, while strong data would strengthen the dollar and reinforce the correction.
Gold is in the $4030–4100 range. A break above $4100 will require weak US data or unexpectedly dovish rhetoric from the Fed. The $4030–4045 level is key support.
Resistance levels: 4097, 4110
Support levels: 4071, 4046, 4032
I think the market may remain in the current range while awaiting economic data or other drivers. A correction to support may form from resistance. It is important to monitor the levels from below; if the bulls keep the price above support during the correction, gold will be able to strengthen...
Best regards, R. Linda!

USD/JPY Testing Major Resistance at Nine-Month HighsUSD/JPY is attempting to breach confluent resistance today at the 78.6% retracement of the yearly range and the November 2024 high-close at 154.81-155.02. Note that channel resistance rests just higher and the focus is on this slope with a weekly close above needed to fuel the next leg of the April uptrend. A topside breach here would expose subsequent resistance objectives at the 100% extension of the yearly advance at 156.52 and the 2025 high-week close at 157.70.
Monthly open support rests at 154 with a break below the November range lows needed to suggest a larger pullback is underway. Key lateral support is seen at the 2022/2023 highs at 151.91/95.
Bottom line: USD/JPY testing uptrend resistance for a second consecutive week- risk for potential inflection off this mark. From a trading standpoint, losses should be limited to 154 IF price is higher on this stretch with a breach above channel resistance needed to fuel the next major leg higher. Watch the weekly close here for guidance.
-MB

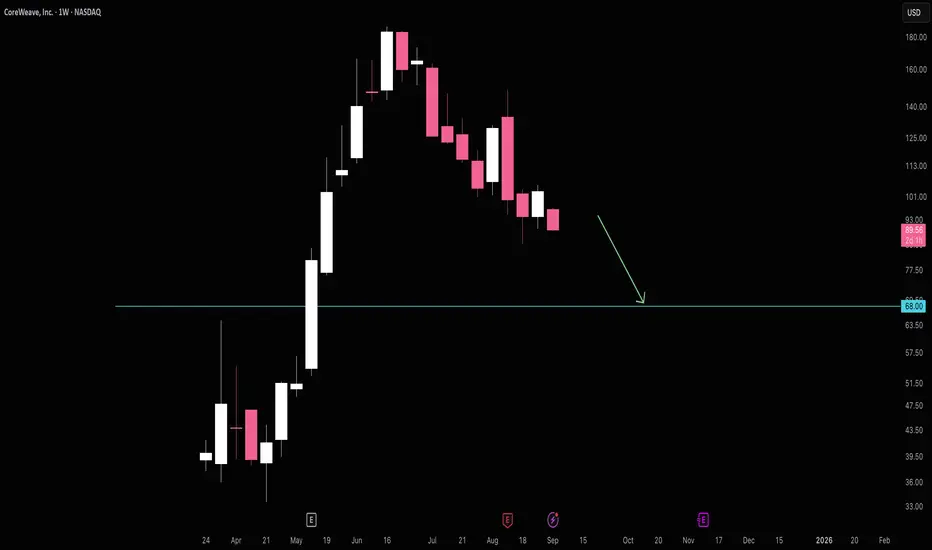
CoreWeave Falling to $68CoreWeave seems to be falling towards $68 support. It's hard to say if $68 will hold, but it's absolutely a good area to close shorts for a potential bounce.
CRWV has yet to form any long term trend lines that I can find. Perhaps this will come from a bounce off $68.
Good luck!
Bitcoin Daily Analysis #13 – November 17, 2025Welcome to another Bitcoin analysis — and apologies for the delay.
As we can see, our bearish scenario has strengthened, and on the daily timeframe, BTC has officially turned downward 📉.
It’s still unclear whether this move is just a correction wave or a full trend reversal, but based on the candle volume, there’s potential for deeper pullbacks ahead.
If Bitcoin reclaims the 106,000 zone and holds strongly above it, the bullish outlook can return 🔄📈.
But if we get rejected from this level once more, we can safely say the trend has shifted into a clear downtrend.
There’s solid buying orders around the 90,000 zone, and we need to see how price reacts there.
A break below this level would make the bullish scenario much harder to achieve 🚨.
Additionally, after building a consolidation box in this region — or waiting for clearer structure — there may be an opportunity to take a short position 📉🟥.
Disclaimer:
This content is for informational purposes only and does not constitute financial or investment advice. © DIBAPRISM
Larry D.Kohn

This is not a gloat. This is Proof!In this video, I’m not showing a “win.”
I’m showing the process.
Months ago, the algorithmic structure on PACS pointed to a very specific liquidity target - more than 30% below where price was trading at the time.
Price tapped that exact level… and has since moved over 100% higher.
This isn’t luck.
It’s discipline, liquidity, and structure.
If you want to understand how the market reveals where it needs to go - and how to trade that story with confidence - come learn how the market really moves and how to identify the algorithms which guide those movements.
(Original analysis videos linked below for a deep dive into how we identified and have been trading this life-changing opportunity)
Happy Trading :)


Buy the bottom of the PayPal uptrendNASDAQ:PYPL is known to be a high value stock with a depressing valuation.
Investors are under optimistic due to the struggling performance the past several years after a dizzying rally during the pandemic.
Recently the stock rallied on earnings due to a deal with Open-AI. Shares quickly gave the spike back and headed lower along with a broader tech pullback on AI bubble fears.
NASDAQ:PYPL has now undercut a long term upward trend line. Judging by the past few times this has happened, it could be a fantastic setup. It looks like the downtrend was broken in late 2024 when the price bottomed on an RSI divergence. The shares seem to be coiling up for a big move, and have been for almost a year now.

GOLD BEARISH MOMENTUM BELOW 4084GOLD – MARKET OUTLOOK
Gold traded sideways between 4103 and 4055 on Monday as investors awaited key U.S. economic data for clues on the Federal Reserve’s rate path, following a sharp 2% decline in the previous session.
Below 4055: A 1H close beneath this support is expected to trigger further bearish momentum toward 4013 → 3979, confirming continuation of the downside bias.
Above 4103: A break and 4H close above this level would shift momentum to the upside, opening the way toward 4148.
Pivot: 25010
Support: 4055 · 4013 · 3979
Resistance: 4103 · 4148
Gold is currently consolidating within its pivot range — maintaining pressure below 4055 keeps the bearish outlook intact, while a stable move above 4103 would signal a bullish recovery.

AVHOL/USDTRY 90% potentialreversal from bottom of the range. on the watch for conservative entry on the downtrend resistance retest. no entry unless the reversal is confirmed 🚫.
stop below daily region close
take profits at upper range & stops to entry.
close position at rectangle target.
⚠️ not a financial advice - DYOR

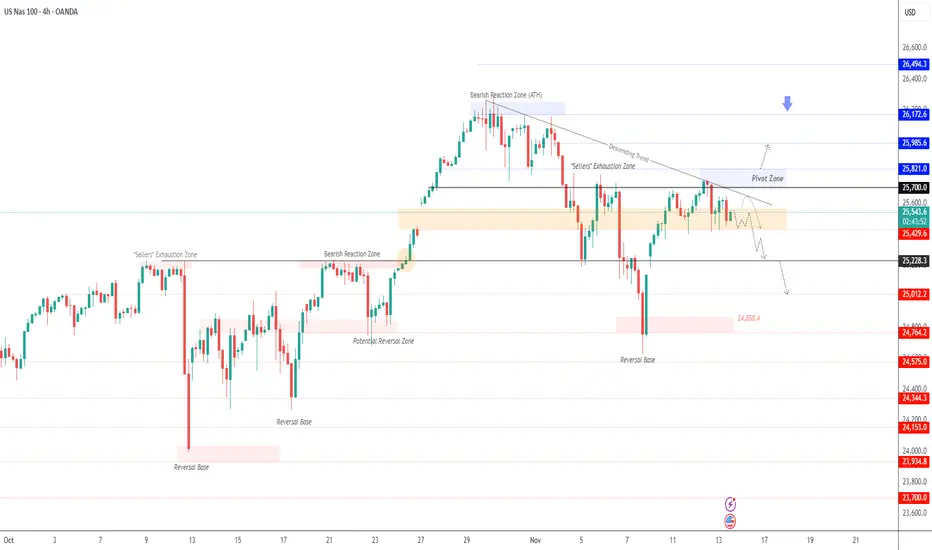
Tech Sector Pauses|USNAS100 Awaits Direction Between 25430–25700USNAS100 | Overview
The price is currently consolidating between 25430 and 25570, showing a slight bearish bias as momentum weakens near resistance.
As long as the index trades below 25570 and 25700, the outlook remains bearish, with downside potential toward 25430 and 25220.
A confirmed break below 25220 would accelerate losses toward 25010.
However, if the price closes a 4H candle above 25700, it would signal a bullish reversal, opening the path toward 25820 and 25985.
Pivot Line: 25570
Resistance: 25700 · 25820 · 25985
Support: 25430 · 25230 · 25010
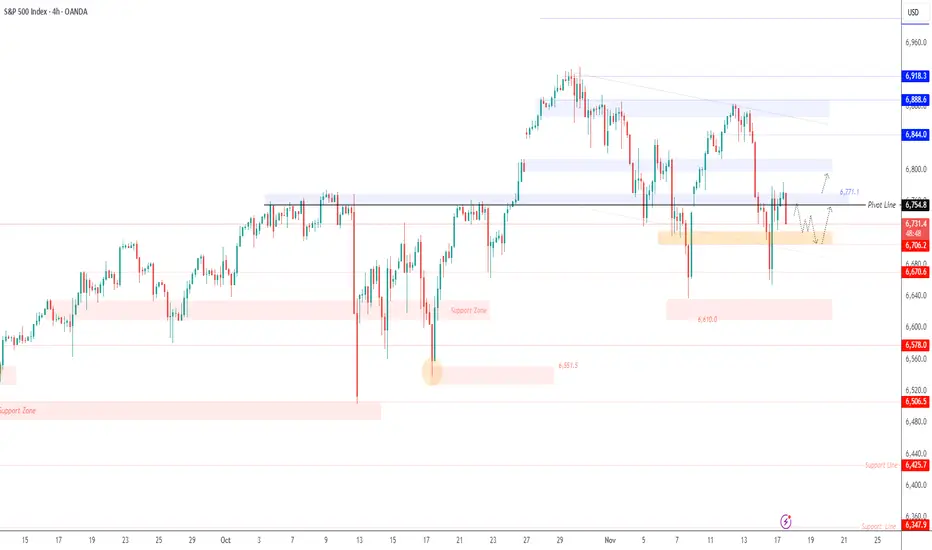
SPX500 | Key Levels Ahead of Nvidia EarningsSPX500 | Overview
U.S. stock futures edge higher as investors await Nvidia’s earnings report and delayed government data, which could provide clues about the economy and the Federal Reserve’s next policy steps.
Technically:
The SPX500 remains in a neutral-to-bearish zone, with direction depending on the upcoming 4H candle close.
A close below 6755 would confirm a bearish continuation toward 6706 and 6670.
However, a 4H close above 6769 would shift momentum to a bullish trend, targeting 6813 and 6838.
Pivot Line: 6754
Support: 6706 · 6670 · 6637
Resistance: 6770 · 6813 · 6838
Gold Rise Dream Shattered
news:
On Monday (November 17), spot gold rose and then fell back. It briefly broke through the $4,100 mark in early trading and rose moderately to $4,105 per ounce during the Asian session. It then fluctuated and weakened, falling back below $4,100 and touching a low of $4,050. It maintained a defensive posture for the third consecutive day on Monday.
The highly anticipated October US non-farm payrolls report will be released on Thursday, followed by the FOMC minutes on Wednesday. These will play a crucial role in influencing short-term dollar price dynamics and providing some meaningful impetus to precious metals.
Friday's preliminary manufacturing PMI figures for Europe and the US, along with the revised University of Michigan Consumer Sentiment Index, could amplify market volatility, especially if they indicate persistent inflation or weak consumption. Additionally, Friday will see the release of monthly US state employment and unemployment data for October 2025, which investors should also pay close attention to.
Technical Analysis:
The weakness below the 200-period SMA on the 4-hour chart may find some support near Friday's low of around $4,030. Following that is the psychological level of $4,000; a decisive break below this level could allow gold prices to accelerate their decline towards the $3,930 support level, then the $3,900 level, and finally the late October low of around $3,885.
There are many negative signals on the 1-hour chart. The price is clearly constrained by the Bollinger Middle Band (4100). The RSI is converging at the 50 level and showing a downward trend. The MACD has entered the oversold zone, but there is still no clear indication of a rebound.
Signal:
Buy:4115-4110 SL:4125 TP:4030-4050

BANKNIFTY 18/11/2025 support resistance levels 𝐁𝐀𝐍𝐊𝐍𝐈𝐅𝐓𝐘 18/11/2025 𝐒𝐮𝐩𝐩𝐨𝐫𝐭 𝐑𝐞𝐬𝐢𝐬𝐭𝐚𝐧𝐜𝐞 𝐋𝐞𝐯𝐞𝐥𝐬
𝐒𝐭𝐨𝐩𝐥𝐨𝐬𝐬🎯
#𝐘𝐨𝐮𝐫 𝐭𝐫𝐚𝐝𝐞 𝐲𝐨𝐮𝐫 𝐫𝐢𝐬𝐤
