USDJPY choppy movementsUSDJPY, like USDX and other correlating pairs, forms a base for a rally or further decline. If the USD goes up, I think it could happen quickly. The overall market willingness to buy back the price seems quite optimistic, but the downward trendline is very strong. Until the trendline is broken, the uptrend is not worth thinking about.
Trendlinesuport

SPY next moveI would like to see SPY break the upper trend line of the down trend channel, test the same trend line as a new support trend line and then move up to 430 in a symmetric move with the latest swing just before the break

xrp target?In the monthly timeframe, xrp seems to be dealing with further declines and has been successful so far. But what is scary is that MACD has not yet been tested positive and ChicoSpan has managed to break TenkenSen. So, it should wait for the MACD to become positive or show a record reaction to the lower trend line. Because if it don't show a reaction, it should prepare itself for a further fall, and the target will be $0.22.

GOING SHORT IN XAGUSD BY TRADING STRATEGYBullish Indications
1. Higher Highs and Lows
2. Trend line not broken
Bearish Indications (BIASED SHORT)
1. Rejected from Resistance Area
2. Double TOP OR BAT Pattern Formation In Progress
3. AB=CD Reversal Pattern
4. Formation of Bearish Divergence

VIJAYA - Ascending parallel channel patternAll details are given on chart. If you like the analyses please do share it with your friends, like and follow me for more such interesting charts.
Disc - Am not a SEBI registered. Please do your own analyses before taking position. This post is only for educational purposes and not a trading recommendation.

XRPUSDTHello Dear friends
We are still below the downtrend line, our $0.235 support area is still intact.
We have a positive RSI divergence on the daily time frame. But we must keep in mind that the momentum of the downward trend is strong.
On the lower time frames, if the range of $0.3733 is consumed, the possibility of forming a downward trend is strengthened up to the range of $0.3416.
But for further correction, I think yellow range orders ($0.5281) are needed.
We would be happy to hear your comments

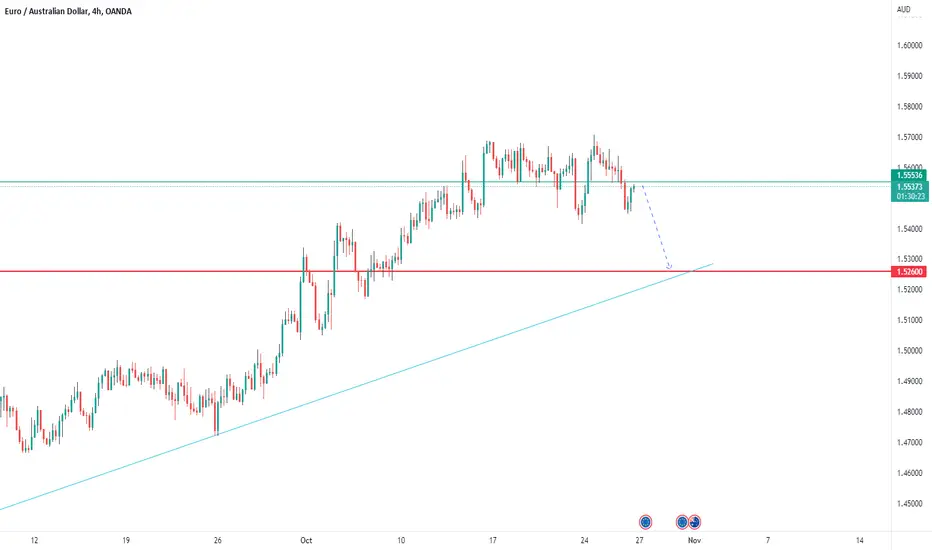
EURAUD Takes A BreatherEurAud has been on a steady bull run and now takes a breather thus experiencing sideways trading.
We can expect a drop towards the trendline .
Some BOS and ChOCH In this chart we can see some pattern that fits to this strategy.
We saw a lot of liquidity in the path few months.
And sometimes the market can give u some bouncy bull trend for a couple of days or even week or two.
In this chart , u can see some pattern that give us some indication that may be some poll up , and then it going down to check the LL prices
And after that we can hope.

IRCTC Supply zone Breakout *IRCTC*
Time Frame: Daily
Observation:
* Supply Zone Breakout
* Swing High Break
* Mean (EMA) Diversion
Resistance/Target: 814 908 1001 1062
Support: 688, Dynamic Support at 200 EMA

HCL Technologies Ltd - Trendline Support + Just a View📊 Script: HCLTECH (HCL TECHNOLOGIES LIMITED)
📊 Nifty50 Stock: YES
📊 Sectoral Index: NIFTY IT / NIFTY 500
📊 Sector: Information Technology
📊 Industry: Computers - Software & Consulting
Key highlights: 💡⚡
📈 Script is trading near at its support level which is around 897.
📈 RSI is nearby to its Oversold zone.
📈 script may bounce back from its support level keep an eye on it.
📈 Fundamentals are also strong, one can buy on dips for long term.
📈 if it start moving upward first target will be 990 , Always maintain your Risk & Reward Ratio.
⏱️ C.M.P 📑💰- 895
🟢 Target 🎯🏆 - 990
⚠️ Important: Always maintain your Risk & Reward Ratio.
⚠️ Purely technical based pick.
✅Like and follow to never miss a new idea!✅
Disclaimer: I am not SEBI Registered Advisor. My posts are purely for training and educational purposes.
Eat🍜 Sleep😴 TradingView📈 Repeat🔁
Happy learning with trading. Cheers!🥂
Happy Navaratri 🕉️ 💃🏻🕺🏻

UNIUSDTHello Dear friends
In the four-hour period, the negative divergence of the RSI has been issued to us, but we do not have another signal to form a corrective trend!
And as long as the upward trend line is maintained and the movement trend is not placed below the price range of $6.39, the probability of breaking the resistance range of $7.25 is high.
We would be happy to hear your comments

BPCL good for swing BPCL GOOD FOR SWING TRADING
This stock is support the moving average 44 and trendline so it is a good stock to buy
Buy = 334
stop los= 222
1st target =342
2nd target= 367
***WAIT FOR BIG TARGETS**** after trendline breakout
BIG TARGETS ======== 1st 390 .............2nd 450

PEL - Bullish viewAll details are given on chart. If you like the analyses please do share it with your friends, like and follow me for more such interesting breakout charts.
Disc - Am not a SEBI registered. Please do your own analyses before taking position. This post is only for educational purposes and not a trading recommendation.

ETHUSD LongETHUSD is following the bullish pattern of the Dow theory and is making higher highs and lows. The ascending trendline is also acting as a support and it will probably go bullish from here.

Up or Down?In the latest price forecasts in the AUDCHF currency pair, we see the price meeting its upward trend line, which, according to the slope and acceleration of the movement, can cross the levels in front of it downwards or continue to fluctuate for a while in the span of its trading range.

EURCAD OVERSOLD - BUYThe pair has dropped significantly in the past few months and is oversold on the daily and weekly timeframe.
In addition to that,the price has closed above the support level twice now and has formed a double bottom pattern with bullish divergence on the daily timeframe.
This is a clear indication of a bullish retracement in the coming weeks.
Initial targets are :
1.3300
1.3450
1.3714
Look for entries on lower timeframes with proper risk management.

HOW TO USE TRENDLINE FOR ENTRYIn this video i showed you how to use Trendline for entry in the easiest and simple way.
What do you think about this?
I would like to hear your view, drop your comment.

What to buy and how to ride the commodity bull?Discussion:
1. Example on Natural Gas - breaking away from its range
2. Beginning stage of a “Growth” stage
3. Identifying and trading in its uptrend with multiple timeframes
Disclaimer:
• What presented here is not a recommendation, please consult your licensed broker.
• Our mission is to create lateral thinking skills for every investor and trader, knowing when to take a calculated risk with market uncertainty and a bolder risk when opportunity arises.

RSI & Fib analysis on LunaLast time the daily RSI was this low was late May 2021 when we retraced to 0.786 of the prior run, finding support here until going on an epic 2000% run over 10 months.
Following yesterday's red candle we've bounced off the 0.786 fib of the retracement from said run, which coincides with a trend line I've had drawn in since this time last year.
Reversing the first fib shows we reached just above the 5.272 at it's peak. Doing the same on the latest fib gives us a target of $614!
Short term I expect a bounce to around $50. Will be keeping a close eye to see if we hold .786 and form bullish divergence

AUDJPY TRENDLINE ANALYSISSimple Trendline analysis for this pair, for now we may see some sells come in before buys continue to push ip

GBPUSD , 2H BUYGBPUSD is very Near to the ORDER BLOCK Area Where We can Place a Buy Limit Order and From This Order Block We have the Major Chances of the Market to Shift to the Upside. Also There is a Strong Trendline Support

XTZ - Tezos ANALYSISTezos (XTZ) on 4 hour timeframe formed a Wolfe pattern and it is heading towards it first target of $3.22.
The RSI indicator is also forming a divergence which supports it bullishness.
The support trendline is good for building buy/long position a stop loss below it is advised but not tight to avoid being chased out of the momentum.

GBPCHF | Perspective for the new week | Follow-up detailsA follow-up detail on the GBPCHF was published last week (see link below for reference purposes) where we closed with around 60pips profit when the price hit our stop-loss.
Now, the structure is tending to reveal to us another opportunity to give a buy situation another chance as the bullish trendline identified on the 1H time frame shall serve as our yardstick for a trend continuation.
Risk Disclaimer:
Margin trading in the foreign exchange market (including commodity trading, CFDs, stocks etc.) has a high risk and is not suitable for all investors. The content of this speculation (including all data) is organized and published by me for the sole purpose of education and assistance in making independent investment decisions. All information herein is for your reference only and I take no responsibility.
You are hereby advised to carefully consider your investment experience, financial situation, investment objective, risk tolerance level, and consult your independent financial adviser as to the suitability of your situation prior to making any investment.
I do not guarantee its accuracy and is not liable for any loss or damage which may result directly or indirectly from such content or the receipt of any instruction or notification therewith.
Past performance is not necessarily indicative of future results.
